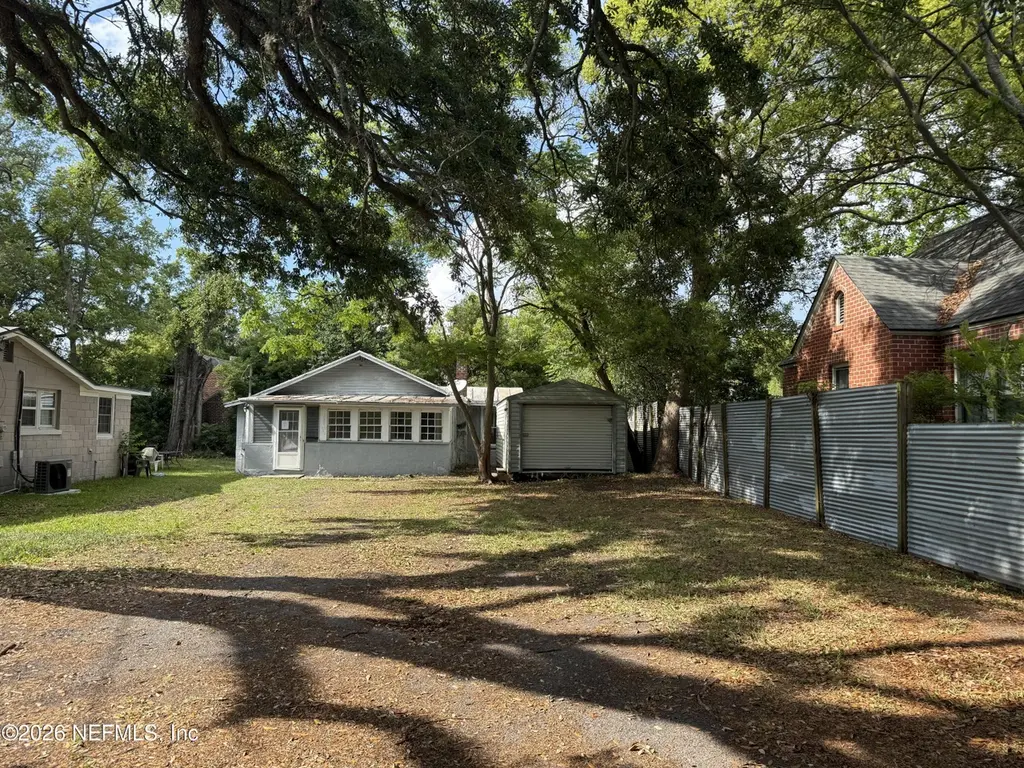
4805 College St · Jacksonville, FL
Flood risk 1/10 · Minimal
- FEMA flood zone
- X (unshaded)
- Chance of flooding over 30 yrs
- 0.0%
- Est. flood insurance / yr
- $507 – $1,088
Fire risk 1/10 · Minimal
- Est. fire insurance / yr
- $947 – $1,759
Heat risk 9/10 · Severe
- Hot days now (above 107°F)
- 7 days/yr
- Hot days in 30 yrs
- 20 days/yr
Wind risk 9/10 · Severe
- Chance of severe wind over 30 yrs
- 99.0%
Air-quality risk 5/10 · Moderate
- Unhealthy air days now
- 7 days/yr
- Unhealthy air days in 30 yrs
- 7 days/yr
Risk factors via First Street. Map © Google.
Why this score? — see what drove the B grade
The composite is a weighted blend of 9 inputs, each scored 0–100. Each bar is that input's sub-score; the figure is the points it added to the 100-point composite (weight × sub-score).
- Cash flow +30.0/30.0
- 1% rule +10.0/10.0
- DSCR +10.0/10.0
- ARV discount +7.5/15.0
- Livability +4.2/5.0
- Schools +3.9/10.0
- Rent growth +2.9/5.0
- Condition / age +2.5/5.0
- Appreciation +0.0/10.0
$49,900
🖨 Deal sheet 📄 Offer letter ✓ Due diligence
Listing remarks
Unique 1 bedroom home set back on a 50 x 115 lot in Murray Hill area. Home needs repair to be habitable. Priced as a potential lot sale. demo and build new. Selling in AS IS condition. This property is available to OWNER OCC BUYERS ONLY in the first 30 days of listing period * Investor or non owner occ buyer offers will be considered on day 31 * All offers need to be presented via loading on Propoffers via an agent. Agents pls see below.
Key facts
- 5,662 sq ft lot
- Built 1924
- Listed 23 days
Property features AI
Finance
- HOA & community: Not a senior community
Exterior
- Parking: Off-street parking
- Utilities: Public sewer; Electricity connected; Sewer connected
- Home design: Single-family residence; Used as a single-family home
- Exterior features: South-facing lot
Interior
- Kitchen: No appliances included
- Bedrooms: 1 bedroom
- Flooring: Wood
- Bathrooms: 1 full bathroom
- Heating & cooling: Electric heating; Central air conditioning
- Interior features: Wood flooring; Fireplace (1)
Neighborhood map
What this means for you Summary
Snapshot
- This is a 1-bed/1.0-bath single-family listed at $50k.
Deal economics
- At list price, monthly cash flow is $485 ($6k/yr) — positive.
- The deal already cash-flows at list — no discount required.
- Meets the 1% rule at list price ($1k rent vs $50k).
- Recommended offer: $49k (1.5% below list) — sets the bar for market timing.
- Cap rate 17.9% vs local median 4.0% in Jacksonville — top-decile yield for the area; either an underpriced asset or a hidden risk that comps aren't pricing in. Stress-test before assuming the spread holds.
Location & tenants
- Location reads 83/100 on livability (#50 in FL, #911 nationally) — a professional / high-income tenant draw. Strengths: amenities A+, commute A+, housing A+.
- Duval (urban): math 46% / reading 45% proficiency, ranked #48 of 73 in FL (top 66%) — families likely to look elsewhere, expect single-tenant / working-renter base with shorter leases.
- Market conditions: Rents rising (+1.7%/yr); 320 active listings in the ZIP; 28 comparable units currently listed for rent nearby; rentals at typical pace (median 21d on market — plan ~3-4 weeks tenant-placement turnaround); 6,503 units permitted in Duval County in 2024 (1,131 in 5+ unit buildings).
Forward outlook
- Local home prices are declining (-3.0%/yr); year-one equity from $345 of loan paydown is wiped out by about $1k of value loss. Plan a longer hold.
- Duval County population projected at +19% by 2050 — long-run rental-demand tailwind backs the buy-and-hold thesis.
- At projected returns (-3.0% appreciation + 1.7% rent growth), your $14k cash investment doubles in ~3 years — after that, you're playing with house money.
Negotiation context
- It's been on market 23 days — a 2% lower offer ($49k) is reasonable based on typical stale-listing flexibility.
- 3 sale attempts since 2y ago with the ask held roughly flat each time — persistent listings suggest the price (not the market) is what's stuck; bring a comps-based counter.
Risks & watch-outs
- Watch-outs: built in 1924 — expect roof / HVAC / electrical / plumbing capex.
- Climate carrying-cost: severe wind risk, 99% chance of damaging wind over 30y; extreme-heat days projected 7→20/yr by 2055 (HVAC capex compounding) — expect insurance premiums to compound above CPI over the hold.
Questions for the listing agent
- Built in 1924 — when were the roof, HVAC, electrical panel, plumbing, and water heater last replaced?
- Is there a deadline driving the sale (1031 exchange, divorce, estate, relocation)? That informs how much negotiation room exists.
- Schools are B-rated — typically a magnet for longer-tenancy family renters. What's the average tenant stay here, and is there a school-zone premium baked into asking?
- What's the average days-on-market for RENTAL listings here right now (not sales)? A rising rental-DOM trend means longer vacancies and softer asking-rent achievability than the comps imply.
- What's the recent tenant-quality profile in this submarket — average credit score on applications, eviction rate, late-payment / NSF rate, and stable-employment percentage? A property-management company in the area should have these aggregated.
- How much new for-sale + rental construction is in the pipeline within 1–3 miles? Heavy new supply typically softens prices + rents 12–24 months out; constrained supply supports both.
Investment metrics
- 1% rule
- 2.10% ✓
- Cap rate
- 17.95%
- Cash-on-cash
- 41.62%
- DSCR
- 2.85
- GRM
- 4.0
CMA / ARV
- ARV (on-the-fly)
- $173,732
- Comps found
- 2
Show comp detail 2 sales within ~0.75 mi
| Address | Dist | Beds/Ba | Sqft | Sold | Price | $/sf | Match |
|---|---|---|---|---|---|---|---|
| 4021 Myra St | 0.65mi | 2/1.0 (+1) | 744 (+10%) | 5mo | $150,000 | $202 | 43 |
| 4035 Ernest St | 0.66mi | 2/1.0 (+1) | 760 (+12%) | 19mo | $195,000 | $257 | 28 |
Match score weights: distance 35% · size 25% · config 20% · recency 20%. Top-matched comps best support the ARV.
Projected returns pro-forma
-3.0% appreciation · 1.73% rent growth · sell at horizon
- IRR
- 36.8%
- Equity multiple
- 2.54×
- Total profit
- $21,467
- Equity at exit
- $7,440
- IRR
- 42.8%
- Equity multiple
- 4.81×
- Total profit
- $53,197
- Equity at exit
- $4,314
Cash invested: $13,972 (down + closing). Projections, not guarantees.
Landlord ↔ Tenant lean methodology
- Overall (STATE)
- 87 Strongly Landlord-Friendly
- State Florida
- 87 Strongly Landlord-Friendly · R+3
- County
- — inherits STATE
- City
- — inherits STATE
ZIP-level market 32205
- Rents YoY
- 1.7%
- Active inventory
- 320
- Price-to-rent
- 4.0×
Monthly cashflow live
- Estimated rent
- $1,050 high interval (Pro) →
- Mortgage (P&I)
- −$262
- Tax est. 1.5%
- −$62 /mo · $748/yr
- Insurance
- −$21
- HOA
- −$0
- Vacancy / Maint / Mgmt
- −$220
- Net cashflow
- $485
Break-even live
UW: 25.0% down · 7.5% · 30yr · 1.5% tax · 5.0% vac · 8.0% maint · 8.0% mgmt
Financing live
Cash to close
- Down payment
- $12,475
- Closing costs
- $1,497
- Reserves months
- —
- Total cash needed
- —
Loan-product check · same deal, 3 products live
Conventional
25% down · 7.5% · 30yr
- Down + closing
- —
- Monthly P&I
- —
- Monthly cashflow
- —
- DSCR
- —
- Eligible?
- —
Personal DTI + credit; lowest rate.
DSCR
20% down · 8.5% · 30yr
- Down + closing
- —
- Monthly P&I
- —
- Monthly cashflow
- —
- DSCR
- —
- Eligible?
- —
No personal income docs; deal must DSCR.
Hard money
10% down · 12.0% · 12mo
- Down + closing
- —
- Monthly P&I
- —
- Monthly cashflow
- —
- DSCR
- —
- Eligible?
- —
Short-term bridge; refi at stabilization.
Rent comps 28 comps
| Address | Beds | Baths | Sqft | Rent | $/sqft | DOM | Units | Dist |
|---|---|---|---|---|---|---|---|---|
| 4808 Lawnview St Unit B Jacksonville, FL | 1.0 | 1.0 | 600 | $995 | $1.66 | 16d | 1 | 0.13mi |
| 1111 Woodruff Ave Jacksonville, FL | 1.0 | 1.0 | 500 | $1,050 | $2.10 | 16d | 2 | 0.54mi |
| 1131 Woodruff Ave Unit 6 Jacksonville, FL | 1.0 | 1.0 | 500 | $1,025 | $2.05 | 4d | 1 | 0.59mi |
| 1131 Woodruff Ave Unit 1 Jacksonville, FL | 1.0 | 1.0 | 500 | $1,050 | $2.10 | 23d | 1 | 0.59mi |
| 1165 Randolph St Unit 17 Jacksonville, FL | 1.0 | 1.0 | 525 | $1,025 | $1.95 | 23d | 1 | 0.67mi |
| 5433 Leaming Ave Jacksonville, FL | 2.0 | 1.0 | 548 | $1,099 | $2.01 | 19d | 1 | 0.74mi |
| 5340 Kingsbury St Jacksonville, FL | 1.0 | 1.0 | 600 | $900 | $1.50 | 1d | 1 | 0.76mi |
| 5344 Kingsbury St Jacksonville, FL | 1.0 | 1.0 | 600 | $1,000 | $1.67 | 23d | 1 | 0.77mi |
| 1131 Lake Shore Blvd Unit 1131 Jacksonville, FL | 2.0 | 1.0 | 696 | $995 | $1.43 | 19d | 1 | 0.85mi |
| 5461 Lenox Ave Jacksonville, FL | 1.0 | 1.0 | 350 | $699 | $2.00 | 23d | 1 | 0.85mi |
| 1160 Comanche St Jacksonville, FL | 1.0 | 1.0 | 500 | $995 | $1.99 | 1d | 1 | 0.88mi |
| 1160 Comanche St Jacksonville, FL | 2.0 | 1.0 | 625 | $1,095 | $1.75 | 21d | 1 | 0.88mi |
| 1159 Pangola Dr Jacksonville, FL | 2.0 | 1.0 | 676 | $896 | $1.33 | 23d | 1 | 0.95mi |
| 3343 Post St Unit 1 Jacksonville, FL | 1.0 | 1.0 | 642 | $925 | $1.44 | 10d | 1 | 0.95mi |
| 3337 Post St Unit 2 Jacksonville, FL | 1.0 | 1.0 | 642 | $925 | $1.44 | 10d | 1 | 0.96mi |
| 5687 Akra Ave Jacksonville, FL | 1.0 | 1.0 | 448 | $950 | $2.12 | 23d | 1 | 1.00mi |
| 3329 Mayflower St Unit 3331 Jacksonville, FL | 1.0 | 1.0 | 616 | $1,095 | $1.78 | 4d | 1 | 1.02mi |
| 3673 Randall St Jacksonville, FL | 1.0 | 1.0 | 550 | $1,100 | $2.00 | 16d | 1 | 1.06mi |
| 3233 Post St Jacksonville, FL | 2.0 | 1.0 | 750 | $1,095 | $1.46 | 23d | 1 | 1.10mi |
| 3250 Phyllis St Jacksonville, FL | 2.0 | 1.0 | 720 | $850 | $1.18 | 23d | 1 | 1.13mi |
| 3236 Phyllis St Unit 3244 Jacksonville, FL | 2.0 | 1.0 | 720 | $850 | $1.18 | 23d | 1 | 1.15mi |
| 1078 Day Ave Jacksonville, FL | — | 1.0 | 350 | $995 | $2.84 | 23d | 1 | 1.19mi |
| 3324 Randall St Jacksonville, FL | 1.0 | 1.0 | 450 | $975 | $2.17 | 23d | 1 | 1.20mi |
| 1338 Wolfe St Unit 2 Jacksonville, FL | 1.0 | 1.0 | 552 | $1,200 | $2.17 | 17d | 1 | 1.23mi |
| 5710 Lenox Ave Jacksonville, FL | 1.0–4.0 | 1.0–2.0 | 988 | $1,027 | $1.04 | 23d | 1 | 1.31mi |
| 3357 Columbus Ave Jacksonville, FL | 1.0 | 1.0 | 550 | $1,000 | $1.82 | 17d | 1 | 1.49mi |
| 3359 Columbus Ave Jacksonville, FL | 1.0 | 1.0 | 525 | $1,000 | $1.90 | 11d | 1 | 1.50mi |
| 3359 Columbus Ave Jacksonville, FL | 1.0 | 1.0 | 550 | $1,000 | $1.82 | 23d | 1 | 1.50mi |
Listing history 10 events
-
2026-05-08historical Active Under Contract
-
2026-04-28$49,900 Active
-
2025-09-04historical
-
2025-09-04status Pending
-
2025-09-03$79,000 Active
-
2024-12-31historical
-
2024-11-12price $124,990
-
2024-11-07price $131,990
-
2024-11-03$134,990 Active
-
2004-12-14soldstatus $50,000
ⓘ Source: listings_history table (triggers on properties + properties_extension) + one-shot
backfill from property_details.listing_events for pre-trigger history.
Climate risk First Street
- Flood 1/10 Low FEMA zone X (unshaded) · 0% chance over 30 yrs
- Wildfire 1/10 Low
- Heat 9/10 Extreme 7 d/yr ≥107°F today · 20 d/yr by 30 yrs out
- Wind 9/10 Extreme 99% chance of damaging wind over 30 yrs
- Air quality 5/10 Major 7 unhealthy d/yr today · 7 by 30 yrs out
Nearby sold comps map
Loading sold comps map…
Walkable amenities ~0.75 mi
Loading nearby amenities…
Taxation est. · year 1
- Rental income
- $12,599
- − Mortgage interest
- −$2,795
- − Property taxes
- −$748
- − Insurance
- −$250
- − Repairs & maintenance
- −$1,008
- − Management
- −$1,008
- − Depreciation
- −$1,452
- Taxable income
- $5,338
- Est. tax owed @ 24.0%
- −$1,281
- After-tax cash flow
- $4,534/yr
For passive investors: Depreciation is non-cash, so a rental often shows a tax loss while cash-flowing — sheltering income. Rental losses are passive: they offset passive income freely, and up to $25,000/yr can offset ordinary (W-2) income if you actively participate and your MAGI is under $100k (phasing out to $0 by $150k); unused losses carry forward. On sale, claimed depreciation is recaptured at up to 25%, and gains may owe capital-gains tax (a 1031 exchange can defer both). Figures are a year-1 estimate at your 24.0% rate — not tax advice; consult a CPA.
Schools (NCES district)
- District
- Duval
- NCES district ID
- 1200480
- Math proficiency
- 46% ▼ -11.00%
- Reading proficiency
- 45% ▼ -4.00%
- Median HH income
- $48,987
- Composite
- 38.97/100
- National rank
- #4076
- State rank
- #48 of 73 in FL
Livability — Jacksonville
- Score
- 83/100
- State rank
- #50
- US rank
- #911
Category grades
Schools grade is shown separately in the Schools card above.
Census & demographics
- Census place
- Jacksonville, FL
- County
- Duval County · 1,015,274 people
- City population
- 979,034
- Metro
- Jacksonville, FL
- Population (ZIP)
- 29,148
- Household income
- $64,789
- Rent vs Own
- Severe rent burden
- 1398.0
Population outlook (Duval County) Hauer SSP2
- Today (2025)
- 1,013,010 people
- By 2030
- 1,059,228 · +4.6%
- By 2040
- 1,141,439 · +12.7%
- By 2050
- 1,205,258 · +19.0%
- By 2075
- 1,324,282 · +30.7%
- By 2100
- 1,319,620 · +30.3%
Race, ethnicity, and origin ACS 2023
- Neighborhood character
- Diverse neighborhood (Simpson 0.59)
- Race & ethnicity
- White 59% Black 21% Hispanic / Latino 11% Two or more races 7% Asian 3%
- Hispanic origin (detail)
- Mexican 3% Puerto Rican 4% Cuban 1%
- Common ancestry
- Slovak 3% Lithuanian 2% Romanian 2%
- Foreign-born
- 8% · Canada, Vietnam, Dominican Republic
- Languages at home
- 88% English-only · Spanish 8% Vietnamese 1% French/Haitian/Cajun 1%
Political lean MEDSL · Duval
- 2024 margin
- Toss-up / Even · D 48.7% · R 50.1% · Other 1.2%
- 2008→2024 swing
- +0.4pp no change · 2008: -1.9pp · 2024: -1.5pp
- All cycles
- 2024: R+1.5 2020: D+3.8 2016: R+1.5 2012: R+3.6 2008: R+1.9
Not yet ingested
- Civics
- —
Market trends
- HPI YoY
- ▼ -386.70%
- Current HPI
- 310.4566
- Rent YoY
- ▲ 1.73%
- Metro
- Jacksonville, FL
- State GDP YoY
- ▲ 3.28%
- F500 in state
- 36
Industry mix (Fortune 500 HQ in FL)
| Industry | F500 HQs | Revenue |
|---|---|---|
| Industrial Technology | 2 | $29B |
|
||
| Insurance | 2 | $17B |
|
||
| Retail | 1 | $60B |
|
||
| Technology Distribution | 1 | $58B |
|
||
| Homebuilding | 1 | $35B |
|
||
| Technology Manufacturing | 1 | $35B |
|
||
Price history
-0.2% since first listed10 events — show timeline
- 2026-05-08 Contingent — realMLS
- 2026-04-28 Listed $49,900 realMLS
- 2025-09-04 Listing Removed — Stellar MLS as Distributed by MLS Grid
- 2025-09-04 Pending — Stellar MLS as Distributed by MLS Grid
- 2025-09-03 Listed $79,000 Stellar MLS as Distributed by MLS Grid
- 2024-12-31 Listing Removed — realMLS
- 2024-11-12 Price Changed $124,990 realMLS
- 2024-11-07 Price Changed $131,990 realMLS
- 2024-11-03 Listed $134,990 realMLS
- 2004-12-14 Sold (Public Records) $50,000 Public Records
Property tax history
+16.4%/yrLatest (2025): $3,194 · +4.9% YoY. Source: county tax records.
Cash-flow waterfall
monthlySold comps — $/sqft
last 12 mo · ≤1 miLoading sold comps…