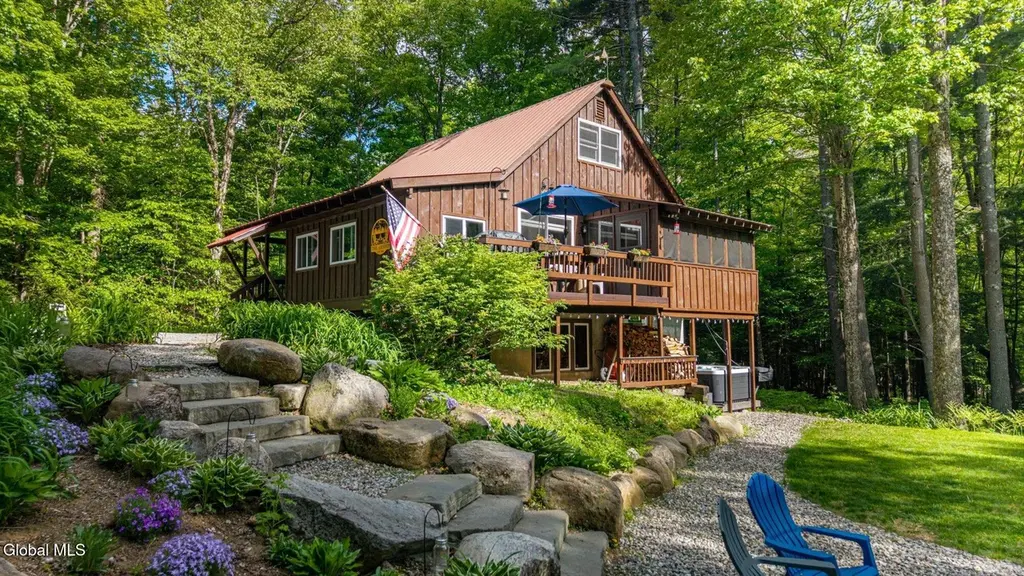
211 State Route 28n · North Creek, NY
Flood risk 1/10 · Minimal
- FEMA flood zone
- X
- Chance of flooding over 30 yrs
- 0.0%
- Est. flood insurance / yr
- $507 – $1,088
Fire risk 3/10 · Minor
- Est. fire insurance / yr
- $691 – $1,283
Heat risk 1/10 · Minimal
- Hot days now (above 90°F)
- 7 days/yr
- Hot days in 30 yrs
- 16 days/yr
Wind risk 2/10 · Minimal
- Chance of severe wind over 30 yrs
- 1.0%
Air-quality risk 1/10 · Minimal
- Unhealthy air days now
- 0 days/yr
- Unhealthy air days in 30 yrs
- 0 days/yr
Risk factors via First Street. Map © Google.
Why this score? — see what drove the B- grade
The composite is a weighted blend of 9 inputs, each scored 0–100. Each bar is that input's sub-score; the figure is the points it added to the 100-point composite (weight × sub-score).
- Cash flow +26.4/30.0
- Appreciation +10.0/10.0
- DSCR +9.0/10.0
- 1% rule +6.4/10.0
- Schools +4.2/10.0
- Livability +3.2/5.0
- Rent growth +2.5/5.0
- Condition / age +2.5/5.0
- ARV discount +1.4/15.0
$349,900
🖨 Deal sheet (PDF) 📄 Offer letter ✓ Due diligence
Listing remarks MLS
Located just 2 miles from Gore Mountain Ski Center and less than a mile from North Creek, This charming 3 bedroom, 1.5 Bath home has privacy and seclusion and is move in ready. Home is well maintained and was built in 1988. It is not uncommon to enjoy watching wildlife, often Deer and Hummingbirds, from the hot tub on the back deck or from the screened in porch. Attic rafters and soffit areas recently spray foamed and septic was gone over in April 2017. Includes all appliances and furnishings are negotiable. There is a strong rental potential with this property as well. Peaceful, Quiet and close, this is a great place to call home or your very own home away from home.
Key facts
- 1.3 acre lot
- 8 parking spots
- Built 1988
Property features AI
Exterior
- Parking: 8 total parking spaces
- Utilities: Septic tank
- Home design: Single family residence; Entry on the first level; Living area with additional finished area below grade
- Construction: Wood siding; Metal roof
- Exterior features: Screened porch; Deck; Porch; Gas grill; Shed(s)
Interior
- Kitchen: Dishwasher; Electric oven; Microwave; Refrigerator; Electric water heater
- Bedrooms: First-floor bedroom; Two second-floor bedrooms; Basement living area (not a bedroom)
- Bathrooms: Two full bathrooms (one on the first floor, one on the second floor)
- Heating & cooling: Baseboard heating; Electric heating; Propane heating; Wood stove; Window cooling units
- Interior features: Finished full basement; 9 total rooms; Sun room
- Laundry & utility: Washer; Dryer
Neighborhood map
What this means for you Summary
Snapshot
- This is a 3-bed/1.0-bath single-family listed at $350k.
Deal economics
- At list price, monthly cash flow is $916 ($11k/yr) — positive.
- The deal already cash-flows at list — no discount required.
- Meets the 1% rule at list price ($4k rent vs $350k).
- Recommended offer: $345k (1.5% below list) — sets the bar for market timing.
- Cap rate 9.4% vs local median 2.3% in North Creek — top-decile yield for the area; either an underpriced asset or a hidden risk that comps aren't pricing in. Stress-test before assuming the spread holds.
Location & tenants
- Location reads 65/100 on livability (#683 in NY) — a middle-class / working-renter tenant base. Strengths: housing A+, health & safety A+, cost of living B; Watch: schools D+, crime F, amenities F.
- Johnsburg Central School District (rural): math 50% / reading 45% proficiency, ranked #521 of 755 in NY (top 69%) — families likely to look elsewhere, expect single-tenant / working-renter base with shorter leases.
- Market conditions: 33 active listings in the ZIP; 180 units permitted in Warren County in 2024 (40 in 5+ unit buildings).
Forward outlook
- In year one you build about $37k of equity ($2k loan paydown + $35k appreciation (10.0% local appreciation)).
- Warren County population projected at -19% by 2050 — secular population decline; favor cash flow + early exit over multi-decade hold.
- At projected returns (10.0% appreciation + 3.0% rent growth), your $98k cash investment doubles in ~2 years — after that, you're playing with house money.
- By year 2, paydown + projected appreciation supports a ~$60k cash-out refi (75% LTV) — recoverable capital for the next deal without selling this one.
Negotiation context
- It's been on market 17 days — a 2% lower offer ($345k) is reasonable based on typical stale-listing flexibility.
- 5 sale attempts since 13y ago with the ask held roughly flat each time — persistent listings suggest the price (not the market) is what's stuck; bring a comps-based counter.
- Current owner paid $155k; list at $350k implies a 126% gain — meaningful room to come down on a strong offer.
Questions for the listing agent
- Is there a deadline driving the sale (1031 exchange, divorce, estate, relocation)? That informs how much negotiation room exists.
- Schools are D-rated, which usually means shorter tenancies and higher turnover. Who's the typical renter profile here, and what's been the actual vacancy rate?
- Crime grade is F in this area — have there been break-ins, vandalism, or insurance claims at this property in the last 3 years? What carrier currently insures it and at what premium?
- What's the average days-on-market for RENTAL listings here right now (not sales)? A rising rental-DOM trend means longer vacancies and softer asking-rent achievability than the comps imply.
- What's the recent tenant-quality profile in this submarket — average credit score on applications, eviction rate, late-payment / NSF rate, and stable-employment percentage? A property-management company in the area should have these aggregated.
- How much new for-sale + rental construction is in the pipeline within 1–3 miles? Heavy new supply typically softens prices + rents 12–24 months out; constrained supply supports both.
Investment metrics
- 1% rule
- 1.14% ✓
- Cap rate
- 9.43%
- Cash-on-cash
- 11.21%
- DSCR
- 1.50
- GRM
- 7.3
CMA / ARV
- ARV (on-the-fly)
- $308,000
- Comps found
- 4
Show comp detail 4 sales within ~0.75 mi
| Address | Dist | Beds/Ba | Sqft | Sold | Price | $/sf | Match |
|---|---|---|---|---|---|---|---|
| 1540 River Rd | 0.66mi | 3/2.0 | 1,300 (-7%) | 5mo | $410,000 | $315 | 49 |
| 287 Bird Pond Rd | 0.62mi | 3/2.0 | 1,248 (-11%) | 3mo | $275,000 | $220 | 47 |
| 228 Bird Pond Rd | 0.70mi | 2/2.0 (-1) | 1,508 (+8%) | 6mo | $245,000 | $162 | 40 |
| 32 Circle Ave | 0.73mi | 3/1.5 | 1,248 (-11%) | 17mo | $155,000 | $124 | 32 |
Match score weights: distance 35% · size 25% · config 20% · recency 20%. Top-matched comps best support the ARV.
Projected returns pro-forma
10.0% appreciation · 3.0% rent growth · sell at horizon
- IRR
- 32.5%
- Equity multiple
- 3.54×
- Total profit
- $248,821
- Equity at exit
- $315,218
- IRR
- 28.0%
- Equity multiple
- 8.01×
- Total profit
- $686,763
- Equity at exit
- $679,779
Cash invested: $97,972 (down + closing). Projections, not guarantees.
Landlord ↔ Tenant lean methodology
- Overall (STATE)
- 15 Strongly Tenant-Friendly
- State New York
- 15 Strongly Tenant-Friendly · D+10
- County
- — inherits STATE
- City
- — inherits STATE
ZIP-level market 12853
- Home prices YoY
- 3.4%
- Active inventory
- 33
- Price-to-rent
- 7.3×
Monthly cashflow live
- Estimated rent
- $3,976 medium interval (Pro) →
- Mortgage (P&I)
- −$1,835
- Tax from tax record
- −$244 /mo · $2,933/yr
- Insurance
- −$146
- HOA
- −$0
- Vacancy / Maint / Mgmt
- −$835
- Net cashflow
- $916
Break-even live
Sensitivity live
| Price | -10% $1,114 | -5% $1,015 | +0% $916 | +5% $817 | +10% $718 |
|---|---|---|---|---|---|
| Rent | -10% $602 | -5% $759 | +0% $916 | +5% $1,073 | +10% $1,230 |
| Rate | -1.0pp $1,092 | -0.5pp $1,005 | base $916 | +0.5pp $825 | +1.0pp $733 |
UW: 25.0% down · 7.5% · 30yr · 1.5% tax · 5.0% vac · 8.0% maint · 8.0% mgmt
Financing live
Cash to close
- Down payment
- $87,475
- Closing costs
- $10,497
- Reserves months
- —
- Total cash needed
- —
Loan-product check · same deal, 3 products live
Conventional
25% down · 7.5% · 30yr
- Down + closing
- —
- Monthly P&I
- —
- Monthly cashflow
- —
- DSCR
- —
- Eligible?
- —
Personal DTI + credit; lowest rate.
DSCR
20% down · 8.5% · 30yr
- Down + closing
- —
- Monthly P&I
- —
- Monthly cashflow
- —
- DSCR
- —
- Eligible?
- —
No personal income docs; deal must DSCR.
Hard money
10% down · 12.0% · 12mo
- Down + closing
- —
- Monthly P&I
- —
- Monthly cashflow
- —
- DSCR
- —
- Eligible?
- —
Short-term bridge; refi at stabilization.
Listing history 13 events
-
2026-06-21days on market $349,900 Active 17 DOM
-
2026-06-21days on market $349,900 Active 16 DOM
-
2026-06-18days on market $349,900 Active 14 DOM
-
2026-06-17days on market $349,900 Active 13 DOM
-
2026-06-16days on market $349,900 Active 12 DOM
-
2026-06-15days on market $349,900 Active 11 DOM
-
2026-06-13days on market $349,900 Active 9 DOM
-
2026-06-12days on market $349,900 Active 8 DOM
-
2026-06-09days on market $349,900 Active 5 DOM
-
2026-06-08days on market $349,900 Active 4 DOM
-
2026-06-07days on market $349,900 Active 3 DOM
-
2026-06-05remarks 699-char remark
-
2026-06-05$349,900 Active 1 DOM
ⓘ Source: listings_history table (triggers on properties + properties_extension) + one-shot
backfill from property_details.listing_events for pre-trigger history.
Tax reassessment forecast NY · Partial reset (capped growth)
- Current annual tax
- $2,933 · $244/mo
- Projected year-2 tax
- $4,423 · $369/mo
- Expected delta
- +$1,490/yr (+$124/mo · 50.8%)
ⓘ Screening estimate from a state-policy table — verify with the county assessor before closing.
Climate risk First Street
- Flood 1/10 Low FEMA zone X · 0% chance over 30 yrs
- Wildfire 3/10 Moderate
- Heat 1/10 Low 7 d/yr ≥90°F today · 16 d/yr by 30 yrs out
- Wind 2/10 Low 100% chance of damaging wind over 30 yrs
- Air quality 1/10 Low 0 unhealthy d/yr today · 0 by 30 yrs out
Nearby sold comps map
Loading sold comps map…
Walkable amenities ~0.75 mi
Loading nearby amenities…
Taxation est. · year 1
- Rental income
- $47,707
- − Mortgage interest
- −$19,600
- − Property taxes
- −$2,933
- − Insurance
- −$1,750
- − Repairs & maintenance
- −$3,817
- − Management
- −$3,817
- − Depreciation
- −$10,179
- Taxable income
- $5,613
- Est. tax owed @ 24.0%
- −$1,347
- After-tax cash flow
- $9,640/yr
For passive investors: Depreciation is non-cash, so a rental often shows a tax loss while cash-flowing — sheltering income. Rental losses are passive: they offset passive income freely, and up to $25,000/yr can offset ordinary (W-2) income if you actively participate and your MAGI is under $100k (phasing out to $0 by $150k); unused losses carry forward. On sale, claimed depreciation is recaptured at up to 25%, and gains may owe capital-gains tax (a 1031 exchange can defer both). Figures are a year-1 estimate at your 24.0% rate — not tax advice; consult a CPA.
Schools (NCES district)
- District
- Johnsburg Central School District
- NCES district ID
- 3615870
- Math proficiency
- 50% ▬ 0.00%
- Reading proficiency
- 45% ▼ -5.00%
- Median HH income
- $45,308
- Composite
- 42.4/100
- National rank
- #6915
- State rank
- #521 of 755 in NY
Livability — North Creek
- Score
- 65/100
- State rank
- #683
- US rank
- #12939
Category grades
Schools grade is shown separately in the Schools card above.
Census & demographics
- Population (ZIP)
- 1,384
Population outlook (Warren County) Hauer SSP2
- Today (2025)
- 62,372 people
- By 2030
- 60,491 · -3.0%
- By 2040
- 55,616 · -10.8%
- By 2050
- 50,437 · -19.1%
- By 2075
- 40,843 · -34.5%
- By 2100
- 31,159 · -50.0%
Race, ethnicity, and origin ACS 2023
- Neighborhood character
- Predominantly White (92%)
- Race & ethnicity
- White 92% Asian 3% Two or more races 2% Hispanic / Latino 2%
- Common ancestry
- Lithuanian 11% Slovak 5% Iranian 4%
- Foreign-born
- 1%
- Languages at home
- 99% English-only · Korean 1%
Political lean MEDSL · Warren
- 2024 margin
- Toss-up / Even · D 47.9% · R 52.1%
- 2008→2024 swing
- -6.9pp toward R · 2008: 2.6pp · 2024: -4.2pp
- All cycles
- 2024: R+4.2 2020: R+0.2 2016: R+10.6 2012: D+2.1 2008: D+2.6
Not yet ingested
- Civics
- —
Market trends
- HPI YoY
- ▲ 10.16%
- Current HPI
- 310.7228
- Rent YoY
- —
- Metro
- —
- State GDP YoY
- ▲ 2.60%
- F500 in state
- 92
Industry mix (Fortune 500 HQ in NY)
| Industry | F500 HQs | Revenue |
|---|---|---|
| Financial Services | 10 | $950B |
|
||
| Consumer Goods | 9 | $162B |
|
||
| Insurance | 4 | $225B |
|
||
| Telecommunications | 2 | $144B |
|
||
| Pharmaceuticals | 2 | $112B |
|
||
| Media / Entertainment | 2 | $69B |
|
||
Price history
+90.3% since first listed10 events — show timeline
- 2026-06-04 Listed $349,900 Global MLS
- 2018-09-25 Sold (Public Records) $155,000 Public Records
- 2018-09-19 Sold (MLS) $155,000 Global MLS
- 2018-05-08 Listed $166,900 Global MLS
- 2018-04-14 Listing Removed — Global MLS
- 2017-04-14 Listed $169,000 Global MLS
- 2015-10-03 Listing Removed — Global MLS
- 2014-10-03 Listed $178,900 Global MLS
- 2014-09-10 Listing Removed — Global MLS
- 2013-09-10 Listed $183,900 Global MLS
Property tax history
+3.1%/yrLatest (2025): $2,933 · +1.2% YoY. Source: county tax records.
Cash-flow waterfall
monthlySold comps — $/sqft
last 12 mo · ≤1 miLoading sold comps…