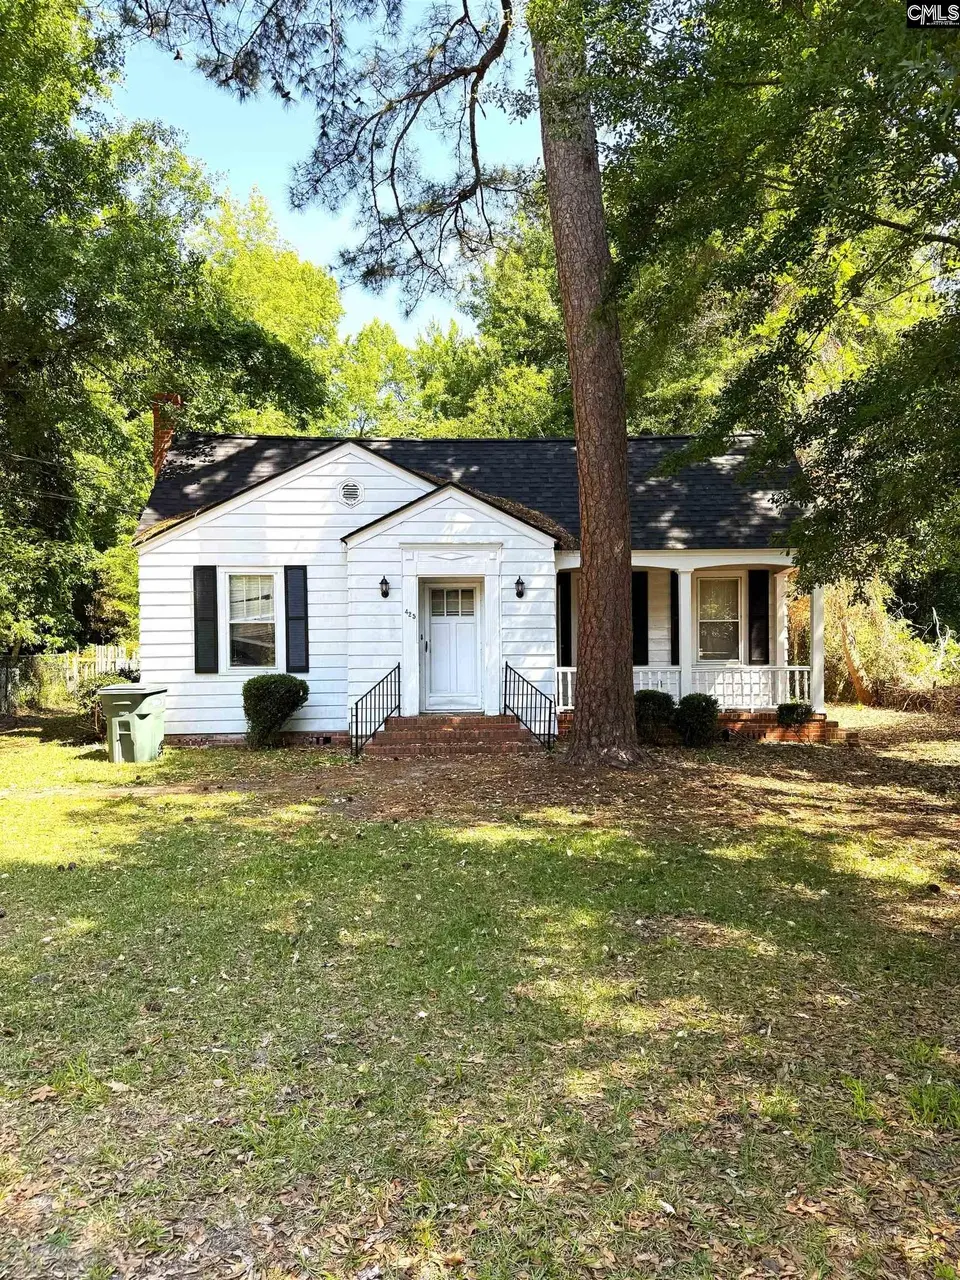
425 E Charlotte Ave · Sumter, SC
Flood risk 1/10 · Minimal
- FEMA flood zone
- X (unshaded)
- Chance of flooding over 30 yrs
- 0.0%
- Est. flood insurance / yr
- $507 – $1,088
Fire risk 5/10 · Moderate
- Est. fire insurance / yr
- $783 – $1,453
Heat risk 6/10 · Moderate
- Hot days now (above 108°F)
- 7 days/yr
- Hot days in 30 yrs
- 16 days/yr
Wind risk 8/10 · Major
- Chance of severe wind over 30 yrs
- 80.0%
Air-quality risk 2/10 · Minimal
- Unhealthy air days now
- 2 days/yr
- Unhealthy air days in 30 yrs
- 2 days/yr
Risk factors via First Street. Map © Google.
Why this score? — see what drove the B+ grade
The composite is a weighted blend of 9 inputs, each scored 0–100. Each bar is that input's sub-score; the figure is the points it added to the 100-point composite (weight × sub-score).
- Cash flow +30.0/30.0
- ARV discount +15.0/15.0
- 1% rule +10.0/10.0
- DSCR +10.0/10.0
- Rent growth +3.1/5.0
- Livability +3.0/5.0
- Condition / age +2.5/5.0
- Schools +1.9/10.0
- Appreciation +0.0/10.0
$85,000
🖨 Deal sheet 📄 Offer letter ✓ Due diligence
Listing remarks
Charming traditional cottage featuring classic white siding, black shutters, a welcoming covered front porch, brick accents, and a picturesque setting beneath mature shade trees. With classic character, and plenty of potential, this property is ideal for investors, flippers, or first-time homebuyers looking to personalize a home and build equity. Bring your vision and transform this charming cottage into your dream home. Large living room with hardwood flooring, smooth ceiling with ceiling fan, wood trim, and brick fireplace. Formal dining room with hardwood floors, smooth ceilings and overhead lighting. Eat in kitchen features wood cabinetry, washer and dryer connections, and access to the
Key facts
- Covered front porch
- Hardwood flooring
- Brick fireplace
Tags
Property features AI
Exterior
- Parking: Detached garage (1 garage space); Total of 10 parking spaces
- Utilities: Public sewer; Public water
- Home design: Single-story home
- Construction: Crawlspace and slab foundation
- Exterior features: Covered front porch; Partial brick, vinyl and other exterior finishes; Chain link fencing; Paved road access; Public water
Interior
- Kitchen: Eat-in kitchen with painted cabinets
- Bedrooms: Master bedroom on the main level with hardwood floors; Second bedroom on the main level with hardwood floors; Third bedroom on the main level with hardwood floors
- Flooring: Hardwood flooring throughout main living areas and bedrooms
- Bathrooms: One full bathroom on the main level
- Heating & cooling: Central heating; Central cooling
- Interior features: One fireplace; Formal living room with hardwood floors; Formal dining room with fireplace, hardwood floors, molding, and ceiling fan
- Laundry & utility: Laundry located in the kitchen on the main level
Neighborhood map
What this means for you Summary
Snapshot
- This is a 3-bed/1.0-bath single-family listed at $85k.
Deal economics
- At list price, monthly cash flow is $577 ($7k/yr) — positive.
- The deal already cash-flows at list — no discount required.
- Meets the 1% rule at list price ($1k rent vs $85k).
- Recommended offer: $84k (1.5% below list) — sets the bar for market timing.
- Cap rate 14.4% vs local median 3.4% in Sumter — top-decile yield for the area; either an underpriced asset or a hidden risk that comps aren't pricing in. Stress-test before assuming the spread holds.
Location & tenants
- Location reads 59/100 on livability (#235 in SC) — a working-class tenant base; expect higher turnover. Strengths: cost of living A+, health & safety A+, housing A-; Watch: crime F, amenities F, commute F.
- Sumter 01 (urban): math 18% / reading 28% proficiency, ranked #64 of 80 in SC (top 80%) — low school quality limits family demand, transient renter base, plan for 1-2y turnover; 64% free/reduced lunch — lower-income household profile, screen leases tightly.
- Zoned schools: Crosswell Drive Elementary (math 8% / reading 12%, grade F, #587 of 597 statewide, top 99%, 460 students, 100% FRL); Crestwood High (math 32% / reading 71%, grade D+, #146 of 196 statewide, top 75%, 1,100 students, 100% FRL) — zoned schools average 100% FRL vs 64% district-wide (36 pts higher); higher-poverty schools than district average — tighter screening recommended.
- Market conditions: Rents rising (+2.5%/yr); 376 active listings in the ZIP; 386 units permitted in Sumter County in 2024 (0 in 5+ unit buildings).
- This rent runs 35% of the median local income ($51k/yr) — at the standard rent-burdened threshold; future hikes will face affordability resistance.
Forward outlook
- Local home prices are declining (-3.0%/yr); year-one equity from $588 of loan paydown is wiped out by about $3k of value loss. Plan a longer hold.
- Sumter County population projected at -14% by 2050 — secular population decline; favor cash flow + early exit over multi-decade hold.
- At projected returns (-3.0% appreciation + 2.5% rent growth), your $24k cash investment doubles in ~5 years — after that, you're playing with house money.
Negotiation context
- It's been on market 22 days — a 2% lower offer ($84k) is reasonable based on typical stale-listing flexibility.
- 2 sale attempts since 3y ago with the ask held roughly flat each time — persistent listings suggest the price (not the market) is what's stuck; bring a comps-based counter.
Risks & watch-outs
- Watch-outs: built in 1949 — expect roof / HVAC / electrical / plumbing capex.
- Climate carrying-cost: severe wind risk, 80% chance of damaging wind over 30y; moderate wildfire risk; extreme-heat days projected 7→16/yr by 2055 (HVAC capex compounding) — expect insurance premiums to compound above CPI over the hold.
Questions for the listing agent
- Built in 1949 — when were the roof, HVAC, electrical panel, plumbing, and water heater last replaced?
- Is there a deadline driving the sale (1031 exchange, divorce, estate, relocation)? That informs how much negotiation room exists.
- Schools are D-rated, which usually means shorter tenancies and higher turnover. Who's the typical renter profile here, and what's been the actual vacancy rate?
- Crime grade is F in this area — have there been break-ins, vandalism, or insurance claims at this property in the last 3 years? What carrier currently insures it and at what premium?
- What's the average days-on-market for RENTAL listings here right now (not sales)? A rising rental-DOM trend means longer vacancies and softer asking-rent achievability than the comps imply.
- What's the recent tenant-quality profile in this submarket — average credit score on applications, eviction rate, late-payment / NSF rate, and stable-employment percentage? A property-management company in the area should have these aggregated.
- How much new for-sale + rental construction is in the pipeline within 1–3 miles? Heavy new supply typically softens prices + rents 12–24 months out; constrained supply supports both.
Investment metrics
- 1% rule
- 1.73% ✓
- Cap rate
- 14.44%
- Cash-on-cash
- 29.09%
- DSCR
- 2.29
- GRM
- 4.8
CMA / ARV
- ARV (on-the-fly)
- $143,570
- Comps found
- 12
Show comp detail 12 sales within ~0.75 mi
| Address | Dist | Beds/Ba | Sqft | Sold | Price | $/sf | Match |
|---|---|---|---|---|---|---|---|
| 701 Wen Le Dr | 0.38mi | 3/1.5 | 1,465 (0%) | 5mo | $125,000 | $85 | 76 |
| 110 Phifer St | 0.38mi | 3/1.5 | 1,427 (-3%) | 1mo | $140,000 | $98 | 75 |
| 206 Crosswell Dr | 0.33mi | 3/2.0 | 1,579 (+8%) | 3mo | $110,000 | $70 | 65 |
| 313 Pinckney St | 0.57mi | 3/1.5 | 1,450 (-1%) | 7mo | $120,000 | $83 | 64 |
| 13 Victory Dr | 0.61mi | 3/1.0 | 1,541 (+5%) | 2mo | $185,000 | $120 | 62 |
| 16 Wilson St | 0.34mi | 3/1.0 | 1,310 (-11%) | 6mo | $49,000 | $37 | 62 |
| 70 Lemmon St | 0.47mi | 3/2.0 | 1,615 (+10%) | 2mo | $139,900 | $87 | 56 |
| 25 Poinsett Dr | 0.52mi | 3/2.0 | 1,625 (+11%) | 5mo | $152,250 | $94 | 49 |
| 8 Warren Ct | 0.71mi | 3/2.0 | 1,564 (+7%) | 5mo | $235,000 | $150 | 48 |
| 10 Warren Ct | 0.71mi | 3/2.0 | 1,600 (+9%) | 6mo | $229,900 | $144 | 42 |
| 313 Rutledge St | 0.62mi | 3/2.0 | 1,679 (+15%) | 4mo | $210,000 | $125 | 40 |
| 212 Brown St | 0.73mi | 3/2.0 | 1,292 (-12%) | 8mo | $190,000 | $147 | 36 |
Match score weights: distance 35% · size 25% · config 20% · recency 20%. Top-matched comps best support the ARV.
Projected returns pro-forma
-3.0% appreciation · 2.55% rent growth · sell at horizon
- IRR
- 23.0%
- Equity multiple
- 1.94×
- Total profit
- $22,327
- Equity at exit
- $12,674
- IRR
- 30.7%
- Equity multiple
- 3.70×
- Total profit
- $64,142
- Equity at exit
- $7,349
Cash invested: $23,800 (down + closing). Projections, not guarantees.
Landlord ↔ Tenant lean methodology
- Overall (STATE)
- 90 Strongly Landlord-Friendly
- State South Carolina
- 90 Strongly Landlord-Friendly · R+6
- County
- — inherits STATE
- City
- — inherits STATE
ZIP-level market 29150
- Rents YoY
- 2.5%
- Active inventory
- 376
- Price-to-rent
- 4.8×
Monthly cashflow live
- Estimated rent
- $1,467 medium interval (Pro) →
- Mortgage (P&I)
- −$446
- Tax from tax record
- −$101 /mo · $1,207/yr
- Insurance
- −$35
- HOA
- −$0
- Vacancy / Maint / Mgmt
- −$308
- Net cashflow
- $577
Break-even live
UW: 25.0% down · 7.5% · 30yr · 1.5% tax · 5.0% vac · 8.0% maint · 8.0% mgmt
Financing live
Cash to close
- Down payment
- $21,250
- Closing costs
- $2,550
- Reserves months
- —
- Total cash needed
- —
Loan-product check · same deal, 3 products live
Conventional
25% down · 7.5% · 30yr
- Down + closing
- —
- Monthly P&I
- —
- Monthly cashflow
- —
- DSCR
- —
- Eligible?
- —
Personal DTI + credit; lowest rate.
DSCR
20% down · 8.5% · 30yr
- Down + closing
- —
- Monthly P&I
- —
- Monthly cashflow
- —
- DSCR
- —
- Eligible?
- —
No personal income docs; deal must DSCR.
Hard money
10% down · 12.0% · 12mo
- Down + closing
- —
- Monthly P&I
- —
- Monthly cashflow
- —
- DSCR
- —
- Eligible?
- —
Short-term bridge; refi at stabilization.
Listing history 18 events
-
2026-06-19days on market $85,000 Active 22 DOM
-
2026-06-18days on market $85,000 Active 21 DOM
-
2026-06-17days on market $85,000 Active 20 DOM
-
2026-06-16days on market $85,000 Active 19 DOM
-
2026-06-15days on market $85,000 Active 18 DOM
-
2026-06-14days on market $85,000 Active 16 DOM
-
2026-06-13pricedays on market $85,000 Active 15 DOM
-
2026-06-10days on market $87,500 Active 13 DOM
-
2026-06-09days on market $87,500 Active 12 DOM
-
2026-06-08days on market $87,500 Active 11 DOM
-
2026-06-07days on market $87,500 Active 10 DOM
-
2026-06-02days on market $87,500 Active 5 DOM
-
2026-06-01days on market $87,500 Active 4 DOM
-
2026-05-31days on market $87,500 Active 3 DOM
-
2026-05-30days on market $87,500 Active 2 DOM
-
2026-05-28$87,500 Active
-
2023-10-28historical $775
-
2023-10-27$775
ⓘ Source: listings_history table (triggers on properties + properties_extension) + one-shot
backfill from property_details.listing_events for pre-trigger history.
Tax reassessment forecast SC · Resets to sale price
- Current annual tax
- $1,207 · $101/mo
- Projected year-2 tax
- $1,207 · $101/mo
- Expected delta
- $0/yr ($0/mo · 0.0%)
ⓘ Screening estimate from a state-policy table — verify with the county assessor before closing.
Climate risk First Street
- Flood 1/10 Low FEMA zone X (unshaded) · 0% chance over 30 yrs
- Wildfire 5/10 Major
- Heat 6/10 Major 7 d/yr ≥108°F today · 16 d/yr by 30 yrs out
- Wind 8/10 Severe 80% chance of damaging wind over 30 yrs
- Air quality 2/10 Low 2 unhealthy d/yr today · 2 by 30 yrs out
Nearby sold comps map
Loading sold comps map…
Walkable amenities ~0.75 mi
Loading nearby amenities…
Taxation est. · year 1
- Rental income
- $17,600
- − Mortgage interest
- −$4,761
- − Property taxes
- −$1,207
- − Insurance
- −$425
- − Repairs & maintenance
- −$1,408
- − Management
- −$1,408
- − Depreciation
- −$2,473
- Taxable income
- $5,918
- Est. tax owed @ 24.0%
- −$1,420
- After-tax cash flow
- $5,503/yr
For passive investors: Depreciation is non-cash, so a rental often shows a tax loss while cash-flowing — sheltering income. Rental losses are passive: they offset passive income freely, and up to $25,000/yr can offset ordinary (W-2) income if you actively participate and your MAGI is under $100k (phasing out to $0 by $150k); unused losses carry forward. On sale, claimed depreciation is recaptured at up to 25%, and gains may owe capital-gains tax (a 1031 exchange can defer both). Figures are a year-1 estimate at your 24.0% rate — not tax advice; consult a CPA.
Schools (NCES district)
- District
- Sumter 01
- NCES district ID
- 4503902
- Math proficiency
- 18% ▼ -13.00%
- Reading proficiency
- 28% ▼ -6.00%
- Median HH income
- $40,423
- Composite
- 19.45/100
- National rank
- #8775
- State rank
- #64 of 80 in SC
Livability — Sumter
- Score
- 59/100
- State rank
- #235
- US rank
- #19754
Category grades
Schools grade is shown separately in the Schools card above.
Census & demographics
- Census place
- Sumter, SC
- County
- Sumter County · 76,912 people
- City population
- 67,992
- Metro
- Sumter, SC
- Population (ZIP)
- 38,538
- Household income
- $50,965
- Rent vs Own
- Severe rent burden
- 1136.0
Population outlook (Sumter County) Hauer SSP2
- Today (2025)
- 104,585 people
- By 2030
- 102,282 · -2.2%
- By 2040
- 96,258 · -8.0%
- By 2050
- 89,592 · -14.3%
- By 2075
- 74,715 · -28.6%
- By 2100
- 60,235 · -42.4%
Race, ethnicity, and origin ACS 2023
- Neighborhood character
- Diverse neighborhood (Simpson 0.60)
- Race & ethnicity
- Black 50% White 39% Hispanic / Latino 5% Two or more races 4% Asian 2%
- Hispanic origin (detail)
- Mexican 3% Puerto Rican 1%
- Common ancestry
- Slovak 2% Lithuanian 1% Italian 1%
- Foreign-born
- 4% · Canada, China, Vietnam
- Languages at home
- 93% English-only · Spanish 4% Other Indo-European 1% German/W. Germanic 1%
Political lean MEDSL · Sumter
- 2024 margin
- Toss-up / Even · D 51.9% · R 47.0% · Other 1.2%
- 2008→2024 swing
- -10.6pp toward R · 2008: 15.4pp · 2024: 4.9pp
- All cycles
- 2024: D+4.9 2020: D+13.0 2016: D+12.0 2012: D+17.5 2008: D+15.4
Not yet ingested
- Civics
- —
Market trends
- HPI YoY
- ▼ -100.16%
- Current HPI
- 129.032
- Rent YoY
- ▲ 2.55%
- Metro
- Sumter, SC
- State GDP YoY
- ▲ 4.51%
- F500 in state
- 2
Industry mix (Fortune 500 HQ in SC)
| Industry | F500 HQs | Revenue |
|---|---|---|
| Packaging | 1 | $7B |
|
||
Price history
3 events — show timeline
- 2026-05-28 Listed $87,500 Consolidated MLS
- 2023-10-28 Rental Removed $775 SBOR
- 2023-10-27 Listed for Rent $775 SBOR
Property tax history
+0.7%/yrLatest (2025): $1,207 · +1.8% YoY. Source: county tax records.
Cash-flow waterfall
monthlySold comps — $/sqft
last 12 mo · ≤1 miLoading sold comps…