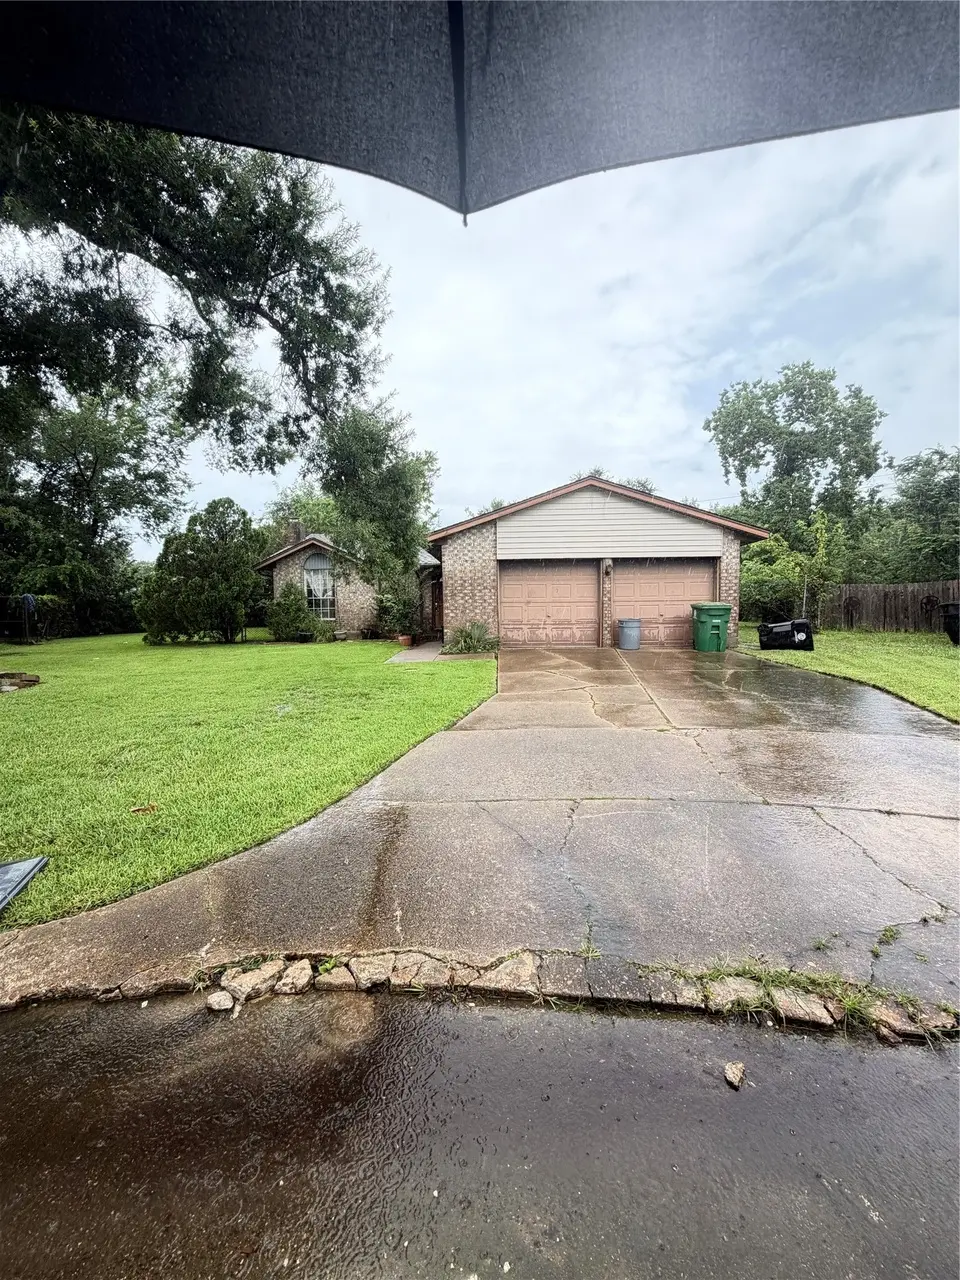
506 Kenwood Ln · Houston, TX
Flood risk 1/10 · Minimal
- FEMA flood zone
- X (unshaded)
- Chance of flooding over 30 yrs
- 0.0%
- Est. flood insurance / yr
- $507 – $1,088
Fire risk 4/10 · Minor
- Est. fire insurance / yr
- $1,222 – $2,270
Heat risk 9/10 · Severe
- Hot days now (above 110°F)
- 7 days/yr
- Hot days in 30 yrs
- 24 days/yr
Wind risk 9/10 · Severe
- Chance of severe wind over 30 yrs
- 99.0%
Air-quality risk 2/10 · Minimal
- Unhealthy air days now
- 2 days/yr
- Unhealthy air days in 30 yrs
- 2 days/yr
Risk factors via First Street. Map © Google.
Why this score? — see what drove the C grade
The composite is a weighted blend of 9 inputs, each scored 0–100. Each bar is that input's sub-score; the figure is the points it added to the 100-point composite (weight × sub-score).
- Cash flow +17.1/30.0
- Appreciation +7.6/10.0
- ARV discount +7.5/15.0
- 1% rule +7.3/10.0
- DSCR +5.3/10.0
- Rent growth +3.8/5.0
- Livability +3.7/5.0
- Schools +2.7/10.0
- Condition / age +2.5/5.0
$100,000
🖨 Deal sheet 📄 Offer letter ✓ Due diligence
Key facts
- 0.25 acre lot
- 2 garage spots
- Built 1976
Property features AI
Finance
- Financial info: Lease not considered
Exterior
- Parking: Attached garage with 2 spaces
- Utilities: Public water
- Home design: Residential property; Built in 1976; Single-story (entry level: first floor)
- Construction: Brick and cement siding construction; Composition roof; Slab foundation
- Exterior features: Located on a cul-de-sac in a subdivision
Interior
- Bedrooms: Three bedrooms — two 10x10 bedrooms and a primary bedroom 12x12 (all on the first floor)
- Bathrooms: Two full bathrooms
- Heating & cooling: Central heating (gas); Central electric air conditioning
- Interior features: Fireplace (1)
Neighborhood map
What this means for you Summary
Snapshot
- This is a 3-bed/2.0-bath single-family listed at $100k.
Deal economics
- At list price, monthly cash flow is $69 ($828/yr) — positive.
- The deal already cash-flows at list — no discount required.
- Meets the 1% rule at list price ($1k rent vs $100k).
- Cap rate 7.1% vs local median 3.2% in Houston — top-decile yield for the area; either an underpriced asset or a hidden risk that comps aren't pricing in. Stress-test before assuming the spread holds.
Location & tenants
- Location reads 74/100 on livability (#184 in TX, #4,771 nationally) — a middle-class / working-renter tenant base. Strengths: amenities A+, cost of living A+, housing A+; Watch: crime F.
- Houston ISD (urban): math 27% / reading 35% proficiency, ranked #593 of 826 in TX (top 72%) — families likely to look elsewhere, expect single-tenant / working-renter base with shorter leases; 71% free/reduced lunch — lower-income household profile, screen leases tightly.
- Zoned schools: Holland Middle (math 10% / reading 16%, grade F, #1,609 of 1,662 statewide, top 97%, 644 students, 98% FRL) — zoned schools average 98% FRL vs 71% district-wide (27 pts higher); higher-poverty schools than district average — tighter screening recommended.
- Zoned-school proficiency averages 13% at this address vs 31% district-wide (-18 pts) — the specific schools serving this property underperform the Houston ISD average; the district grade overstates school quality for this exact location.
- Market conditions: Rents rising fast (+5.0%/yr); 33 active listings in the ZIP; 18 comparable units currently listed for rent nearby; rentals at typical pace (median 22d on market — plan ~3-4 weeks tenant-placement turnaround); 29,883 units permitted in Harris County in 2024 (8,621 in 5+ unit buildings).
- This rent runs 31% of the median local income ($47k/yr) — at the standard rent-burdened threshold; future hikes will face affordability resistance.
Forward outlook
- In year one you build about $6k of equity ($691 loan paydown + $5k appreciation (5.3% local appreciation)).
- Harris County population projected at +47% by 2050 — long-run rental-demand tailwind backs the buy-and-hold thesis.
- At projected returns (5.3% appreciation + 5.0% rent growth), your $28k cash investment doubles in ~4 years — after that, you're playing with house money.
- By year 6, paydown + projected appreciation supports a ~$32k cash-out refi (75% LTV) — recoverable capital for the next deal without selling this one.
Negotiation context
- Only 1 days on market — expect competitive offers; lowballing is unlikely to land.
Risks & watch-outs
- Watch-outs: property tax is 4.1% of price.
- Climate carrying-cost: severe wind risk, 99% chance of damaging wind over 30y; extreme-heat days projected 7→24/yr by 2055 (HVAC capex compounding) — expect insurance premiums to compound above CPI over the hold.
Questions for the listing agent
- Built in 1976 — when were the roof, HVAC, electrical panel, plumbing, and water heater last replaced?
- Property tax is high relative to price — has the assessment been appealed recently, and will the sale trigger a re-assessment?
- Is there a deadline driving the sale (1031 exchange, divorce, estate, relocation)? That informs how much negotiation room exists.
- Schools are D-rated, which usually means shorter tenancies and higher turnover. Who's the typical renter profile here, and what's been the actual vacancy rate?
- Crime grade is F in this area — have there been break-ins, vandalism, or insurance claims at this property in the last 3 years? What carrier currently insures it and at what premium?
- What's the average days-on-market for RENTAL listings here right now (not sales)? A rising rental-DOM trend means longer vacancies and softer asking-rent achievability than the comps imply.
- What's the recent tenant-quality profile in this submarket — average credit score on applications, eviction rate, late-payment / NSF rate, and stable-employment percentage? A property-management company in the area should have these aggregated.
- How much new for-sale + rental construction is in the pipeline within 1–3 miles? Heavy new supply typically softens prices + rents 12–24 months out; constrained supply supports both.
Investment metrics
- 1% rule
- 1.23% ✓
- Cap rate
- 7.12%
- Cash-on-cash
- 2.96%
- DSCR
- 1.13
- GRM
- 6.8
CMA / ARV
- ARV (on-the-fly)
- $212,976
- Comps found
- 12
Show comp detail 12 sales within ~0.75 mi
| Address | Dist | Beds/Ba | Sqft | Sold | Price | $/sf | Match |
|---|---|---|---|---|---|---|---|
| 502 Kenwood Ln | 0.01mi | 3/2.0 | 1,302 (-6%) | 1mo | $255,000 | $196 | 87 |
| 11611 Bowhead Dr | 0.24mi | 3/2.0 | 1,408 (+1%) | 5mo | $215,000 | $153 | 83 |
| 615 Wood Smoke Dr | 0.28mi | 3/2.0 | 1,388 (-0%) | 13mo | $209,990 | $151 | 76 |
| 11651 Borderwood Dr | 0.35mi | 3/2.0 | 1,456 (+5%) | 1mo | $239,000 | $164 | 75 |
| 563 Slumberwood Dr | 0.23mi | 3/2.0 | 1,271 (-9%) | 3mo | $196,900 | $155 | 73 |
| 12210 Woodcliff Dr | 0.39mi | 3/2.0 | 1,475 (+6%) | 1mo | $167,500 | $114 | 71 |
| 607 Wood Smoke Dr | 0.25mi | 3/2.0 | 1,507 (+8%) | 13mo | $230,000 | $153 | 64 |
| 615 Wood Mist Dr | 0.27mi | 3/2.0 | 1,499 (+8%) | 15mo | $195,000 | $130 | 63 |
| 11639 Woodbuck Trl | 0.30mi | 2/2.0 (-1) | 1,231 (-12%) | 1mo | $179,900 | $146 | 61 |
| 12119 Crystalwood Dr | 0.39mi | 3/2.0 | 1,219 (-12%) | 1mo | $190,000 | $156 | 60 |
| 11611 Badgerwood Dr | 0.32mi | 3/2.0 | 1,554 (+12%) | 14mo | $209,990 | $135 | 54 |
| 11615 Wood Shadows Dr | 0.72mi | 3/2.0 | 1,582 (+14%) | 16mo | $220,000 | $139 | 30 |
Match score weights: distance 35% · size 25% · config 20% · recency 20%. Top-matched comps best support the ARV.
Projected returns pro-forma
5.28% appreciation · 5.02% rent growth · sell at horizon
- IRR
- 17.4%
- Equity multiple
- 2.13×
- Total profit
- $31,745
- Equity at exit
- $58,363
- IRR
- 18.5%
- Equity multiple
- 4.47×
- Total profit
- $97,186
- Equity at exit
- $102,156
Cash invested: $28,000 (down + closing). Projections, not guarantees.
Landlord ↔ Tenant lean methodology
- Overall (STATE)
- 87 Strongly Landlord-Friendly
- State Texas
- 87 Strongly Landlord-Friendly · R+5
- County
- — inherits STATE
- City
- — inherits STATE
ZIP-level market 77013
- Home prices YoY
- 1.7%
- Rents YoY
- 5.0%
- Active inventory
- 33
- Price-to-rent
- 6.8×
Monthly cashflow live
- Estimated rent
- $1,234 high interval (Pro) →
- Mortgage (P&I)
- −$524
- Tax from tax record
- −$340 /mo · $4,076/yr
- Insurance
- −$42
- HOA
- −$0
- Vacancy / Maint / Mgmt
- −$259
- Net cashflow
- $69
Break-even live
UW: 25.0% down · 7.5% · 30yr · 1.5% tax · 5.0% vac · 8.0% maint · 8.0% mgmt
Financing live
Cash to close
- Down payment
- $25,000
- Closing costs
- $3,000
- Reserves months
- —
- Total cash needed
- —
Loan-product check · same deal, 3 products live
Conventional
25% down · 7.5% · 30yr
- Down + closing
- —
- Monthly P&I
- —
- Monthly cashflow
- —
- DSCR
- —
- Eligible?
- —
Personal DTI + credit; lowest rate.
DSCR
20% down · 8.5% · 30yr
- Down + closing
- —
- Monthly P&I
- —
- Monthly cashflow
- —
- DSCR
- —
- Eligible?
- —
No personal income docs; deal must DSCR.
Hard money
10% down · 12.0% · 12mo
- Down + closing
- —
- Monthly P&I
- —
- Monthly cashflow
- —
- DSCR
- —
- Eligible?
- —
Short-term bridge; refi at stabilization.
Rent comps 18 comps
| Address | Beds | Baths | Sqft | Rent | $/sqft | DOM | Units | Dist |
|---|---|---|---|---|---|---|---|---|
| 664 Maxey Rd Houston, TX | 1.0–2.0 | 1.0 | 783 | $1,150 | $1.47 | 8d | 37 | 0.61mi |
| 734 Coolwood Dr Houston, TX | 2.0 | 1.5 | 1000 | $1,295 | $1.29 | 44d | 1 | 0.61mi |
| 778 Coolwood Dr Houston, TX | 2.0 | 1.0 | 1000 | $1,295 | $1.29 | 44d | 1 | 0.68mi |
| 768 Coolwood Dr Houston, TX | 2.0 | 1.0 | 1102 | $1,295 | $1.18 | 44d | 1 | 0.69mi |
| 12417 Wood Forest Dr Houston, TX | 3.0 | 2.0 | 1170 | $1,300 | $1.11 | 24d | 1 | 0.69mi |
| 12221 Fleming Dr Houston, TX | 1.0–3.0 | 1.0–1.5 | 827 | $1,089 | $1.32 | 19d | 19 | 0.70mi |
| 670 Maxey Rd Houston, TX | 1.0–3.0 | 1.0–2.0 | 936 | $1,380 | $1.47 | 8d | 15 | 0.70mi |
| 676 Maxey Rd Houston, TX | 2.0 | 1.0 | 968 | $1,060 | $1.10 | 22d | 1 | 0.72mi |
| 676 Maxey Rd Houston, TX | 2.0 | 1.0 | 968 | $1,060 | $1.10 | 19d | 1 | 0.72mi |
| 12200 Fleming Dr Houston, TX | 1.0–3.0 | 1.0–2.0 | 842 | $1,265 | $1.50 | 2d | 25 | 0.91mi |
| 12516 Orleans St Houston, TX | 2.0 | 2.0 | 995 | $1,275 | $1.28 | 24d | 1 | 1.12mi |
| 794 Normandy St Houston, TX | 1.0–2.0 | 1.0–2.0 | 742 | $1,255 | $1.69 | 2d | 27 | 1.15mi |
| 518 Westshire Dr Houston, TX | 3.0 | 2.0 | 1696 | $2,000 | $1.18 | 44d | 1 | 1.16mi |
| 799 Normandy St Houston, TX | 1.0–2.0 | 1.0–2.0 | 843 | $1,387 | $1.65 | 2d | 13 | 1.32mi |
| 561 Normandy St Houston, TX | 2.0 | 2.0 | 940 | $1,200 | $1.28 | 22d | 1 | 1.37mi |
| 561 Normandy St Houston, TX | 2.0 | 2.0 | 940 | $1,200 | $1.28 | 44d | 1 | 1.37mi |
| 555 Normandy St Houston, TX | 1.0–2.0 | 1.0–2.0 | 745 | $1,385 | $1.86 | 2d | 23 | 1.39mi |
| 695 Normandy St Houston, TX | 1.0–2.0 | 1.0–2.0 | 788 | $1,200 | $1.52 | 13d | 30 | 1.39mi |
Listing history 1 events
-
2026-06-07$100,000 Pending 1 DOM
ⓘ Source: listings_history table (triggers on properties + properties_extension) + one-shot
backfill from property_details.listing_events for pre-trigger history.
Tax reassessment forecast TX · Resets to sale price
- Current annual tax
- $4,076 · $340/mo
- Projected year-2 tax
- $4,076 · $340/mo
- Expected delta
- $0/yr ($0/mo · 0.0%)
ⓘ Screening estimate from a state-policy table — verify with the county assessor before closing.
Climate risk First Street
- Flood 1/10 Low FEMA zone X (unshaded) · 0% chance over 30 yrs
- Wildfire 4/10 Moderate
- Heat 9/10 Extreme 7 d/yr ≥110°F today · 24 d/yr by 30 yrs out
- Wind 9/10 Extreme 99% chance of damaging wind over 30 yrs
- Air quality 2/10 Low 2 unhealthy d/yr today · 2 by 30 yrs out
Nearby sold comps map
Loading sold comps map…
Walkable amenities ~0.75 mi
Loading nearby amenities…
Taxation est. · year 1
- Rental income
- $14,807
- − Mortgage interest
- −$5,602
- − Property taxes
- −$4,076
- − Insurance
- −$500
- − Repairs & maintenance
- −$1,185
- − Management
- −$1,185
- − Depreciation
- −$2,909
- Taxable loss
- −$649
- Est. tax savings @ 24.0%
- +$156
- After-tax cash flow
- $984/yr
For passive investors: Depreciation is non-cash, so a rental often shows a tax loss while cash-flowing — sheltering income. Rental losses are passive: they offset passive income freely, and up to $25,000/yr can offset ordinary (W-2) income if you actively participate and your MAGI is under $100k (phasing out to $0 by $150k); unused losses carry forward. On sale, claimed depreciation is recaptured at up to 25%, and gains may owe capital-gains tax (a 1031 exchange can defer both). Figures are a year-1 estimate at your 24.0% rate — not tax advice; consult a CPA.
Schools (NCES district)
- District
- Houston ISD
- NCES district ID
- 4823640
- Math proficiency
- 27% ▼ -18.00%
- Reading proficiency
- 35% ▼ -6.00%
- Median HH income
- $46,054
- Composite
- 26.63/100
- National rank
- #7173
- State rank
- #593 of 826 in TX
Livability — Houston
- Score
- 74/100
- State rank
- #184
- US rank
- #4771
Category grades
Schools grade is shown separately in the Schools card above.
Census & demographics
- Census place
- Houston, TX
- County
- Harris County · 4,702,590 people
- City population
- 3,226,434
- Metro
- Houston-The Woodlands-Sugar Land, TX
- Population (ZIP)
- 18,259
- Household income
- $47,060
- Rent vs Own
- Severe rent burden
- 930.0
Population outlook (Harris County) Hauer SSP2
- Today (2025)
- 5,571,493 people
- By 2030
- 6,089,821 · +9.3%
- By 2040
- 7,142,806 · +28.2%
- By 2050
- 8,185,864 · +46.9%
- By 2075
- 10,574,329 · +89.8%
- By 2100
- 12,109,958 · +117.4%
Race, ethnicity, and origin ACS 2023
- Neighborhood character
- Predominantly Hispanic (73%)
- Race & ethnicity
- Hispanic / Latino 73% Two or more races 51% Black 19% White 7%
- Hispanic origin (detail)
- Mexican 50% Cuban 3%
- Foreign-born
- 34% · Canada
- Languages at home
- 35% English-only · Spanish 64% Other Indo-European 1%
Political lean MEDSL · Harris
- 2024 margin
- Lean D (+5.5) · D 52.0% · R 46.4% · Other 1.6%
- 2008→2024 swing
- +3.9pp toward D · 2008: 1.6pp · 2024: 5.5pp
- All cycles
- 2024: D+5.5 2020: D+13.3 2016: D+12.4 2012: D+0.1 2008: D+1.6
Not yet ingested
- Civics
- —
Market trends
- HPI YoY
- ▲ 5.28%
- Current HPI
- 312.1444
- Rent YoY
- ▲ 5.02%
- Metro
- Houston-The Woodlands-Sugar Land, TX
- State GDP YoY
- ▲ 3.95%
- F500 in state
- 110
Industry mix (Fortune 500 HQ in TX)
| Industry | F500 HQs | Revenue |
|---|---|---|
| Energy | 16 | $1,198B |
|
||
| Technology | 5 | $198B |
|
||
| Engineering / Construction | 4 | $72B |
|
||
| Energy Services | 3 | $60B |
|
||
| Utilities | 3 | $41B |
|
||
| Healthcare | 2 | $330B |
|
||
Price history
3 events — show timeline
- 2026-06-06 Pending — HARMLS
- 2026-06-05 Listed $100,000 HARMLS
- 1988-01-02 Sold (Public Records) — Public Records
Property tax history
+6.5%/yrLatest (2025): $4,076 · +5.0% YoY. Source: county tax records.
Cash-flow waterfall
monthlySold comps — $/sqft
last 12 mo · ≤1 miLoading sold comps…