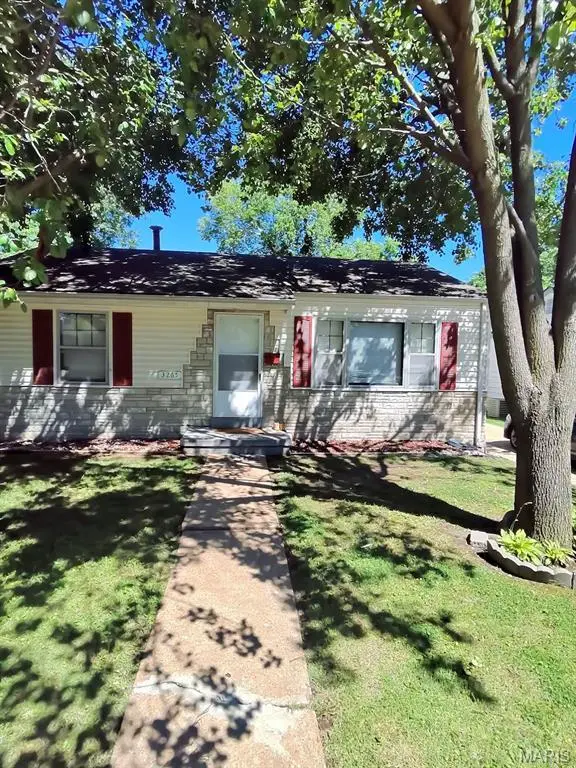
3265 Lynros Dr · St. Ann, MO
Flood risk 4/10 · Minor
- FEMA flood zone
- X (unshaded)
- Chance of flooding over 30 yrs
- 0.2%
- Est. flood insurance / yr
- $473 – $860
Fire risk 1/10 · Minimal
- Est. fire insurance / yr
- $1,054 – $1,958
Heat risk 4/10 · Minor
- Hot days now (above 106°F)
- 7 days/yr
- Hot days in 30 yrs
- 21 days/yr
Wind risk 2/10 · Minimal
- Chance of severe wind over 30 yrs
- 1.0%
Air-quality risk 2/10 · Minimal
- Unhealthy air days now
- 1 days/yr
- Unhealthy air days in 30 yrs
- 3 days/yr
Risk factors via First Street. Map © Google.
Why this score? — see what drove the C+ grade
The composite is a weighted blend of 9 inputs, each scored 0–100. Each bar is that input's sub-score; the figure is the points it added to the 100-point composite (weight × sub-score).
- Cash flow +23.0/30.0
- ARV discount +15.0/15.0
- DSCR +7.4/10.0
- 1% rule +6.0/10.0
- Rent growth +3.5/5.0
- Livability +2.5/5.0
- Condition / age +2.5/5.0
- Schools +1.7/10.0
- Appreciation +0.0/10.0
$119,900
🖨 Deal sheet (PDF) 📄 Offer letter ✓ Due diligence
Listing remarks MLS
Fantastic home for 1st time buyer or investor. Two bedrooms, hardwood floors, full basement. Ready for your decorating ideas! Listed AS IS. Offers to be submitted on Special Sales Contract. Seller will not pay for or provide any inspections, repairs or warranties of any kind. Earnest money in the form of cashiers check or money order to be minimum $1000 or 3% whichever is greater to be held at title company of seller's choice. Please allow for longer response time within your contracts. Buyer does have right to an inspection for informational purposes only & NOT to be used as a re-negotiation tool to an accepted contract.The seller reserves the right to accept the offer of their choice regardless of the order in which they are received, countered offered or presented from a multiple offer situation.
Key facts
- Clean systems
- 6,499 sq ft lot
- Garage
Tags
Property features AI
Exterior
- Parking: Has garage
- Utilities: Public water; Public sewer; Electric service listed as other
- Home design: Single-family residence; One story
- Construction: Constructed with other/unspecified materials
- Exterior features: Lot with other/unspecified features
Interior
- Bedrooms: 2 bedrooms (both located on the lower level)
- Bathrooms: 1 full bathroom (located on the lower level)
- Heating & cooling: Forced air heating; Central air conditioning
- Interior features: Full basement
Neighborhood map
What this means for you Summary
Snapshot
- This is a 2-bed/1.0-bath single-family listed at $120k.
Deal economics
- At list price, monthly cash flow is $212 ($3k/yr) — positive.
- The deal already cash-flows at list — no discount required.
- Meets the 1% rule at list price ($1k rent vs $120k).
- Cap rate 8.4% vs local median 6.4% in St. Ann — top-decile yield for the area; either an underpriced asset or a hidden risk that comps aren't pricing in. Stress-test before assuming the spread holds.
Location & tenants
- Location reads: area grade C — affects rentability + tenant quality, not the cash-flow math above.
- Ritenour (suburban): math 13% / reading 27% proficiency, ranked #304 of 324 in MO (top 94%) — low school quality limits family demand, transient renter base, plan for 1-2y turnover; 66% free/reduced lunch — lower-income household profile, screen leases tightly.
- Zoned schools: Buder Elem. (math 17% / reading 22%, grade F, #941 of 1,115 statewide, top 86%, 406 students, 99% FRL); Hoech Middle (math 15% / reading 28%, grade F, #339 of 391 statewide, top 87%, 299 students, 99% FRL); Ritenour Sr. High (math 9% / reading 36%, grade F, #455 of 521 statewide, top 88%, 1,873 students, 100% FRL) — zoned schools average 99% FRL vs 66% district-wide (34 pts higher); higher-poverty schools than district average — tighter screening recommended.
- Market conditions: Rents rising fast (+4.1%/yr); 62 active listings in the ZIP; 34 comparable units currently listed for rent nearby; rentals at typical pace (median 25d on market — plan ~3-4 weeks tenant-placement turnaround); 47% of comp listings sitting > 30 days — soft ceiling on asking rent; 920 units permitted in St. Louis County in 2024 (250 in 5+ unit buildings).
- This rent runs 31% of the median local income ($52k/yr) — at the standard rent-burdened threshold; future hikes will face affordability resistance.
Forward outlook
- Local home prices are declining (-3.0%/yr); year-one equity from $829 of loan paydown is wiped out by about $4k of value loss. Plan a longer hold.
Negotiation context
- Only 3 days on market — expect competitive offers; lowballing is unlikely to land.
- 2 sale attempts since 14y ago with the ask held roughly flat each time — persistent listings suggest the price (not the market) is what's stuck; bring a comps-based counter.
- Current owner paid $72k; list at $120k implies a 67% gain — meaningful room to come down on a strong offer.
Risks & watch-outs
- Watch-outs: built in 1951 — expect roof / HVAC / electrical / plumbing capex.
Questions for the listing agent
- Built in 1951 — when were the roof, HVAC, electrical panel, plumbing, and water heater last replaced?
- Is there a deadline driving the sale (1031 exchange, divorce, estate, relocation)? That informs how much negotiation room exists.
- What's the average days-on-market for RENTAL listings here right now (not sales)? A rising rental-DOM trend means longer vacancies and softer asking-rent achievability than the comps imply.
- What's the recent tenant-quality profile in this submarket — average credit score on applications, eviction rate, late-payment / NSF rate, and stable-employment percentage? A property-management company in the area should have these aggregated.
- How much new for-sale + rental construction is in the pipeline within 1–3 miles? Heavy new supply typically softens prices + rents 12–24 months out; constrained supply supports both.
Investment metrics
- 1% rule
- 1.10% ✓
- Cap rate
- 8.41%
- Cash-on-cash
- 7.57%
- DSCR
- 1.34
- GRM
- 7.6
CMA / ARV
- ARV (on-the-fly)
- $160,650
- Comps found
- 12
Show comp detail 12 sales within ~0.75 mi
| Address | Dist | Beds/Ba | Sqft | Sold | Price | $/sf | Match |
|---|---|---|---|---|---|---|---|
| 10262 Breckenridge Rd | 0.20mi | 2/1.0 | 792 (-7%) | 2mo | $99,900 | $126 | 78 |
| 3507 Westridge Ln | 0.38mi | 3/1.0 (+1) | 864 (+2%) | 1mo | $165,000 | $191 | 74 |
| 3438 Ashby Rd | 0.51mi | 2/1.0 | 816 (-4%) | 2mo | $159,900 | $196 | 68 |
| 3525 Wismer Rd | 0.48mi | 2/1.0 | 816 (-4%) | 5mo | $148,500 | $182 | 67 |
| 10512 Saint Francis Ln | 0.49mi | 2/1.0 | 792 (-7%) | 1mo | $149,900 | $189 | 65 |
| 10346 Saint Henry Ln | 0.68mi | 2/1.0 | 864 (+2%) | 1mo | $155,000 | $179 | 65 |
| 10019 Saint Martha Ln | 0.58mi | 3/1.0 (+1) | 864 (+2%) | 4mo | $188,000 | $218 | 62 |
| 3219 Royalton Ave | 0.59mi | 2/1.0 | 792 (-7%) | 3mo | $102,500 | $129 | 59 |
| 10212 Saint Arthur Ln | 0.63mi | 2/1.0 | 784 (-8%) | 3mo | $154,900 | $198 | 55 |
| 10335 Saint Joan Ln | 0.75mi | 2/1.0 | 897 (+6%) | 2mo | $174,900 | $195 | 54 |
| 10812 Saint Francis Ln | 0.75mi | 2/1.0 | 912 (+7%) | 2mo | $144,900 | $159 | 52 |
| 3113 Ashby Rd | 0.57mi | 3/3.0 (+1) | 960 (+13%) | 1mo | $175,000 | $182 | 38 |
Match score weights: distance 35% · size 25% · config 20% · recency 20%. Top-matched comps best support the ARV.
Projected returns pro-forma
-3.0% appreciation · 4.14% rent growth · sell at horizon
- IRR
- -3.4%
- Equity multiple
- 0.87×
- Total profit
- $-4,383
- Equity at exit
- $17,877
- IRR
- 7.5%
- Equity multiple
- 1.60×
- Total profit
- $20,080
- Equity at exit
- $10,367
Cash invested: $33,572 (down + closing). Projections, not guarantees.
Landlord ↔ Tenant lean methodology
- Overall (STATE)
- 81 Strongly Landlord-Friendly
- State Missouri
- 81 Strongly Landlord-Friendly · R+10
- County
- — inherits STATE
- City
- — inherits STATE
ZIP-level market 63074
- Rents YoY
- 4.1%
- Active inventory
- 62
- Price-to-rent
- 7.6×
Monthly cashflow live
- Estimated rent
- $1,321 high interval (Pro) →
- Mortgage (P&I)
- −$629
- Tax from tax record
- −$153 /mo · $1,837/yr
- Insurance
- −$50
- HOA
- −$0
- Vacancy / Maint / Mgmt
- −$277
- Net cashflow
- $212
Break-even live
Sensitivity live
| Price | -10% $280 | -5% $246 | +0% $212 | +5% $178 | +10% $144 |
|---|---|---|---|---|---|
| Rent | -10% $107 | -5% $160 | +0% $212 | +5% $264 | +10% $316 |
| Rate | -1.0pp $272 | -0.5pp $242 | base $212 | +0.5pp $181 | +1.0pp $149 |
UW: 25.0% down · 7.5% · 30yr · 1.5% tax · 5.0% vac · 8.0% maint · 8.0% mgmt
Financing live
Cash to close
- Down payment
- $29,975
- Closing costs
- $3,597
- Reserves months
- —
- Total cash needed
- —
Loan-product check · same deal, 3 products live
Conventional
25% down · 7.5% · 30yr
- Down + closing
- —
- Monthly P&I
- —
- Monthly cashflow
- —
- DSCR
- —
- Eligible?
- —
Personal DTI + credit; lowest rate.
DSCR
20% down · 8.5% · 30yr
- Down + closing
- —
- Monthly P&I
- —
- Monthly cashflow
- —
- DSCR
- —
- Eligible?
- —
No personal income docs; deal must DSCR.
Hard money
10% down · 12.0% · 12mo
- Down + closing
- —
- Monthly P&I
- —
- Monthly cashflow
- —
- DSCR
- —
- Eligible?
- —
Short-term bridge; refi at stabilization.
Rent comps 34 comps
| Address | Beds | Baths | Sqft | Rent | $/sqft | DOM | Units | Dist |
|---|---|---|---|---|---|---|---|---|
| 10116 Saint Katherine Ln Saint Ann, MO | 3.0 | 1.0 | 984 | $1,865 | $1.90 | 18d | 1 | 0.16mi |
| 10214 Saint Anthony Ln Saint Ann, MO | 2.0 | 1.0 | 734 | $1,200 | $1.63 | 45d | 1 | 0.19mi |
| 10205 Saint Daniel Ln Saint Ann, MO | 2.0 | 1.0 | 792 | $1,450 | $1.83 | 45d | 1 | 0.20mi |
| 3434 Sims Ave Saint Ann, MO | 3.0 | 1.5 | 988 | $1,545 | $1.56 | 45d | 1 | 0.39mi |
| 3529 Saint Joachim Ln Saint Ann, MO | 2.0 | 1.0 | 900 | $1,450 | $1.61 | 25d | 1 | 0.43mi |
| 3529 Saint Joachim Ln Unit NA St Ann, MO | 2.0 | 1.0 | 900 | $1,450 | $1.61 | 21d | 1 | 0.43mi |
| 3219 Royalton Ave Saint Louis, MO | 2.0 | 1.0 | 792 | $1,095 | $1.38 | 23d | 1 | 0.60mi |
| 3209 Royalton Ave Saint Louis, MO | 2.0 | 1.0 | 805 | $1,150 | $1.43 | 45d | 1 | 0.61mi |
| 9618 De Porres Ln Saint Louis, MO | 2.0 | 1.0 | 875 | $1,200 | $1.37 | 45d | 1 | 0.65mi |
| 9675 Muriel Ave Unit 9627 Overland, MO | 2.0 | 1.5 | 830 | $1,200 | $1.45 | 45d | 1 | 0.84mi |
| 9675 Muriel Ave Unit 9709 Overland, MO | 2.0 | 1.5 | 830 | $1,200 | $1.45 | 0d | 1 | 0.84mi |
| 9675 Muriel Ave Unit 9733 Overland, MO | 2.0 | 1.5 | 830 | $1,200 | $1.45 | 4d | 1 | 0.84mi |
| 10069 Livingston Ave St Ann, MO | 2.0 | 1.0 | 875 | $1,100 | $1.26 | 25d | 1 | 0.90mi |
| 9535 Baltimore Ave Saint Louis, MO | 2.0 | 1.0 | 800 | $1,145 | $1.43 | 25d | 1 | 0.92mi |
| 3209 Dix Ave Saint Louis, MO | 3.0 | 1.0 | 1122 | $1,550 | $1.38 | 25d | 1 | 0.94mi |
| 3208 Dix Ave Saint Louis, MO | 2.0 | 1.0 | 656 | $1,215 | $1.85 | 0d | 1 | 0.96mi |
| 3648 Edmundson Rd Unit 1 St. Louis, MO | 2.0 | 1.0 | 900 | $995 | $1.11 | 45d | 1 | 0.99mi |
| 2732 Annapolis Ave Saint Louis, MO | 2.0 | 1.0 | 768 | $1,250 | $1.63 | 45d | 1 | 1.00mi |
| 3961 Jane Ave Unit 3963 St Ann, MO | 2.0 | 1.0 | 750 | $1,195 | $1.59 | 16d | 1 | 1.03mi |
| 9807 Guthrie Ave Saint Louis, MO | 3.0 | 2.0 | 1068 | $1,685 | $1.58 | 0d | 1 | 1.03mi |
| 9429 Baltimore Ave Saint Louis, MO | 2.0 | 1.0 | 900 | $1,200 | $1.33 | 0d | 1 | 1.10mi |
| 9429 Baltimore Ave Saint Louis, MO | 2.0 | 1.0 | 900 | $1,200 | $1.33 | 25d | 1 | 1.10mi |
| 9310 Shirley Gardens Dr Apt C St. Louis, MO | 2.0 | 1.0 | 800 | $1,200 | $1.50 | 45d | 1 | 1.12mi |
| 9310 Shirley Gardens Dr Apt B St. Louis, MO | 2.0 | 1.0 | 800 | $1,100 | $1.38 | 45d | 1 | 1.12mi |
| 9448 Harold Dr Saint Louis, MO | 2.0 | 1.0 | 864 | $1,495 | $1.73 | 45d | 1 | 1.16mi |
| 3010 Woodson Rd Breckenridge Hills, MO | 1.0 | 1.0 | 850 | $895 | $1.05 | 45d | 1 | 1.20mi |
| 11042 Florence Ave Saint Ann, MO | 3.0 | 1.0 | 864 | $1,300 | $1.50 | 14d | 1 | 1.27mi |
| 10742 Tropic Dr Unit VACANT St Ann, MO | 2.0 | 1.0 | 800 | $1,200 | $1.50 | 45d | 1 | 1.31mi |
| 11120 Graben Dr St Ann, MO | 1.0–2.0 | 1.0–1.5 | 850 | $1,250 | $1.47 | 3d | 14 | 1.33mi |
| 10145 Cabana Club Dr St Ann, MO | 1.0–2.0 | 1.0–2.0 | 776 | $1,060 | $1.37 | 45d | 8 | 1.33mi |
| 10788 Tropic Dr Saint Ann, MO | 2.0 | 1.0 | 828 | $1,260 | $1.52 | 45d | 1 | 1.35mi |
| 4120 Geraldine Ave St Ann, MO | 1.0 | 1.0 | 540 | $875 | $1.62 | 45d | 1 | 1.35mi |
| 4120 Geraldine Ave St Ann, MO | 1.0 | 1.0 | 540 | $875 | $1.62 | 23d | 1 | 1.35mi |
| 4120 Geraldine Ave St Ann, MO | 2.0 | 1.5 | 922 | $1,200 | $1.30 | 19d | 1 | 1.35mi |
Listing history 3 events
-
2026-06-21days on market $119,900 Active 3 DOM
-
2026-06-19remarks 391-char remark
-
2026-06-19$119,900 Active 1 DOM
ⓘ Source: listings_history table (triggers on properties + properties_extension) + one-shot
backfill from property_details.listing_events for pre-trigger history.
Tax reassessment forecast MO · Resets to sale price
- Current annual tax
- $1,837 · $153/mo
- Projected year-2 tax
- $1,837 · $153/mo
- Expected delta
- $0/yr ($0/mo · 0.0%)
ⓘ Screening estimate from a state-policy table — verify with the county assessor before closing.
Climate risk First Street
- Flood 4/10 Moderate FEMA zone X (unshaded) · 20% chance over 30 yrs
- Wildfire 1/10 Low
- Heat 4/10 Moderate 7 d/yr ≥106°F today · 21 d/yr by 30 yrs out
- Wind 2/10 Low 100% chance of damaging wind over 30 yrs
- Air quality 2/10 Low 1 unhealthy d/yr today · 3 by 30 yrs out
Nearby sold comps map
Loading sold comps map…
Walkable amenities ~0.75 mi
Loading nearby amenities…
Taxation est. · year 1
- Rental income
- $15,853
- − Mortgage interest
- −$6,716
- − Property taxes
- −$1,837
- − Insurance
- −$600
- − Repairs & maintenance
- −$1,268
- − Management
- −$1,268
- − Depreciation
- −$3,488
- Taxable income
- $675
- Est. tax owed @ 24.0%
- −$162
- After-tax cash flow
- $2,380/yr
For passive investors: Depreciation is non-cash, so a rental often shows a tax loss while cash-flowing — sheltering income. Rental losses are passive: they offset passive income freely, and up to $25,000/yr can offset ordinary (W-2) income if you actively participate and your MAGI is under $100k (phasing out to $0 by $150k); unused losses carry forward. On sale, claimed depreciation is recaptured at up to 25%, and gains may owe capital-gains tax (a 1031 exchange can defer both). Figures are a year-1 estimate at your 24.0% rate — not tax advice; consult a CPA.
Schools (NCES district)
- District
- Ritenour
- NCES district ID
- 2926640
- Math proficiency
- 13% ▼ -14.00%
- Reading proficiency
- 27% ▼ -7.00%
- Median HH income
- $41,410
- Composite
- 17.04/100
- National rank
- #9125
- State rank
- #304 of 324 in MO
Livability — St. Ann
No livability data for this city. (Only ~50 U.S. cities are tracked.)
Census & demographics
- Census place
- St. Ann, MO
- County
- Saint Louis County · 888,823 people
- City population
- 16,237
- Metro
- St. Louis, MO-IL
- Population (ZIP)
- 15,793
- Household income
- $51,610
- Rent vs Own
- Severe rent burden
- 782.0
Population outlook (St. Louis County) Hauer SSP2
- Today (2025)
- 1,025,227 people
- By 2030
- 1,028,023 · +0.3%
- By 2040
- 1,020,940 · -0.4%
- By 2050
- 1,007,280 · -1.8%
- By 2075
- 987,277 · -3.7%
- By 2100
- 921,984 · -10.1%
Race, ethnicity, and origin ACS 2023
- Neighborhood character
- Diverse neighborhood (Simpson 0.65)
- Race & ethnicity
- White 50% Black 27% Hispanic / Latino 19% Two or more races 5% Asian 2%
- Hispanic origin (detail)
- Mexican 16%
- Common ancestry
- Lithuanian 2% Italian 1% Romanian 1%
- Foreign-born
- 13% · Canada, China
- Languages at home
- 80% English-only · Spanish 17% Chinese 1% German/W. Germanic 1%
Political lean MEDSL · St. Louis
- 2024 margin
- Strong D (+23.4) · D 60.8% · R 37.4% · Other 1.7%
- 2008→2024 swing
- +3.5pp toward D · 2008: 19.9pp · 2024: 23.4pp
- All cycles
- 2024: D+23.4 2020: D+24.0 2016: D+16.2 2012: D+13.7 2008: D+19.9
Not yet ingested
- Civics
- —
Market trends
- HPI YoY
- ▼ -242.89%
- Current HPI
- 210.6588
- Rent YoY
- ▲ 4.14%
- Metro
- St. Louis, MO-IL
- State GDP YoY
- ▲ 1.84%
- F500 in state
- 20
Industry mix (Fortune 500 HQ in MO)
| Industry | F500 HQs | Revenue |
|---|---|---|
| Healthcare | 1 | $163B |
|
||
| Insurance | 1 | $21B |
|
||
| Industrial Technology | 1 | $17B |
|
||
| Retail | 1 | $16B |
|
||
| Industrial Distribution | 1 | $10B |
|
||
| Utilities | 1 | $9B |
|
||
Price history
+139.8% since first listed9 events — show timeline
- 2026-06-18 Listed $119,900 MARIS as Distributed by MLS Grid
- 2022-12-22 Rental Removed $975 RENT.
- 2022-06-22 Price Changed $975 RENT.
- 2020-10-13 Sold (Public Records) $72,000 Public Records
- 2012-06-01 Sold (MLS) — MARIS as Distributed by MLS Grid
- 2012-03-13 Listed $37,900 MARIS as Distributed by MLS Grid
- 2004-01-30 Sold (Public Records) $91,000 Public Records
- 1997-03-10 Sold (Public Records) $50,000 Public Records
- 1992-12-23 Sold (Public Records) — Public Records
Property tax history
+9.4%/yrLatest (2022): $1,837 · +0.1% YoY. Source: county tax records.
Cash-flow waterfall
monthlySold comps — $/sqft
last 12 mo · ≤1 miLoading sold comps…