 Fourplex
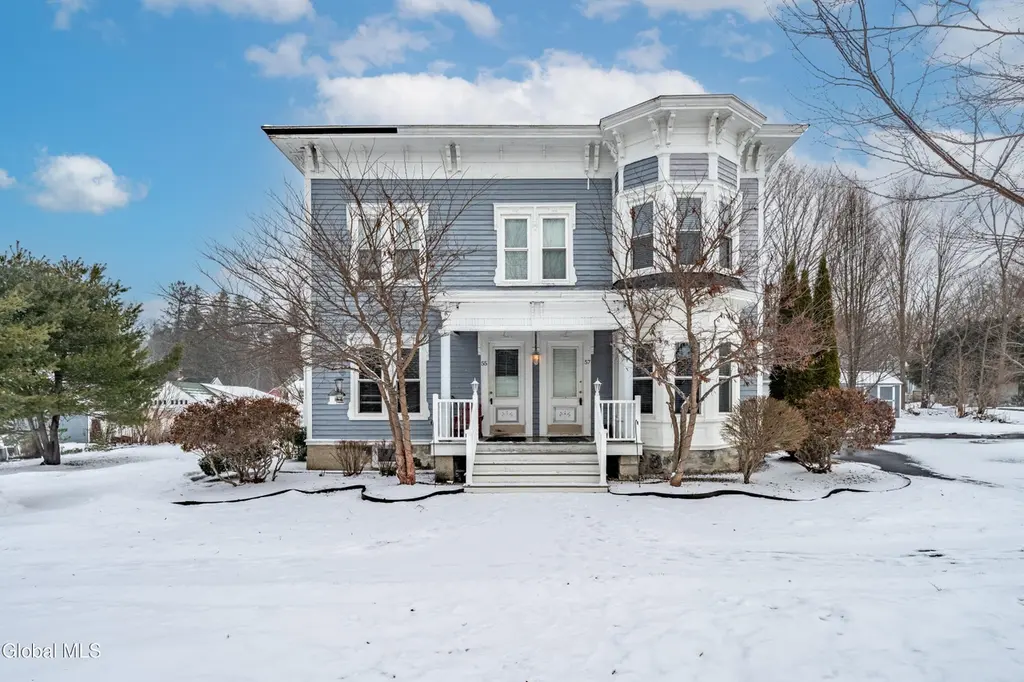
57 Bridge St · Broadalbin, NY
Flood risk 1/10 · Minimal
- FEMA flood zone
- X
- Chance of flooding over 30 yrs
- 0.0%
- Est. flood insurance / yr
- $473 – $860
Fire risk 1/10 · Minimal
- Est. fire insurance / yr
- $691 – $1,283
Heat risk 2/10 · Minimal
- Hot days now (above 93°F)
- 7 days/yr
- Hot days in 30 yrs
- 17 days/yr
Wind risk 2/10 · Minimal
- Chance of severe wind over 30 yrs
- 4.0%
Air-quality risk 1/10 · Minimal
- Unhealthy air days now
- 0 days/yr
- Unhealthy air days in 30 yrs
- 0 days/yr
Risk factors via First Street. Map © Google.
Why this score? — see what drove the C grade
The composite is a weighted blend of 9 inputs, each scored 0–100. Each bar is that input's sub-score; the figure is the points it added to the 100-point composite (weight × sub-score).
- Cash flow +17.7/30.0
- Appreciation +10.0/10.0
- ARV discount +7.5/15.0
- DSCR +5.5/10.0
- 1% rule +4.8/10.0
- Schools +4.8/10.0
- Livability +3.7/5.0
- Rent growth +2.5/5.0
- Condition / age +2.5/5.0
$377,000
🖨 Deal sheet (PDF) 📄 Offer letter ✓ Due diligence
Multi-family units
County records classify this as Multi-Family (2-4 Unit). Listing-text estimate: 4 units. confirmed
Listing remarks
Well-maintained 4-unit investment property located in the Village of Broadalbin. Each unit features 1 bedroom and 1 bathroom, making this an ideal opportunity for investors seeking steady rental income. Property includes off-street parking with two spaces per unit along Bridge St, plus a one-car garage in the rear of the property. Conveniently located near local shops, restaurants, and amenities in the village. A solid addition to any investment portfolio.
Key facts
- One-car garage
- Off-street parking
- Restaurants
Tags
Neighborhood map
What this means for you Summary
Snapshot
- This is a 4 × 1-bed/1.0-bath units multifamily listed at $377k.
Deal economics
- At list price, monthly cash flow is $300 ($4k/yr) — positive. Per door: $75/mo.
- The deal already cash-flows at list — no discount required.
- To meet the 1% rule (rent ≥ 1% of price), the offer needs to be $370k (1.9% below list).
- Recommended offer: $370k (1.9% below list) — sets the bar for 1% rule.
- Cap rate 7.2% vs local median 3.2% in Broadalbin — top-decile yield for the area; either an underpriced asset or a hidden risk that comps aren't pricing in. Stress-test before assuming the spread holds.
Location & tenants
- Location reads 74/100 on livability (#290 in NY, #4,681 nationally) — a middle-class / working-renter tenant base. Strengths: schools A+, housing A+, crime A; Watch: amenities F, commute F, health & safety D-.
- Broadalbin-Perth Central School District (rural): math 50% / reading 62% proficiency, ranked #286 of 590 in NY (top 48%) — acceptable for families but not a draw, mixed tenant base, ~2y average lease.
- Market conditions: 37 active listings in the ZIP; 112 units permitted in Fulton County in 2024 (50 in 5+ unit buildings).
Forward outlook
- In year one you build about $40k of equity ($3k loan paydown + $38k appreciation (10.0% local appreciation)).
- Fulton County population projected at -23% by 2050 — secular population decline; favor cash flow + early exit over multi-decade hold.
- At projected returns (10.0% appreciation + 3.0% rent growth), your $106k cash investment doubles in ~3 years — after that, you're playing with house money.
- By year 2, paydown + projected appreciation supports a ~$65k cash-out refi (75% LTV) — recoverable capital for the next deal without selling this one.
Negotiation context
- Only 7 days on market — expect competitive offers; lowballing is unlikely to land.
- Current owner paid $50k; list at $377k implies a 654% gain — meaningful room to come down on a strong offer.
Risks & watch-outs
- Watch-outs: built in 1850 — expect roof / HVAC / electrical / plumbing capex.
Questions for the listing agent
- Can we see the unit-by-unit rent roll, current vacancy, and any below-market leases? What's the average tenancy length?
- What capital expenditures (roof, boiler, parking lot, exteriors) have been made in the last 5 years, and what's planned in the next 2?
- Built in 1850 — when were the roof, HVAC, electrical panel, plumbing, and water heater last replaced?
- Is there a deadline driving the sale (1031 exchange, divorce, estate, relocation)? That informs how much negotiation room exists.
- Schools are A-rated — typically a magnet for longer-tenancy family renters. What's the average tenant stay here, and is there a school-zone premium baked into asking?
- What's the average days-on-market for RENTAL listings here right now (not sales)? A rising rental-DOM trend means longer vacancies and softer asking-rent achievability than the comps imply.
- What's the recent tenant-quality profile in this submarket — average credit score on applications, eviction rate, late-payment / NSF rate, and stable-employment percentage? A property-management company in the area should have these aggregated.
- How much new apartment / multifamily construction is in the pipeline within 1–3 miles? Heavy new supply (>2% of stock underway) typically softens rents 12–24 months out; light construction supports rent growth.
Investment metrics
- 1% rule
- 0.98% ✗
- Cap rate
- 7.25%
- Cash-on-cash
- 3.41%
- DSCR
- 1.15
- GRM
- 8.5
CMA / ARV
No comps found within radius.
Projected returns pro-forma
10.0% appreciation · 3.0% rent growth · sell at horizon
- IRR
- 26.7%
- Equity multiple
- 3.13×
- Total profit
- $224,521
- Equity at exit
- $339,631
- IRR
- 23.4%
- Equity multiple
- 7.12×
- Total profit
- $646,264
- Equity at exit
- $732,428
Cash invested: $105,560 (down + closing). Projections, not guarantees.
Landlord ↔ Tenant lean methodology
- Overall (STATE)
- 15 Strongly Tenant-Friendly
- State New York
- 15 Strongly Tenant-Friendly · D+10
- County
- — inherits STATE
- City
- — inherits STATE
ZIP-level market 12025
- Home prices YoY
- 13.4%
- Active inventory
- 37
- Price-to-rent
- 34.0×
Monthly cashflow live
- Estimated rent
- $3,700 medium interval (Pro) →
- Mortgage (P&I)
- −$1,977
- Tax from tax record
- −$489 /mo · $5,862/yr
- Insurance
- −$157
- HOA
- −$0
- Vacancy / Maint / Mgmt
- −$777
- Net cashflow
- $300
Break-even live
Sensitivity live
| Price | -10% $514 | -5% $407 | +0% $300 | +5% $194 | +10% $87 |
|---|---|---|---|---|---|
| Rent | -10% $8 | -5% $154 | +0% $300 | +5% $447 | +10% $593 |
| Rate | -1.0pp $490 | -0.5pp $396 | base $300 | +0.5pp $203 | +1.0pp $103 |
4-unit breakdown (identical units grouped — click to expand)
| Units | Beds | Baths | Est. rent |
|---|---|---|---|
| 4× units | 1 | 1 | $3,700 |
| #1 | 1 | 1 | $925 |
| #2 | 1 | 1 | $925 |
| #3 | 1 | 1 | $925 |
| #4 | 1 | 1 | $925 |
| Total (4 units) | $3,700 | ||
UW: 25.0% down · 7.5% · 30yr · 1.5% tax · 5.0% vac · 8.0% maint · 8.0% mgmt
Financing live
Cash to close
- Down payment
- $94,250
- Closing costs
- $11,310
- Reserves months
- —
- Total cash needed
- —
Loan-product check · same deal, 3 products live
Conventional
25% down · 7.5% · 30yr
- Down + closing
- —
- Monthly P&I
- —
- Monthly cashflow
- —
- DSCR
- —
- Eligible?
- —
Personal DTI + credit; lowest rate.
DSCR
20% down · 8.5% · 30yr
- Down + closing
- —
- Monthly P&I
- —
- Monthly cashflow
- —
- DSCR
- —
- Eligible?
- —
No personal income docs; deal must DSCR.
Hard money
10% down · 12.0% · 12mo
- Down + closing
- —
- Monthly P&I
- —
- Monthly cashflow
- —
- DSCR
- —
- Eligible?
- —
Short-term bridge; refi at stabilization.
Listing history 4 events
-
2026-03-23status Pending
-
2026-03-16$377,000 Active
-
2010-09-24soldstatus $50,000
-
2005-11-30soldstatus $100,940
ⓘ Source: listings_history table (triggers on properties + properties_extension) + one-shot
backfill from property_details.listing_events for pre-trigger history.
Tax reassessment forecast NY · Partial reset (capped growth)
- Current annual tax
- $5,862 · $489/mo
- Projected year-2 tax
- $6,117 · $510/mo
- Expected delta
- +$254/yr (+$21/mo · 4.3%)
ⓘ Screening estimate from a state-policy table — verify with the county assessor before closing.
Climate risk First Street
- Flood 1/10 Low FEMA zone X · 0% chance over 30 yrs
- Wildfire 1/10 Low
- Heat 2/10 Low 7 d/yr ≥93°F today · 17 d/yr by 30 yrs out
- Wind 2/10 Low 4% chance of damaging wind over 30 yrs
- Air quality 1/10 Low 0 unhealthy d/yr today · 0 by 30 yrs out
Nearby sold comps map
Loading sold comps map…
Walkable amenities ~0.75 mi
Loading nearby amenities…
Taxation est. · year 1
- Rental income
- $44,400
- − Mortgage interest
- −$21,118
- − Property taxes
- −$5,862
- − Insurance
- −$1,885
- − Repairs & maintenance
- −$3,552
- − Management
- −$3,552
- − Depreciation
- −$10,967
- Taxable loss
- −$2,537
- Est. tax savings @ 24.0%
- +$609
- After-tax cash flow
- $4,213/yr
For passive investors: Depreciation is non-cash, so a rental often shows a tax loss while cash-flowing — sheltering income. Rental losses are passive: they offset passive income freely, and up to $25,000/yr can offset ordinary (W-2) income if you actively participate and your MAGI is under $100k (phasing out to $0 by $150k); unused losses carry forward. On sale, claimed depreciation is recaptured at up to 25%, and gains may owe capital-gains tax (a 1031 exchange can defer both). Figures are a year-1 estimate at your 24.0% rate — not tax advice; consult a CPA.
Schools (NCES district)
- District
- Broadalbin-Perth Central School District
- NCES district ID
- 3600005
- Math proficiency
- 50% ▼ -7.00%
- Reading proficiency
- 62% ▲ 13.00%
- Median HH income
- $55,862
- Composite
- 48.28/100
- National rank
- #2154
- State rank
- #286 of 590 in NY
Livability — Broadalbin
- Score
- 74/100
- State rank
- #290
- US rank
- #4681
Category grades
Schools grade is shown separately in the Schools card above.
Census & demographics
- Census place
- Broadalbin, NY
- Population (ZIP)
- 5,278
Population outlook (Fulton County) Hauer SSP2
- Today (2025)
- 51,132 people
- By 2030
- 49,114 · -3.9%
- By 2040
- 44,373 · -13.2%
- By 2050
- 39,321 · -23.1%
- By 2075
- 28,503 · -44.3%
- By 2100
- 19,268 · -62.3%
Race, ethnicity, and origin ACS 2023
- Neighborhood character
- Predominantly White (89%)
- Race & ethnicity
- White 89% Two or more races 7% Hispanic / Latino 4% Asian 1%
- Common ancestry
- Romanian 8% Lithuanian 7% Iranian 5%
- Foreign-born
- 2% · China, Canada
- Languages at home
- 97% English-only · Chinese 1% Other Indo-European 1% Spanish 1%
Political lean MEDSL · Fulton
- 2024 margin
- Solid R (+35.9) · D 32.1% · R 67.9%
- 2008→2024 swing
- -26.6pp toward R · 2008: -9.2pp · 2024: -35.9pp
- All cycles
- 2024: R+35.9 2020: R+31.4 2016: R+35.5 2012: R+10.5 2008: R+9.2
Not yet ingested
- Civics
- —
Market trends
- HPI YoY
- ▲ 40.87%
- Current HPI
- 344.7778
- Rent YoY
- —
- Metro
- —
- State GDP YoY
- ▲ 2.60%
- F500 in state
- 92
Industry mix (Fortune 500 HQ in NY)
| Industry | F500 HQs | Revenue |
|---|---|---|
| Financial Services | 10 | $950B |
|
||
| Consumer Goods | 9 | $162B |
|
||
| Insurance | 4 | $225B |
|
||
| Telecommunications | 2 | $144B |
|
||
| Pharmaceuticals | 2 | $112B |
|
||
| Media / Entertainment | 2 | $69B |
|
||
Price history
+273.5% since first listed4 events — show timeline
- 2026-03-23 Pending — Global MLS
- 2026-03-16 Listed $377,000 Global MLS
- 2010-09-24 Sold (Public Records) $50,000 Public Records
- 2005-11-30 Sold (Public Records) $100,940 Public Records
Property tax history
+1.6%/yrLatest (2025): $5,862 · +1.4% YoY. Source: county tax records.
Cash-flow waterfall
monthlySold comps — $/sqft
last 12 mo · ≤1 miLoading sold comps…