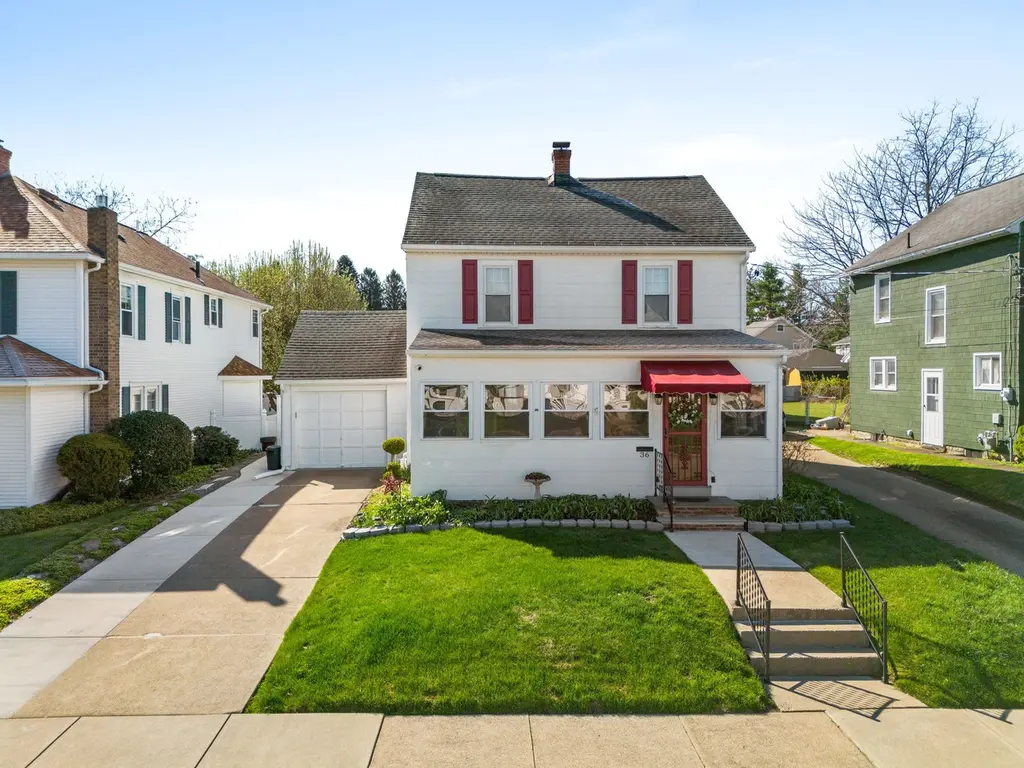
36 Eldridge Ave · Johnson City, NY
Flood risk 4/10 · Minor
- FEMA flood zone
- X
- Chance of flooding over 30 yrs
- 0.21%
- Est. flood insurance / yr
- $473 – $860
Fire risk 1/10 · Minimal
- Est. fire insurance / yr
- $691 – $1,283
Heat risk 3/10 · Minor
- Hot days now (above 92°F)
- 7 days/yr
- Hot days in 30 yrs
- 16 days/yr
Wind risk 2/10 · Minimal
- Chance of severe wind over 30 yrs
- 1.0%
Air-quality risk 2/10 · Minimal
- Unhealthy air days now
- 0 days/yr
- Unhealthy air days in 30 yrs
- 1 days/yr
Risk factors via First Street. Map © Google.
Why this score? — see what drove the D+ grade
The composite is a weighted blend of 9 inputs, each scored 0–100. Each bar is that input's sub-score; the figure is the points it added to the 100-point composite (weight × sub-score).
- Cash flow +13.3/30.0
- Appreciation +10.0/10.0
- Rent growth +4.9/5.0
- 1% rule +4.5/10.0
- DSCR +4.0/10.0
- Livability +3.8/5.0
- Schools +3.3/10.0
- Condition / age +2.5/5.0
- ARV discount +0.0/15.0
$194,900
🖨 Deal sheet (PDF) 📄 Offer letter ✓ Due diligence
Listing remarks
Highest and est is due on this propwrty 6 pm Monday 4/27.. You’ll find a one-car garage plus several bonus spaces that can easily work as a home office, playroom, or extra living area. The kitchen is both functional and stylish, featuring Corian countertop, stainless steel appliances, pull-out drawers for extra storage, and an automatic shade for added convenience. Enjoy your morning coffee or unwind in the enclosed front porch and take advantage of the beautifully kept gardens that add charm and curb appeal. Out back, there’s a fully fenced, level yard—perfect for pets, entertaining, or just enjoying the outdoors. The large composite deck is low-maintenance and great for
Key facts
- One car garage
- Bonus spaces
- Corian countertop
Tags
Property features AI
Exterior
- Parking: Attached garage (1 car)
- Utilities: Public water; Public sewer; Cable available
- Home design: Single family residence; Two levels / 2 stories; Residential property
- Construction: Shingle siding; Other construction materials
- Exterior features: Level lot; Covered porch; Deck; Fenced yard; Shed(s)
Interior
- Kitchen: Range; Free-standing range; Dishwasher; Microwave; Refrigerator; Gas water heater
- Flooring: Carpet; Hardwood; Vinyl
- Bathrooms: 1 full bathroom; 1 half bathroom
- Heating & cooling: Forced air heating; Central air conditioning
- Interior features: Insulated windows; Gas fireplace (1)
- Laundry & utility: Washer; Dryer
Neighborhood map
What this means for you Summary
Snapshot
- This is a 3-bed/1.0-bath single-family listed at $195k.
Deal economics
- At list price, monthly cash flow is $1 ($7/yr) — positive.
- The deal already cash-flows at list — no discount required.
- To meet the 1% rule (rent ≥ 1% of price), the offer needs to be $185k (5.1% below list).
- Recommended offer: $185k (5.1% below list) — sets the bar for 1% rule.
Location & tenants
- Location reads 76/100 on livability (#238 in NY, #3,739 nationally) — a middle-class / working-renter tenant base. Strengths: cost of living A+, housing A+, health & safety A+; Watch: crime F, employment D-.
- Johnson City Central School District (suburban): math 38% / reading 41% proficiency, ranked #535 of 590 in NY (top 91%) — families likely to look elsewhere, expect single-tenant / working-renter base with shorter leases.
- Zoned schools: Johnson City Elementary/Primary School (496 students, 55% FRL); Johnson City Middle School (math 19% / reading 43%, grade F, #534 of 729 statewide, top 73%, 500 students, 65% FRL); Johnson City Senior High School (math 98% / reading 64%, grade A, #485 of 1,100 statewide, top 45%, 729 students, 60% FRL) — zoned schools at 60% FRL track the district average.
- Zoned-school proficiency averages 56% at this address vs 40% district-wide (+16 pts) — the actual schools serving this property are materially stronger than the Johnson City Central School District average implies; a family-tenant draw the district grade alone would hide.
- Market conditions: Rents rising fast (+9.5%/yr); 102 active listings in the ZIP; 11 comparable units currently listed for rent nearby; rentals at typical pace (median 23d on market — plan ~3-4 weeks tenant-placement turnaround); 340 units permitted in Broome County in 2024 (269 in 5+ unit buildings).
- This rent runs 38% of the median local income ($59k/yr) — at the standard rent-burdened threshold; future hikes will face affordability resistance.
Forward outlook
- In year one you build about $21k of equity ($1k loan paydown + $19k appreciation (10.0% local appreciation)).
- Broome County population projected at -13% by 2050 — secular population decline; favor cash flow + early exit over multi-decade hold.
- At projected returns (10.0% appreciation + 8.0% rent growth), your $55k cash investment doubles in ~3 years — after that, you're playing with house money.
- By year 2, paydown + projected appreciation supports a ~$33k cash-out refi (75% LTV) — recoverable capital for the next deal without selling this one.
Negotiation context
- Only 4 days on market — expect competitive offers; lowballing is unlikely to land.
Risks & watch-outs
- Watch-outs: built in 1940 — expect roof / HVAC / electrical / plumbing capex.
Questions for the listing agent
- Built in 1940 — when were the roof, HVAC, electrical panel, plumbing, and water heater last replaced?
- Is there a deadline driving the sale (1031 exchange, divorce, estate, relocation)? That informs how much negotiation room exists.
- Crime grade is F in this area — have there been break-ins, vandalism, or insurance claims at this property in the last 3 years? What carrier currently insures it and at what premium?
- The area grade is low — what's the realistic commute time and amenity access for the typical tenant pool here? Any planned neighborhood developments (good or bad) we should know about?
- What's the average days-on-market for RENTAL listings here right now (not sales)? A rising rental-DOM trend means longer vacancies and softer asking-rent achievability than the comps imply.
- What's the recent tenant-quality profile in this submarket — average credit score on applications, eviction rate, late-payment / NSF rate, and stable-employment percentage? A property-management company in the area should have these aggregated.
- How much new for-sale + rental construction is in the pipeline within 1–3 miles? Heavy new supply typically softens prices + rents 12–24 months out; constrained supply supports both.
Investment metrics
- 1% rule
- 0.95% ✗
- Cap rate
- 6.30%
- Cash-on-cash
- 0.01%
- DSCR
- 1.00
- GRM
- 8.8
CMA / ARV
- ARV (on-the-fly)
- $166,738
- Comps found
- 12
Show comp detail 12 sales within ~0.75 mi
| Address | Dist | Beds/Ba | Sqft | Sold | Price | $/sf | Match |
|---|---|---|---|---|---|---|---|
| 12 Eldridge Ave | 0.06mi | 3/1.5 | 1,518 (-4%) | 4mo | $132,000 | $87 | 86 |
| 32 Haynes Ave | 0.44mi | 3/1.0 | 1,518 (-4%) | 5mo | $95,000 | $63 | 69 |
| 68 Thomas St | 0.34mi | 3/2.0 | 1,644 (+4%) | 5mo | $208,000 | $127 | 69 |
| 95 Thomas St | 0.37mi | 3/2.0 | 1,488 (-5%) | 2mo | $131,978 | $89 | 68 |
| 73 Elizabeth St | 0.39mi | 3/2.5 | 1,480 (-6%) | 2mo | $190,000 | $128 | 64 |
| 234 Saint Charles St | 0.43mi | 4/1.0 (+1) | 1,512 (-4%) | 7mo | $112,000 | $74 | 63 |
| 129 Ackley Ave | 0.37mi | 4/1.5 (+1) | 1,460 (-7%) | 5mo | $160,000 | $110 | 60 |
| 446 Grand Ave | 0.44mi | 3/2.0 | 1,364 (-13%) | 1mo | $100,000 | $73 | 52 |
| 121 West St | 0.61mi | 3/2.0 | 1,758 (+12%) | 4mo | $144,000 | $82 | 45 |
| 43 Haynes Ave | 0.48mi | 4/1.5 (+1) | 1,360 (-14%) | 5mo | $155,000 | $114 | 44 |
| 66 Sergeant St | 0.72mi | 4/2.5 (+1) | 1,701 (+8%) | 4mo | $187,500 | $110 | 38 |
| 50 Crocker Ave | 0.72mi | 4/2.0 (+1) | 1,411 (-10%) | 8mo | $150,000 | $106 | 34 |
Match score weights: distance 35% · size 25% · config 20% · recency 20%. Top-matched comps best support the ARV.
Projected returns pro-forma
10.0% appreciation · 8.0% rent growth · sell at horizon
- IRR
- 26.2%
- Equity multiple
- 3.13×
- Total profit
- $116,061
- Equity at exit
- $175,581
- IRR
- 24.5%
- Equity multiple
- 7.71×
- Total profit
- $366,162
- Equity at exit
- $378,648
Cash invested: $54,572 (down + closing). Projections, not guarantees.
Landlord ↔ Tenant lean methodology
- Overall (STATE)
- 15 Strongly Tenant-Friendly
- State New York
- 15 Strongly Tenant-Friendly · D+10
- County
- — inherits STATE
- City
- — inherits STATE
ZIP-level market 13790
- Home prices YoY
- 6.8%
- Rents YoY
- 9.5%
- Active inventory
- 102
- Price-to-rent
- 8.8×
Monthly cashflow live
- Estimated rent
- $1,850 high interval (Pro) →
- Mortgage (P&I)
- −$1,022
- Tax from tax record
- −$357 /mo · $4,290/yr
- Insurance
- −$81
- HOA
- −$0
- Vacancy / Maint / Mgmt
- −$388
- Net cashflow
- $1
Break-even live
Sensitivity live
| Price | -10% $111 | -5% $56 | +0% $1 | +5% $-55 | +10% $-110 |
|---|---|---|---|---|---|
| Rent | -10% $-146 | -5% $-72 | +0% $1 | +5% $74 | +10% $147 |
| Rate | -1.0pp $99 | -0.5pp $50 | base $1 | +0.5pp $-50 | +1.0pp $-101 |
UW: 25.0% down · 7.5% · 30yr · 1.5% tax · 5.0% vac · 8.0% maint · 8.0% mgmt
Financing live
Cash to close
- Down payment
- $48,725
- Closing costs
- $5,847
- Reserves months
- —
- Total cash needed
- —
Loan-product check · same deal, 3 products live
Conventional
25% down · 7.5% · 30yr
- Down + closing
- —
- Monthly P&I
- —
- Monthly cashflow
- —
- DSCR
- —
- Eligible?
- —
Personal DTI + credit; lowest rate.
DSCR
20% down · 8.5% · 30yr
- Down + closing
- —
- Monthly P&I
- —
- Monthly cashflow
- —
- DSCR
- —
- Eligible?
- —
No personal income docs; deal must DSCR.
Hard money
10% down · 12.0% · 12mo
- Down + closing
- —
- Monthly P&I
- —
- Monthly cashflow
- —
- DSCR
- —
- Eligible?
- —
Short-term bridge; refi at stabilization.
Rent comps 11 comps
| Address | Beds | Baths | Sqft | Rent | $/sqft | DOM | Units | Dist |
|---|---|---|---|---|---|---|---|---|
| 400 Riverside Dr Unit 212 Johnson City, NY | 3.0 | 1.0 | 1100 | $2,500 | $2.27 | 15d | 1 | 0.25mi |
| 145 Floral Ave Unit 4 Johnson City, NY | 3.0 | 1.0 | 1095 | $1,250 | $1.14 | 22d | 1 | 0.72mi |
| 50 Crocker Ave Johnson City, NY | 4.0 | 2.0 | 1411 | $2,000 | $1.42 | 22d | 1 | 0.74mi |
| 51 Allen St Unit 1 Johnson City, NY | 3.0 | 1.0 | 1170 | $1,575 | $1.35 | 22d | 1 | 0.79mi |
| 248 Main St Unit 2 Johnson City, NY | 2.0 | 1.0 | 1650 | $1,650 | $1.00 | 15d | 1 | 0.99mi |
| 3613 Vestal Rd Vestal, NY | 3.0 | 2.0 | 1590 | $2,000 | $1.26 | 15d | 1 | 1.06mi |
| 10 Bidwell St Johnson City, NY | 3.0 | 2.0 | 1200 | $1,850 | $1.54 | 45d | 1 | 1.09mi |
| 129 Helen St Unit 1 Binghamton, NY | 4.0 | 2.0 | 1850 | $2,200 | $1.19 | 45d | 1 | 1.29mi |
| 133 Crestmont Rd Unit 2 Binghamton, NY | 3.0 | 1.0 | 1300 | $1,900 | $1.46 | 45d | 1 | 1.29mi |
| 99 Helen St Unit 2 Binghamton, NY | 3.0 | 1.0 | 1220 | $1,600 | $1.31 | 45d | 1 | 1.31mi |
| 296 Main St Unit 6 Binghamton, NY | 3.0 | 1.0 | 1200 | $1,250 | $1.04 | 15d | 1 | 1.36mi |
Listing history 2 events
-
2026-04-28status Pending
-
2026-04-24$194,900 Active
ⓘ Source: listings_history table (triggers on properties + properties_extension) + one-shot
backfill from property_details.listing_events for pre-trigger history.
Tax reassessment forecast NY · Partial reset (capped growth)
- Current annual tax
- $4,290 · $357/mo
- Projected year-2 tax
- $4,290 · $357/mo
- Expected delta
- $0/yr ($0/mo · 0.0%)
ⓘ Screening estimate from a state-policy table — verify with the county assessor before closing.
Climate risk First Street
- Flood 4/10 Moderate FEMA zone X · 21% chance over 30 yrs
- Wildfire 1/10 Low
- Heat 3/10 Moderate 7 d/yr ≥92°F today · 16 d/yr by 30 yrs out
- Wind 2/10 Low 100% chance of damaging wind over 30 yrs
- Air quality 2/10 Low 0 unhealthy d/yr today · 1 by 30 yrs out
Nearby sold comps map
Loading sold comps map…
Walkable amenities ~0.75 mi
Loading nearby amenities…
Taxation est. · year 1
- Rental income
- $22,198
- − Mortgage interest
- −$10,917
- − Property taxes
- −$4,290
- − Insurance
- −$974
- − Repairs & maintenance
- −$1,776
- − Management
- −$1,776
- − Depreciation
- −$5,670
- Taxable loss
- −$3,205
- Est. tax savings @ 24.0%
- +$769
- After-tax cash flow
- $777/yr
For passive investors: Depreciation is non-cash, so a rental often shows a tax loss while cash-flowing — sheltering income. Rental losses are passive: they offset passive income freely, and up to $25,000/yr can offset ordinary (W-2) income if you actively participate and your MAGI is under $100k (phasing out to $0 by $150k); unused losses carry forward. On sale, claimed depreciation is recaptured at up to 25%, and gains may owe capital-gains tax (a 1031 exchange can defer both). Figures are a year-1 estimate at your 24.0% rate — not tax advice; consult a CPA.
Schools (NCES district)
- District
- Johnson City Central School District
- NCES district ID
- 3615900
- Math proficiency
- 38% ▼ -8.00%
- Reading proficiency
- 41% ▲ 2.00%
- Median HH income
- $40,514
- Composite
- 33.17/100
- National rank
- #5545
- State rank
- #535 of 590 in NY
Livability — Johnson City
- Score
- 76/100
- State rank
- #238
- US rank
- #3739
Category grades
Schools grade is shown separately in the Schools card above.
Census & demographics
- Census place
- Johnson City, NY
- County
- Broome County · 126,805 people
- City population
- 18,739
- Metro
- Binghamton, NY
- Population (ZIP)
- 18,739
- Household income
- $59,045
- Rent vs Own
- Severe rent burden
- 1233.0
Population outlook (Broome County) Hauer SSP2
- Today (2025)
- 187,989 people
- By 2030
- 183,066 · -2.6%
- By 2040
- 172,228 · -8.4%
- By 2050
- 163,161 · -13.2%
- By 2075
- 153,641 · -18.3%
- By 2100
- 140,851 · -25.1%
Race, ethnicity, and origin ACS 2023
- Neighborhood character
- Predominantly White (75%)
- Race & ethnicity
- White 75% Two or more races 9% Asian 8% Black 6% Hispanic / Latino 4%
- Common ancestry
- Romanian 6% Lithuanian 3% Scotch-Irish 2%
- Foreign-born
- 9% · Canada, China, Vietnam
- Languages at home
- 88% English-only · Other Indo-European 4% French/Haitian/Cajun 2% Spanish 2%
Political lean MEDSL · Broome
- 2024 margin
- Toss-up / Even · D 50.2% · R 49.8%
- 2008→2024 swing
- -7.6pp toward R · 2008: 8.0pp · 2024: 0.4pp
- All cycles
- 2024: D+0.4 2020: D+3.5 2016: R+3.7 2012: D+4.6 2008: D+8.0
Not yet ingested
- Civics
- —
Market trends
- HPI YoY
- ▲ 18.06%
- Current HPI
- 285.3668
- Rent YoY
- ▲ 9.47%
- Metro
- Binghamton, NY
- State GDP YoY
- ▲ 2.60%
- F500 in state
- 92
Industry mix (Fortune 500 HQ in NY)
| Industry | F500 HQs | Revenue |
|---|---|---|
| Financial Services | 10 | $950B |
|
||
| Consumer Goods | 9 | $162B |
|
||
| Insurance | 4 | $225B |
|
||
| Telecommunications | 2 | $144B |
|
||
| Pharmaceuticals | 2 | $112B |
|
||
| Media / Entertainment | 2 | $69B |
|
||
Price history
2 events — show timeline
- 2026-04-28 Pending — GBAOR
- 2026-04-24 Listed $194,900 GBAOR
Property tax history
+6.6%/yrLatest (2025): $4,290 · +1.6% YoY. Source: county tax records.
Cash-flow waterfall
monthlySold comps — $/sqft
last 12 mo · ≤1 miLoading sold comps…