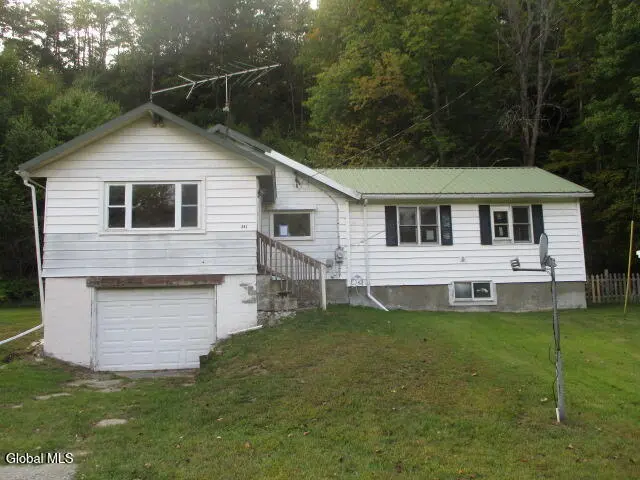
241 Stony Creek Rd · Lake Luzerne, NY
Flood risk 5/10 · Moderate
- FEMA flood zone
- X
- Chance of flooding over 30 yrs
- 0.24%
- Est. flood insurance / yr
- $473 – $860
Fire risk 3/10 · Minor
- Est. fire insurance / yr
- $691 – $1,283
Heat risk 2/10 · Minimal
- Hot days now (above 92°F)
- 7 days/yr
- Hot days in 30 yrs
- 16 days/yr
Wind risk 2/10 · Minimal
- Chance of severe wind over 30 yrs
- 2.0%
Air-quality risk 1/10 · Minimal
- Unhealthy air days now
- 0 days/yr
- Unhealthy air days in 30 yrs
- 0 days/yr
Risk factors via First Street. Map © Google.
Why this score? — see what drove the B+ grade
The composite is a weighted blend of 9 inputs, each scored 0–100. Each bar is that input's sub-score; the figure is the points it added to the 100-point composite (weight × sub-score).
- Cash flow +28.5/30.0
- DSCR +10.0/10.0
- Appreciation +10.0/10.0
- 1% rule +8.4/10.0
- ARV discount +7.5/15.0
- Schools +4.2/10.0
- Livability +3.2/5.0
- Rent growth +2.5/5.0
- Condition / age +2.5/5.0
$94,900
🖨 Deal sheet 📄 Offer letter ✓ Due diligence
Listing remarks MLS
Best deal in Hadley, Great area sits of the road. Full basement with a pull in Garage. Nice yard. Shed. Large kitchen and double living room. Nice entry area.
Key facts
- 0.63 acre lot
- Garage
- Built 1950
Neighborhood map
What this means for you Summary
Snapshot
- This is a 2-bed/1.0-bath single-family listed at $95k.
Deal economics
- At list price, monthly cash flow is $310 ($4k/yr) — positive.
- The deal already cash-flows at list — no discount required.
- Meets the 1% rule at list price ($1k rent vs $95k).
- Recommended offer: $84k (12.0% below list) — sets the bar for market timing.
- Cap rate 10.2% vs local median 7.0% in Lake Luzerne — top-decile yield for the area; either an underpriced asset or a hidden risk that comps aren't pricing in. Stress-test before assuming the spread holds.
Location & tenants
- Location reads 65/100 on livability (#682 in NY) — a middle-class / working-renter tenant base. Strengths: housing A+, crime A; Watch: amenities F, commute F, health & safety D-.
- Hadley-Luzerne Central School District (rural): math 41% / reading 57% proficiency, ranked #396 of 590 in NY (top 67%) — families likely to look elsewhere, expect single-tenant / working-renter base with shorter leases.
- Market conditions: 45 active listings in the ZIP; 1,132 units permitted in Saratoga County in 2024 (378 in 5+ unit buildings).
Forward outlook
- In year one you build about $10k of equity ($656 loan paydown + $9k appreciation (10.0% local appreciation)).
- Saratoga County population projected at +4% by 2050 — modest demand growth; plan on rents tracking national, not racing it.
- At projected returns (10.0% appreciation + 3.0% rent growth), your $27k cash investment doubles in ~2 years — after that, you're playing with house money.
- By year 4, paydown + projected appreciation supports a ~$36k cash-out refi (75% LTV) — recoverable capital for the next deal without selling this one.
Negotiation context
- It's been on market 135 days — a 12% lower offer ($84k) is reasonable based on typical stale-listing flexibility.
- 2 sale attempts; this cycle's ask has dropped $10k (10%) from the opening price — seller is motivated, your offer sets the floor, not the list.
Risks & watch-outs
- Watch-outs: built in 1950 — expect roof / HVAC / electrical / plumbing capex.
- Climate carrying-cost: moderate flood risk — expect insurance premiums to compound above CPI over the hold.
Questions for the listing agent
- It's been on market 135 days. Have you received any prior offers? Is the seller open to a 12% concession, seller financing, or rate buy-down credit?
- Built in 1950 — when were the roof, HVAC, electrical panel, plumbing, and water heater last replaced?
- Why hasn't it sold? Are there any deal-killer items the seller is aware of (foundation, flood, title, zoning, code violations)?
- Is there a deadline driving the sale (1031 exchange, divorce, estate, relocation)? That informs how much negotiation room exists.
- What's the average days-on-market for RENTAL listings here right now (not sales)? A rising rental-DOM trend means longer vacancies and softer asking-rent achievability than the comps imply.
- What's the recent tenant-quality profile in this submarket — average credit score on applications, eviction rate, late-payment / NSF rate, and stable-employment percentage? A property-management company in the area should have these aggregated.
- How much new for-sale + rental construction is in the pipeline within 1–3 miles? Heavy new supply typically softens prices + rents 12–24 months out; constrained supply supports both.
Investment metrics
- 1% rule
- 1.34% ✓
- Cap rate
- 10.22%
- Cash-on-cash
- 14.02%
- DSCR
- 1.62
- GRM
- 6.2
CMA / ARV
- ARV (median comp)
- $361,298
- List price
- $94,900
- Delta
- -73.73%
- Verdict
- UNDERPRICED
- Comps
- 9 within 1.0 mi
Show comp detail 1 sale within ~0.75 mi
| Address | Dist | Beds/Ba | Sqft | Sold | Price | $/sf | Match |
|---|---|---|---|---|---|---|---|
| 76 Third Ave | 0.71mi | 3/3.0 (+1) | 1,460 (+9%) | 17mo | $250,000 | $171 | 26 |
Match score weights: distance 35% · size 25% · config 20% · recency 20%. Top-matched comps best support the ARV.
Projected returns pro-forma
10.0% appreciation · 3.0% rent growth · sell at horizon
- IRR
- 34.6%
- Equity multiple
- 3.69×
- Total profit
- $71,497
- Equity at exit
- $85,493
- IRR
- 29.8%
- Equity multiple
- 8.34×
- Total profit
- $195,092
- Equity at exit
- $184,370
Cash invested: $26,572 (down + closing). Projections, not guarantees.
Landlord ↔ Tenant lean methodology
- Overall (STATE)
- 15 Strongly Tenant-Friendly
- State New York
- 15 Strongly Tenant-Friendly · D+10
- County
- — inherits STATE
- City
- — inherits STATE
ZIP-level market 12835
- Home prices YoY
- 20.0%
- Active inventory
- 45
- Price-to-rent
- 6.2×
Monthly cashflow live
- Estimated rent
- $1,276 medium interval (Pro) →
- Mortgage (P&I)
- −$498
- Tax from tax record
- −$161 /mo · $1,926/yr
- Insurance
- −$40
- HOA
- −$0
- Vacancy / Maint / Mgmt
- −$268
- Net cashflow
- $310
Break-even live
UW: 25.0% down · 7.5% · 30yr · 1.5% tax · 5.0% vac · 8.0% maint · 8.0% mgmt
Financing live
Cash to close
- Down payment
- $23,725
- Closing costs
- $2,847
- Reserves months
- —
- Total cash needed
- —
Loan-product check · same deal, 3 products live
Conventional
25% down · 7.5% · 30yr
- Down + closing
- —
- Monthly P&I
- —
- Monthly cashflow
- —
- DSCR
- —
- Eligible?
- —
Personal DTI + credit; lowest rate.
DSCR
20% down · 8.5% · 30yr
- Down + closing
- —
- Monthly P&I
- —
- Monthly cashflow
- —
- DSCR
- —
- Eligible?
- —
No personal income docs; deal must DSCR.
Hard money
10% down · 12.0% · 12mo
- Down + closing
- —
- Monthly P&I
- —
- Monthly cashflow
- —
- DSCR
- —
- Eligible?
- —
Short-term bridge; refi at stabilization.
Listing history 18 events
-
2026-06-18days on market $94,900 Active 135 DOM
-
2026-06-17days on market $94,900 Active 134 DOM
-
2026-06-16days on market $94,900 Active 133 DOM
-
2026-06-15days on market $94,900 Active 132 DOM
-
2026-06-13days on market $94,900 Active 130 DOM
-
2026-06-12days on market $94,900 Active 129 DOM
-
2026-06-09days on market $94,900 Active 126 DOM
-
2026-06-08days on market $94,900 Active 125 DOM
-
2026-06-07days on market $94,900 Active 124 DOM
-
2026-06-05days on market $94,900 Active 122 DOM
-
2026-06-04days on market $94,900 Active 120 DOM
-
2026-06-02days on market $94,900 Active 119 DOM
-
2026-06-01days on market $94,900 Active 118 DOM
-
2026-05-31days on market $94,900 Active 117 DOM
-
2026-04-09status Active 161-char remark
Show marketing remark (161 chars)
Best deal in Hadley, Great area sits of the road. Full basement with a pull in Garage. Nice yard. Shed. Large kitchen and double living room. Nice entry area.
-
2025-12-20status Pending 161-char remark
Show marketing remark (161 chars)
Best deal in Hadley, Great area sits of the road. Full basement with a pull in Garage. Nice yard. Shed. Large kitchen and double living room. Nice entry area.
-
2025-11-26price $94,900 161-char remark
Show marketing remark (161 chars)
Best deal in Hadley, Great area sits of the road. Full basement with a pull in Garage. Nice yard. Shed. Large kitchen and double living room. Nice entry area.
-
2025-10-17$104,900 Active 161-char remark
Show marketing remark (161 chars)
Best deal in Hadley, Great area sits of the road. Full basement with a pull in Garage. Nice yard. Shed. Large kitchen and double living room. Nice entry area.
ⓘ Source: listings_history table (triggers on properties + properties_extension) + one-shot
backfill from property_details.listing_events for pre-trigger history.
Tax reassessment forecast NY · Partial reset (capped growth)
- Current annual tax
- $1,926 · $161/mo
- Projected year-2 tax
- $1,926 · $161/mo
- Expected delta
- $0/yr ($0/mo · 0.0%)
ⓘ Screening estimate from a state-policy table — verify with the county assessor before closing.
Climate risk First Street
- Flood 5/10 Major FEMA zone X · 24% chance over 30 yrs
- Wildfire 3/10 Moderate
- Heat 2/10 Low 7 d/yr ≥92°F today · 16 d/yr by 30 yrs out
- Wind 2/10 Low 2% chance of damaging wind over 30 yrs
- Air quality 1/10 Low 0 unhealthy d/yr today · 0 by 30 yrs out
Nearby sold comps map
Loading sold comps map…
Walkable amenities ~0.75 mi
Loading nearby amenities…
Taxation est. · year 1
- Rental income
- $15,313
- − Mortgage interest
- −$5,316
- − Property taxes
- −$1,926
- − Insurance
- −$474
- − Repairs & maintenance
- −$1,225
- − Management
- −$1,225
- − Depreciation
- −$2,761
- Taxable income
- $2,385
- Est. tax owed @ 24.0%
- −$572
- After-tax cash flow
- $3,152/yr
For passive investors: Depreciation is non-cash, so a rental often shows a tax loss while cash-flowing — sheltering income. Rental losses are passive: they offset passive income freely, and up to $25,000/yr can offset ordinary (W-2) income if you actively participate and your MAGI is under $100k (phasing out to $0 by $150k); unused losses carry forward. On sale, claimed depreciation is recaptured at up to 25%, and gains may owe capital-gains tax (a 1031 exchange can defer both). Figures are a year-1 estimate at your 24.0% rate — not tax advice; consult a CPA.
Schools (NCES district)
- District
- Hadley-Luzerne Central School District
- NCES district ID
- 3613110
- Math proficiency
- 41% ▼ -15.00%
- Reading proficiency
- 57% ▲ 2.00%
- Median HH income
- $52,974
- Composite
- 42.18/100
- National rank
- #3292
- State rank
- #396 of 590 in NY
Livability — Lake Luzerne
- Score
- 65/100
- State rank
- #682
- US rank
- #12851
Category grades
Schools grade is shown separately in the Schools card above.
Census & demographics
- Population (ZIP)
- 2,700
Population outlook (Saratoga County) Hauer SSP2
- Today (2025)
- 238,889 people
- By 2030
- 243,681 · +2.0%
- By 2040
- 249,118 · +4.3%
- By 2050
- 248,638 · +4.1%
- By 2075
- 241,675 · +1.2%
- By 2100
- 213,150 · -10.8%
Race, ethnicity, and origin ACS 2023
- Neighborhood character
- Predominantly White (94%)
- Race & ethnicity
- White 94% Two or more races 4% Hispanic / Latino 1%
- Common ancestry
- Romanian 9% Lithuanian 5% Iranian 3%
- Foreign-born
- 5% · Canada
- Languages at home
- 96% English-only · Other Indo-European 1% Russian/Polish/Slavic 1%
Political lean MEDSL · Saratoga
- 2024 margin
- Toss-up / Even · D 50.9% · R 49.1%
- 2008→2024 swing
- -1.6pp toward R · 2008: 3.4pp · 2024: 1.8pp
- All cycles
- 2024: D+1.8 2020: D+5.4 2016: R+4.4 2012: D+2.1 2008: D+3.4
Not yet ingested
- Civics
- —
Market trends
- HPI YoY
- ▲ 54.89%
- Current HPI
- 328.7243
- Rent YoY
- —
- Metro
- —
- State GDP YoY
- ▲ 2.60%
- F500 in state
- 92
Industry mix (Fortune 500 HQ in NY)
| Industry | F500 HQs | Revenue |
|---|---|---|
| Financial Services | 10 | $950B |
|
||
| Consumer Goods | 9 | $162B |
|
||
| Insurance | 4 | $225B |
|
||
| Telecommunications | 2 | $144B |
|
||
| Pharmaceuticals | 2 | $112B |
|
||
| Media / Entertainment | 2 | $69B |
|
||
Price history
-9.5% since first listed4 events — show timeline
- 2026-04-09 Relisted — Global MLS
- 2025-12-20 Pending — Global MLS
- 2025-11-26 Price Changed $94,900 Global MLS
- 2025-10-17 Listed $104,900 Global MLS
Property tax history
+0.3%/yrLatest (2025): $1,926 · +3.2% YoY. Source: county tax records.
Cash-flow waterfall
monthlySold comps — $/sqft
last 12 mo · ≤1 miLoading sold comps…