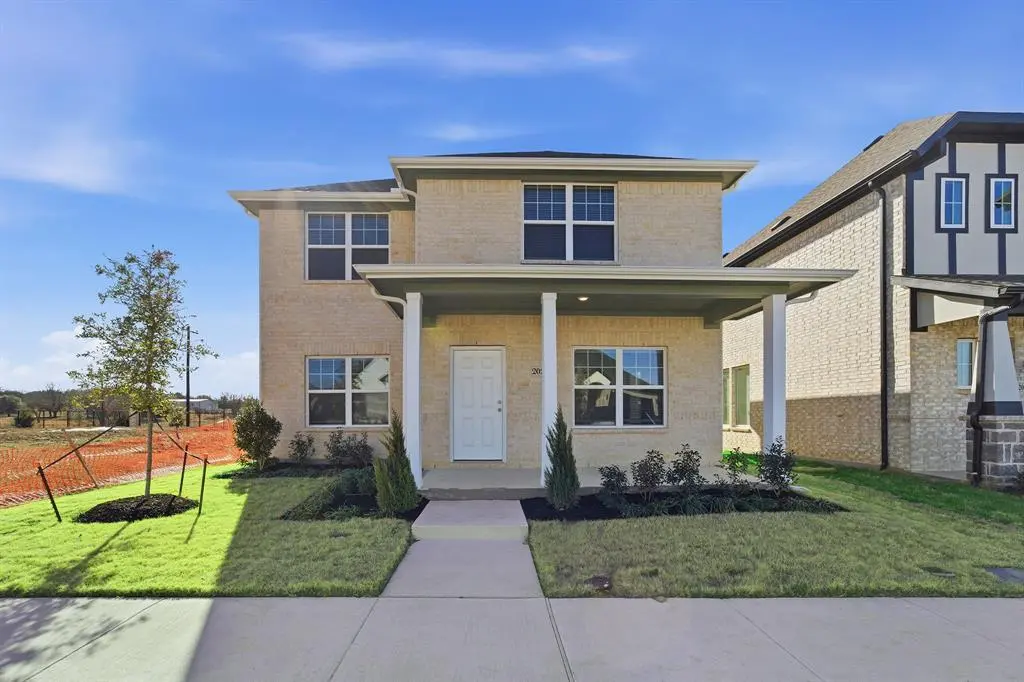
2028 Adriana Ave · Celina, TX
Flood risk No data
- FEMA flood zone
- —
- Chance of flooding over 30 yrs
- —
- Est. flood insurance / yr
- —
Fire risk No data
- Est. fire insurance / yr
- —
Heat risk No data
- Hot days now (above threshold)
- —
- Hot days in 30 yrs
- —
Wind risk No data
- Chance of severe wind over 30 yrs
- —
Air-quality risk No data
- Unhealthy air days now
- —
- Unhealthy air days in 30 yrs
- —
Risk factors via First Street. Map © Google.
Why this score? — see what drove the C- grade
The composite is a weighted blend of 9 inputs, each scored 0–100. Each bar is that input's sub-score; the figure is the points it added to the 100-point composite (weight × sub-score).
- Cash flow +16.3/30.0
- ARV discount +15.0/15.0
- DSCR +5.0/10.0
- Schools +5.0/10.0
- Condition / age +4.8/5.0
- 1% rule +3.6/10.0
- Livability +3.4/5.0
- Rent growth +1.3/5.0
- Appreciation +0.0/10.0
$350,000
🖨 Deal sheet 📄 Offer letter ✓ Due diligence
Listing remarks MLS
The Diamond home shines with originality! The exterior of the home serves to be just as beautiful as the interior with its unique designs and beautiful columns structuring the home. The large front porch of the Diamond plan is perfect for relaxing and coffee-sipping. This two-story home is a flexible, open-concept floor plan boasting four bedrooms with two and a half full bathrooms for your convenience. Upon entry, you're greeted by the spacious family room combined with the formal dining area. This layout is perfect for entertaining your family and friends. Overlooking the dining area is the integrated kitchen and breakfast area, making this an ideal space for a family of any size! The kitchen comes equipped with a beautiful kitchen island and counters with granite countertops, designer light fixtures, industry-leading appliances, and a sizable walk-in pantry! With this conducive layout, you can remain part of the conversation, and never miss out on any fun with your visitors! Adjacent to the breakfast area is the convenient downstairs powder room and an extra closet for added storage space. Next to the breakfast area lies your large walk-in utility with your master bedroom just across the room. Retreat to your master bedroom to be met with your master bathroom including cultured marble countertops with double vanities, an elegant super shower, and a huge walk-in closet. With the Diamond floor plan, you have the option to relax in your backyard with an optional covered. ..
Key facts
- Upgraded countertops
- Slow close cabinets
- Open lay out
Tags
Neighborhood map
What this means for you Summary
Snapshot
- This is a 4-bed/2.5-bath single-family listed at $350k. Condition is rated excellent.
Deal economics
- At list price, monthly cash flow is $192 ($2k/yr) — positive.
- The deal already cash-flows at list — no discount required.
- To meet the 1% rule (rent ≥ 1% of price), the offer needs to be $302k (13.7% below list).
- Recommended offer: $302k (13.7% below list) — sets the bar for 1% rule.
- Cap rate 7.0% vs local median 2.8% in Celina — top-decile yield for the area; either an underpriced asset or a hidden risk that comps aren't pricing in. Stress-test before assuming the spread holds.
Location & tenants
- Location reads 68/100 on livability (#450 in TX) — a middle-class / working-renter tenant base. Strengths: employment A+, housing A+, schools A; Watch: cost of living C-, amenities F, commute F.
- Celina ISD (rural): math 50% / reading 61% proficiency, ranked #71 of 826 in TX (top 9%) — acceptable for families but not a draw, mixed tenant base, ~2y average lease.
- Market conditions: Rents falling (-4.6%/yr); 2895 active listings in the ZIP; 6 comparable units currently listed for rent nearby; rentals lingering (median 44d on market — plan ~5-8 weeks vacancy on turnover, expect pricing pressure); 50% of comp listings sitting > 30 days — soft ceiling on asking rent; high-income renter base; 19,194 units permitted in Collin County in 2024 (3,988 in 5+ unit buildings).
Forward outlook
- Local home prices are declining (-3.0%/yr); year-one equity from $2k of loan paydown is wiped out by about $10k of value loss. Plan a longer hold.
- Collin County population projected at +60% by 2050 — long-run rental-demand tailwind backs the buy-and-hold thesis.
Negotiation context
- It's been on market 121 days — a 12% lower offer ($308k) is reasonable based on typical stale-listing flexibility.
- 2 sale attempts; this cycle's ask has dropped $45k (11%) from the opening price — seller is motivated, your offer sets the floor, not the list.
Questions for the listing agent
- It's been on market 121 days. Have you received any prior offers? Is the seller open to a 14% concession, seller financing, or rate buy-down credit?
- What does the HOA fee cover, when was the last increase, and are there any pending special assessments or reserve-fund shortfalls?
- Why hasn't it sold? Are there any deal-killer items the seller is aware of (foundation, flood, title, zoning, code violations)?
- Is there a deadline driving the sale (1031 exchange, divorce, estate, relocation)? That informs how much negotiation room exists.
- Schools are A-rated — typically a magnet for longer-tenancy family renters. What's the average tenant stay here, and is there a school-zone premium baked into asking?
- What's the average days-on-market for RENTAL listings here right now (not sales)? A rising rental-DOM trend means longer vacancies and softer asking-rent achievability than the comps imply.
- What's the recent tenant-quality profile in this submarket — average credit score on applications, eviction rate, late-payment / NSF rate, and stable-employment percentage? A property-management company in the area should have these aggregated.
- How much new for-sale + rental construction is in the pipeline within 1–3 miles? Heavy new supply typically softens prices + rents 12–24 months out; constrained supply supports both.
Investment metrics
- 1% rule
- 0.86% ✗
- Cap rate
- 6.95%
- Cash-on-cash
- 2.35%
- DSCR
- 1.10
- GRM
- 9.7
CMA / ARV
- ARV (median comp)
- $426,797
- List price
- $350,000
- Delta
- -17.99%
- Verdict
- UNDERPRICED
- Comps
- 20 within 1.0 mi
Show comp detail 12 sales within ~0.75 mi
| Address | Dist | Beds/Ba | Sqft | Sold | Price | $/sf | Match |
|---|---|---|---|---|---|---|---|
| 1436 Bramante | 0.08mi | 4/3.0 | 2,193 (-2%) | 1mo | $399,950 | $182 | 90 |
| 1425 Marcella Ln | 0.05mi | 4/2.5 | 2,144 (-4%) | 1mo | $350,000 | $163 | 90 |
| 1428 Florence Ln | 0.12mi | 4/3.0 | 2,196 (-2%) | 1mo | $404,950 | $184 | 88 |
| 1409 Bramante St | 0.08mi | 4/2.5 | 2,144 (-4%) | 1mo | $349,990 | $163 | 88 |
| 1424 Florence Ln | 0.12mi | 4/3.0 | 2,330 (+4%) | 1mo | $414,970 | $178 | 85 |
| 1501 Buchanan Way | 0.27mi | 4/3.0 | 2,229 (-0%) | 2mo | $365,999 | $164 | 83 |
| 1737 Sugar Maple Mews | 0.44mi | 3/2.5 (-1) | 2,231 (-0%) | 1mo | $417,635 | $187 | 73 |
| 1413 Buchanan Way | 0.26mi | 4/2.0 | 1,924 (-14%) | 1mo | $336,999 | $175 | 62 |
| 2401 Greenbelt Rd | 0.61mi | 4/2.0 | 2,083 (-7%) | 1mo | $352,999 | $169 | 57 |
| 2417 Lost Creek Ln | 0.67mi | 4/2.0 | 2,083 (-7%) | 2mo | $329,399 | $158 | 53 |
| 1512 Canter St | 0.58mi | 4/3.5 | 2,501 (+12%) | 1mo | $499,000 | $200 | 49 |
| 2409 Greenbelt Rd | 0.63mi | 4/2.0 | 1,924 (-14%) | 2mo | $324,999 | $169 | 44 |
Match score weights: distance 35% · size 25% · config 20% · recency 20%. Top-matched comps best support the ARV.
Projected returns pro-forma
-3.0% appreciation · 0.0% rent growth · sell at horizon
- IRR
- -15.7%
- Equity multiple
- 0.45×
- Total profit
- $-53,449
- Equity at exit
- $52,186
- IRR
- -13.0%
- Equity multiple
- 0.33×
- Total profit
- $-65,409
- Equity at exit
- $30,262
Cash invested: $98,000 (down + closing). Projections, not guarantees.
Landlord ↔ Tenant lean methodology
- Overall (STATE)
- 87 Strongly Landlord-Friendly
- State Texas
- 87 Strongly Landlord-Friendly · R+5
- County
- — inherits STATE
- City
- — inherits STATE
ZIP-level market 75009
- Home prices YoY
- -23.1%
- Rents YoY
- -4.6%
- Active inventory
- 2895
- Price-to-rent
- 9.7×
Monthly cashflow live
- Estimated rent
- $3,021 high interval (Pro) →
- Mortgage (P&I)
- −$1,835
- Tax from tax record
- −$143 /mo · $1,713/yr
- Insurance
- −$146
- HOA
- −$71
- Vacancy / Maint / Mgmt
- −$634
- Net cashflow
- $192
Break-even live
UW: 25.0% down · 7.5% · 30yr · 1.5% tax · 5.0% vac · 8.0% maint · 8.0% mgmt
Financing live
Cash to close
- Down payment
- $87,500
- Closing costs
- $10,500
- Reserves months
- —
- Total cash needed
- —
Loan-product check · same deal, 3 products live
Conventional
25% down · 7.5% · 30yr
- Down + closing
- —
- Monthly P&I
- —
- Monthly cashflow
- —
- DSCR
- —
- Eligible?
- —
Personal DTI + credit; lowest rate.
DSCR
20% down · 8.5% · 30yr
- Down + closing
- —
- Monthly P&I
- —
- Monthly cashflow
- —
- DSCR
- —
- Eligible?
- —
No personal income docs; deal must DSCR.
Hard money
10% down · 12.0% · 12mo
- Down + closing
- —
- Monthly P&I
- —
- Monthly cashflow
- —
- DSCR
- —
- Eligible?
- —
Short-term bridge; refi at stabilization.
Rent comps 6 comps
| Address | Beds | Baths | Sqft | Rent | $/sqft | DOM | Units | Dist |
|---|---|---|---|---|---|---|---|---|
| 1424 Bettolo Dr Celina, TX | 4.0 | 3.5 | 2706 | $3,450 | $1.27 | 7d | 1 | 0.21mi |
| 2212 W J Fred Smith Pkwy Celina, TX | 3.0 | 2.0 | 1594 | $3,500 | $2.20 | 1d | 1 | 0.28mi |
| 1712 Goodnight Trl Celina, TX | 3.0 | 2.5 | 2231 | $2,800 | $1.26 | 20d | 1 | 0.48mi |
| 3100 Arthurdale St Celina, TX | 4.0 | 2.0 | 2184 | $2,399 | $1.10 | 43d | 1 | 1.22mi |
| 2020 Beeflower St Celina, TX | 3.0 | 2.0 | 2032 | $2,399 | $1.18 | 43d | 1 | 1.29mi |
| 401 Osprey Ln Celina, TX | 3.0 | 2.5 | 2833 | $3,150 | $1.11 | 43d | 1 | 1.45mi |
HOA detail
- Monthly dues
- $71 · $852/yr
Listing history 15 events
-
2026-06-18days on market $350,000 Active 121 DOM
-
2026-06-17days on market $350,000 Active 120 DOM
-
2026-06-16days on market $350,000 Active 119 DOM
-
2026-06-15days on market $350,000 Active 118 DOM
-
2026-06-13days on market $350,000 Active 116 DOM
-
2026-06-09days on market $350,000 Active 112 DOM
-
2026-06-08days on market $350,000 Active 111 DOM
-
2026-06-07days on market $350,000 Active 110 DOM
-
2026-06-04days on market $350,000 Active 107 DOM
-
2026-06-03days on market $350,000 Active 106 DOM
-
2026-06-02days on market $350,000 Active 105 DOM
-
2026-06-01days on market $350,000 Active 104 DOM
-
2026-05-31days on market $350,000 Active 103 DOM
-
2026-02-17$394,565 Active 1498-char remark
Show marketing remark (221 chars)
s and 2.5 bathrooms, open lay out downstairs and game room upstairs. With vinyl plank flooring on the main floor, upgraded countertops and slow close cabinets this home is a cant miss property located on an interior lot.
-
2026-02-17$394,565 Active 221-char remark
Show marketing remark (221 chars)
s and 2.5 bathrooms, open lay out downstairs and game room upstairs. With vinyl plank flooring on the main floor, upgraded countertops and slow close cabinets this home is a cant miss property located on an interior lot.
ⓘ Source: listings_history table (triggers on properties + properties_extension) + one-shot
backfill from property_details.listing_events for pre-trigger history.
Tax reassessment forecast TX · Resets to sale price
- Current annual tax
- $1,713 · $143/mo
- Projected year-2 tax
- $6,405 · $534/mo
- Expected delta
- +$4,692/yr (+$391/mo · 273.8%)
ⓘ Screening estimate from a state-policy table — verify with the county assessor before closing.
Nearby sold comps map
Loading sold comps map…
Walkable amenities ~0.75 mi
Loading nearby amenities…
Taxation est. · year 1
- Rental income
- $36,255
- − Mortgage interest
- −$19,605
- − Property taxes
- −$1,713
- − Insurance
- −$1,750
- − Repairs & maintenance
- −$2,900
- − Management
- −$2,900
- − HOA
- −$852
- − Depreciation
- −$10,182
- Taxable loss
- −$3,648
- Est. tax savings @ 24.0%
- +$876
- After-tax cash flow
- $3,176/yr
For passive investors: Depreciation is non-cash, so a rental often shows a tax loss while cash-flowing — sheltering income. Rental losses are passive: they offset passive income freely, and up to $25,000/yr can offset ordinary (W-2) income if you actively participate and your MAGI is under $100k (phasing out to $0 by $150k); unused losses carry forward. On sale, claimed depreciation is recaptured at up to 25%, and gains may owe capital-gains tax (a 1031 exchange can defer both). Figures are a year-1 estimate at your 24.0% rate — not tax advice; consult a CPA.
Condition & rehab AI · 12 photos
This home is in excellent condition with no visible repairs needed. It's move-in ready and would benefit from minor updates to enhance its curb appeal and modernize the interior.
Value-add opportunities
- Resale Paint interior walls — Fresh paint can enhance the home's curb appeal and make it more inviting
- Rental Replace blinds with curtains — Curtains can add a touch of warmth and style to the space
- Both Install a smart thermostat — Improves energy efficiency and adds a modern touch
Renovation cost estimate screening
Value-add ROI direction
- Resale Paint interior walls — Fresh paint can enhance the home's curb appeal and make it more inviting ↑
- Rental Replace blinds with curtains — Curtains can add a touch of warmth and style to the space ↑
- Both Install a smart thermostat — Improves energy efficiency and adds a modern touch ↑
ⓘ Cost ranges are severity-bucket heuristics (US national rule-of-thumb). Get contractor quotes + a written scope before underwriting a rehab budget.
Schools (NCES district)
- District
- Celina ISD
- NCES district ID
- 4813290
- Math proficiency
- 50% ▼ -15.00%
- Reading proficiency
- 61% ▼ -5.00%
- Median HH income
- $83,282
- Composite
- 50.49/100
- National rank
- #1853
- State rank
- #71 of 826 in TX
Livability — Celina
- Score
- 68/100
- State rank
- #450
- US rank
- #9135
Category grades
Schools grade is shown separately in the Schools card above.
Census & demographics
- Census place
- Celina, TX
- County
- Collin County · 1,159,394 people
- City population
- 34,260
- Metro
- Dallas-Fort Worth-Arlington, TX
- Population (ZIP)
- 34,260
- Household income
- $168,250
- Rent vs Own
- Severe rent burden
- 152.0
Population outlook (Collin County) Hauer SSP2
- Today (2025)
- 1,210,074 people
- By 2030
- 1,358,201 · +12.2%
- By 2040
- 1,654,061 · +36.7%
- By 2050
- 1,937,359 · +60.1%
- By 2075
- 2,567,039 · +112.1%
- By 2100
- 2,952,048 · +144.0%
Race, ethnicity, and origin ACS 2023
- Neighborhood character
- Diverse neighborhood (Simpson 0.56)
- Race & ethnicity
- White 64% Two or more races 11% Hispanic / Latino 11% Asian 11% Black 8%
- Hispanic origin (detail)
- Mexican 9%
- Common ancestry
- Slovak 5% Lithuanian 4% Romanian 1%
- Foreign-born
- 14% · China, Canada, Vietnam
- Languages at home
- 83% English-only · Spanish 6% Chinese 3% Other Asian/Pacific 3%
Political lean MEDSL · Collin
- 2024 margin
- R (+11.1) · D 43.1% · R 54.3% · Other 2.6%
- 2008→2024 swing
- +14.4pp toward D · 2008: -25.6pp · 2024: -11.1pp
- All cycles
- 2024: R+11.1 2020: R+4.3 2016: R+17.0 2012: R+31.6 2008: R+25.6
Not yet ingested
- Civics
- —
Market trends
- HPI YoY
- ▼ -83.07%
- Current HPI
- 276.6307
- Rent YoY
- ▼ -4.62%
- Metro
- Dallas-Fort Worth-Arlington, TX
- State GDP YoY
- ▲ 3.95%
- F500 in state
- 110
Industry mix (Fortune 500 HQ in TX)
| Industry | F500 HQs | Revenue |
|---|---|---|
| Energy | 16 | $1,198B |
|
||
| Technology | 5 | $198B |
|
||
| Engineering / Construction | 4 | $72B |
|
||
| Energy Services | 3 | $60B |
|
||
| Utilities | 3 | $41B |
|
||
| Healthcare | 2 | $330B |
|
||
Price history
+0.0% since first listed2 events — show timeline
- 2026-02-17 Listed $394,565 Zillow
- 2026-02-17 Listed $394,565 NTREIS
Property tax history
+15.3%/yrLatest (2025): $1,713 · +15.3% YoY. Source: county tax records.
Cash-flow waterfall
monthlySold comps — $/sqft
last 12 mo · ≤1 miLoading sold comps…