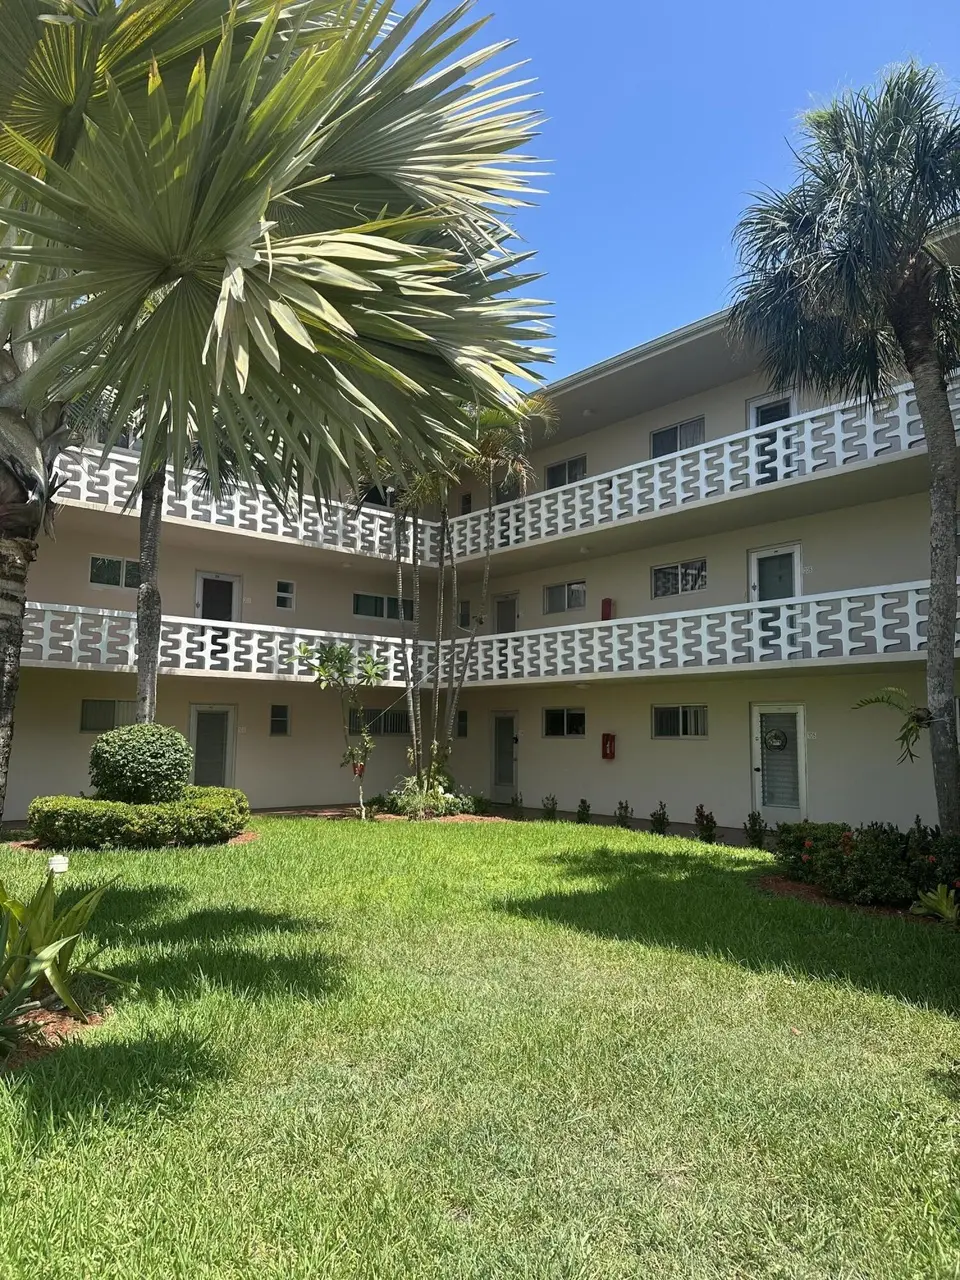
2812 S Garden Dr S #304 · Palm Springs, FL
Flood risk 1/10 · Minimal
- FEMA flood zone
- X (unshaded)
- Chance of flooding over 30 yrs
- 0.0%
- Est. flood insurance / yr
- $507 – $1,088
Fire risk 1/10 · Minimal
- Est. fire insurance / yr
- $947 – $1,759
Heat risk 10/10 · Severe
- Hot days now (above 105°F)
- 7 days/yr
- Hot days in 30 yrs
- 26 days/yr
Wind risk 10/10 · Severe
- Chance of severe wind over 30 yrs
- 99.0%
Air-quality risk 2/10 · Minimal
- Unhealthy air days now
- 0 days/yr
- Unhealthy air days in 30 yrs
- 2 days/yr
Risk factors via First Street. Map © Google.
Why this score? — see what drove the B- grade
The composite is a weighted blend of 9 inputs, each scored 0–100. Each bar is that input's sub-score; the figure is the points it added to the 100-point composite (weight × sub-score).
- Cash flow +29.8/30.0
- 1% rule +10.0/10.0
- DSCR +10.0/10.0
- ARV discount +7.5/15.0
- Schools +4.3/10.0
- Livability +3.7/5.0
- Condition / age +2.5/5.0
- Rent growth +1.9/5.0
- Appreciation +0.0/10.0
$80,000
🖨 Deal sheet (PDF) 📄 Offer letter ✓ Due diligence
Listing remarks
Beautiful corner unit located in a well-maintained 55+ community. This spacious condo features elegant porcelain tile flooring throughout and tastefully updated bathrooms. Newer AC and Water heater. Conveniently situated near shopping, restaurants, and banks—and best of all, just minutes from the beach! Enjoy comfort, style, and the perfect coastal lifestyle in this lovely home. Buyer must have 700 credit score and 50k in buyers (bank account, IRA, property)after closing income of at least $2K a month, if financed 20% down.
Key facts
- Newer ac
- Updated bathrooms
- Newer water heater
Tags
Property features AI
Finance
- Financial info: Pets allowed (breed, number and size restrictions may apply); Senior community
- HOA & community: Has association; Monthly HOA fee; Association amenities: Elevator(s), Fitness center, Laundry, Pool, Community room, Courtesy bus; HOA fee includes cable TV, grounds maintenance, pest control, trash, water, common areas, elevator
Exterior
- Parking: Assigned parking (1 space); No carport
- Security: Smoke detector(s)
- Utilities: Public water; Public sewer; Three-phase electric; Cable available
- Home design: Condominium; Resale condition; Faces east; 3-story building
- Construction: CBS construction; Other roof
- Exterior features: Corner lot; Zero lot line; Not waterfront
Interior
- Kitchen: Electric range; Refrigerator
- Bedrooms: 2 bedrooms on main level
- Flooring: Ceramic tile
- Bathrooms: 2 full bathrooms
- Heating & cooling: Central electric heating; Central air conditioning (electric)
- Interior features: Accessible elevator installed; Smoke detector(s)
- Laundry & utility: Laundry available in the building
Neighborhood map
What this means for you Summary
Snapshot
- This is a 2-bed/2.0-bath condo listed at $80k.
Deal economics
- At list price, monthly cash flow is $292 ($4k/yr) — positive.
- The deal already cash-flows at list — no discount required.
- Meets the 1% rule at list price ($2k rent vs $80k).
- Recommended offer: $75k (6.0% below list) — sets the bar for market timing.
Location & tenants
- Location reads 73/100 on livability (#297 in FL) — a middle-class / working-renter tenant base. Strengths: cost of living A+, housing A+, health & safety A; Watch: employment D+, amenities F, commute F.
- Palm Beach (suburban): math 46% / reading 53% proficiency, ranked #34 of 73 in FL (top 47%) — families likely to look elsewhere, expect single-tenant / working-renter base with shorter leases.
- Zoned schools: Meadow Park Elementary School (math 64% / reading 73%, grade B+, #409 of 2,144 statewide, top 20%, 809 students, 65% FRL); Conniston Middle School (math 35% / reading 38%, grade F, #405 of 571 statewide, top 72%, 1,075 students, 74% FRL); Forest Hill Community High School (math 20% / reading 41%, grade F, #434 of 667 statewide, top 66%, 2,407 students, 66% FRL) — zoned schools average 68% FRL vs 52% district-wide (16 pts higher); higher-poverty schools than district average — tighter screening recommended.
- Market conditions: Rents soft (-2.5%/yr); 276 active listings in the ZIP; 40 comparable units currently listed for rent nearby; rentals at typical pace (median 26d on market — plan ~3-4 weeks tenant-placement turnaround); 3,974 units permitted in Palm Beach County in 2024 (1,012 in 5+ unit buildings).
- This rent runs 38% of the median local income ($62k/yr) — at the standard rent-burdened threshold; future hikes will face affordability resistance.
Forward outlook
- Local home prices are declining (-3.0%/yr); year-one equity from $553 of loan paydown is wiped out by about $2k of value loss. Plan a longer hold.
- Palm Beach County population projected at +30% by 2050 — long-run rental-demand tailwind backs the buy-and-hold thesis.
Negotiation context
- It's been on market 82 days — a 6% lower offer ($75k) is reasonable based on typical stale-listing flexibility.
- 4 sale attempts since 24y ago; this cycle's ask has dropped $10k (11%) from the opening price — seller is motivated, your offer sets the floor, not the list.
- Current owner paid $45k; list at $80k implies a 78% gain — meaningful room to come down on a strong offer.
Risks & watch-outs
- Watch-outs: HOA is 39% of rent.
- Climate carrying-cost: severe wind risk, 99% chance of damaging wind over 30y; extreme-heat days projected 7→26/yr by 2055 (HVAC capex compounding) — expect insurance premiums to compound above CPI over the hold.
Questions for the listing agent
- It's been on market 82 days. Have you received any prior offers? Is the seller open to a 6% concession, seller financing, or rate buy-down credit?
- Built in 1970 — when were the roof, HVAC, electrical panel, plumbing, and water heater last replaced?
- What does the HOA fee cover, when was the last increase, and are there any pending special assessments or reserve-fund shortfalls?
- Any open or pending special assessments — roof, HVAC, plumbing, elevator, façade? What's the per-unit balance and payoff schedule, and is the seller paying it off at close or rolling it to the buyer?
- Why hasn't it sold? Are there any deal-killer items the seller is aware of (foundation, flood, title, zoning, code violations)?
- Is there a deadline driving the sale (1031 exchange, divorce, estate, relocation)? That informs how much negotiation room exists.
- Schools are D-rated, which usually means shorter tenancies and higher turnover. Who's the typical renter profile here, and what's been the actual vacancy rate?
- What's the average days-on-market for RENTAL listings here right now (not sales)? A rising rental-DOM trend means longer vacancies and softer asking-rent achievability than the comps imply.
- What's the recent tenant-quality profile in this submarket — average credit score on applications, eviction rate, late-payment / NSF rate, and stable-employment percentage? A property-management company in the area should have these aggregated.
- How much new apartment / multifamily construction is in the pipeline within 1–3 miles? Heavy new supply (>2% of stock underway) typically softens rents 12–24 months out; light construction supports rent growth.
Investment metrics
- 1% rule
- 2.48% ✓
- Cap rate
- 10.68%
- Cash-on-cash
- 15.67%
- DSCR
- 1.70
- GRM
- 3.4
CMA / ARV
No comps found within radius.
Projected returns pro-forma
-3.0% appreciation · 0.0% rent growth · sell at horizon
- IRR
- 0.4%
- Equity multiple
- 1.01×
- Total profit
- $329
- Equity at exit
- $11,928
- IRR
- 3.1%
- Equity multiple
- 1.17×
- Total profit
- $3,750
- Equity at exit
- $6,917
Cash invested: $22,400 (down + closing). Projections, not guarantees.
Landlord ↔ Tenant lean methodology
- Overall (STATE)
- 87 Strongly Landlord-Friendly
- State Florida
- 87 Strongly Landlord-Friendly · R+3
- County
- — inherits STATE
- City
- — inherits STATE
ZIP-level market 33461
- Rents YoY
- -2.5%
- Active inventory
- 276
- Price-to-rent
- 3.4×
Monthly cashflow live
- Estimated rent
- $1,981 high interval (Pro) →
- Mortgage (P&I)
- −$420
- Tax from tax record
- −$38 /mo · $456/yr
- Insurance
- −$33
- HOA
- −$782
- Vacancy / Maint / Mgmt
- −$416
- Net cashflow
- $292
Break-even live
Sensitivity live
| Price | -10% $338 | -5% $315 | +0% $292 | +5% $270 | +10% $247 |
|---|---|---|---|---|---|
| Rent | -10% $136 | -5% $214 | +0% $292 | +5% $371 | +10% $449 |
| Rate | -1.0pp $333 | -0.5pp $313 | base $292 | +0.5pp $272 | +1.0pp $251 |
UW: 25.0% down · 7.5% · 30yr · 1.5% tax · 5.0% vac · 8.0% maint · 8.0% mgmt
Financing live
Cash to close
- Down payment
- $20,000
- Closing costs
- $2,400
- Reserves months
- —
- Total cash needed
- —
Loan-product check · same deal, 3 products live
Conventional
25% down · 7.5% · 30yr
- Down + closing
- —
- Monthly P&I
- —
- Monthly cashflow
- —
- DSCR
- —
- Eligible?
- —
Personal DTI + credit; lowest rate.
DSCR
20% down · 8.5% · 30yr
- Down + closing
- —
- Monthly P&I
- —
- Monthly cashflow
- —
- DSCR
- —
- Eligible?
- —
No personal income docs; deal must DSCR.
Hard money
10% down · 12.0% · 12mo
- Down + closing
- —
- Monthly P&I
- —
- Monthly cashflow
- —
- DSCR
- —
- Eligible?
- —
Short-term bridge; refi at stabilization.
Rent comps 40 comps
| Address | Beds | Baths | Sqft | Rent | $/sqft | DOM | Units | Dist |
|---|---|---|---|---|---|---|---|---|
| 2724 Garden Dr S #207 Lake Worth, FL | 1.0 | 1.0 | 744 | $1,850 | $2.49 | 0d | 1 | 0.06mi |
| 2856 Garden Dr S #112 Lake Worth, FL | 2.0 | 1.0 | 894 | $1,800 | $2.01 | 25d | 1 | 0.08mi |
| 2668 Garden Dr N #312 Lake Worth, FL | 2.0 | 2.0 | 1080 | $1,500 | $1.39 | 3d | 1 | 0.20mi |
| 2668 Garden Dr N #312 Lake Worth, FL | 2.0 | 2.0 | 1080 | $1,500 | $1.39 | 5d | 1 | 0.20mi |
| 2566 Garden Dr S Lake Worth Beach, FL | 1.0 | 1.0 | 744 | $1,395 | $1.88 | 25d | 1 | 0.22mi |
| 2721 Garden Dr N #105 Lake Worth, FL | 2.0 | 1.0 | 894 | $1,800 | $2.01 | 22d | 1 | 0.24mi |
| 2901 10th Ave N Palm Springs, FL | 2.0 | 1.0 | 900 | $1,795 | $1.99 | 25d | 1 | 0.28mi |
| 2581 Garden Dr N #203 Lake Worth, FL | 2.0 | 2.0 | 894 | $1,650 | $1.85 | 16d | 1 | 0.31mi |
| 2581 Garden Dr N #203 Lake Worth, FL | 2.0 | 2.0 | 894 | $1,650 | $1.85 | 9d | 1 | 0.31mi |
| 910 Rudolf Rd Lake Worth, FL | 3.0 | 1.0 | 1000 | $2,500 | $2.50 | 25d | 1 | 0.31mi |
| 2791 S Florida Mango Rd Lake Worth, FL | 2.0 | 2.0 | 1100 | $1,995 | $1.81 | 22d | 1 | 0.33mi |
| 230 Lake Arbor Dr Palm Springs, FL | 2.0 | 2.0 | 1232 | $2,200 | $1.79 | 25d | 1 | 0.33mi |
| 100 Rex Ave Palm Springs, FL | 2.0 | 2.0 | 1000 | $1,850 | $1.85 | 25d | 3 | 0.34mi |
| 331 Lake Arbor Dr Palm Springs, FL | 2.0 | 2.0 | 1232 | $2,300 | $1.87 | 25d | 1 | 0.36mi |
| 21 Lake Arbor Dr Palm Springs, FL | 2.0 | 2.5 | 1232 | $2,500 | $2.03 | 20d | 1 | 0.39mi |
| 2508 10th Ave N Lake Worth Beach, FL | 2.0 | 1.0 | 800 | $1,746 | $2.18 | 15d | 1 | 0.39mi |
| 2508 10th Ave N Lake Worth Beach, FL | 2.0 | 1.0 | 800 | $1,672 | $2.09 | 12d | 1 | 0.39mi |
| 2508 10th Ave N Lake Worth Beach, FL | 3.0 | 2.0 | 1025 | $2,557 | $2.49 | 25d | 1 | 0.39mi |
| 3386 Rudolph Rd Lake Worth Beach, FL | 2.0 | 1.0 | 840 | $2,100 | $2.50 | 4d | 1 | 0.39mi |
| 220 Henthorne Dr Palm Springs, FL | 1.0–2.0 | 1.5–2.0 | 900 | $1,850 | $2.06 | 25d | 4 | 0.42mi |
| 2428 Waterside Dr Unit 2428 Lake Worth Beach, FL | 2.0 | 2.5 | 1400 | $2,250 | $1.61 | 25d | 1 | 0.44mi |
| 2391 Waterside Dr Unit 22d Lake Worth, FL | 2.0 | 3.0 | 1328 | $2,600 | $1.96 | 25d | 1 | 0.45mi |
| 124 Abaco Dr Palm Springs, FL | 3.0 | 2.0 | 988 | $2,900 | $2.94 | 16d | 1 | 0.47mi |
| 3440 Rudolph Rd Unit 3440-03 Lake Worth Beach, FL | 2.0 | 2.0 | 935 | $2,100 | $2.25 | 20d | 1 | 0.47mi |
| 3431 Helena Dr Unit 3481-11 Lake Worth Beach, FL | 2.0 | 2.0 | 935 | $2,050 | $2.19 | 25d | 1 | 0.49mi |
| 3431 Helena Dr Lake Worth, FL | 2.0 | 2.0 | 935 | $2,075 | $2.22 | 15d | 2 | 0.49mi |
| 3481 Helena Dr Unit 11 Lake Worth Beach, FL | 2.0 | 2.0 | 935 | $2,050 | $2.19 | 25d | 1 | 0.50mi |
| 1065 Manor Dr Palm Springs, FL | 2.0 | 2.0 | 1098 | $2,100 | $1.91 | 4d | 1 | 0.54mi |
| 965 Manor Dr Palm Springs, FL | 2.0 | 1.0 | 687 | $1,995 | $2.90 | 2d | 5 | 0.54mi |
| 3031 French Ave Lake Worth, FL | 3.0 | 1.0 | 840 | $2,400 | $2.86 | 9d | 1 | 0.55mi |
| 1020 Manor Dr Palm Springs, FL | 2.0 | 2.0 | 1098 | $2,200 | $2.00 | 23d | 1 | 0.59mi |
| 3017 Buckley Ave Lake Worth, FL | 2.0 | 1.0 | 720 | $2,200 | $3.06 | 25d | 1 | 0.60mi |
| 1016 Manor Dr Unit 5c Palm Springs, FL | 2.0 | 2.0 | 1098 | $2,256 | $2.05 | 25d | 1 | 0.61mi |
| 3300 Boutwell Rd Lake Worth Beach, FL | 1.0–2.0 | 1.0–2.0 | 765 | $2,720 | $3.56 | 25d | 1 | 0.66mi |
| 1802 Waterview Cir #1802 Palm Springs, FL | 2.0 | 2.0 | 951 | $1,925 | $2.02 | 25d | 1 | 0.75mi |
| 6003 Waterview Cir Palm Springs, FL | 3.0 | 2.5 | 1500 | $2,550 | $1.70 | 25d | 1 | 0.84mi |
| 246 Cypress Ln Lake Worth Beach, FL | 1.0–2.0 | 1.0 | 850 | $1,750 | $2.06 | 25d | 2 | 0.95mi |
| 120 Williams Ct Palm Springs, FL | 3.0 | 2.5 | 1498 | $2,400 | $1.60 | 18d | 1 | 0.96mi |
| 247 Cypress Ln Unit 246-C12 Palm Springs, FL | 2.0 | 1.0 | 850 | $1,750 | $2.06 | 6d | 1 | 0.96mi |
| 247 Cypress Ln Unit 246-C06 Palm Springs, FL | 2.0 | 1.0 | 850 | $1,750 | $2.06 | 25d | 1 | 0.96mi |
HOA detail condo
- Monthly dues
- $782 · $9,384/yr
- Likely covers
- water
- Assessments
- None detected in remarks — confirm with the listing agent.
Listing history 26 events
-
2026-06-21days on market $80,000 Active 82 DOM
-
2026-06-18days on market $80,000 Active 79 DOM
-
2026-06-17days on market $80,000 Active 78 DOM
-
2026-06-16days on market $80,000 Active 77 DOM
-
2026-06-15days on market $80,000 Active 76 DOM
-
2026-06-13days on market $80,000 Active 74 DOM
-
2026-06-09days on market $80,000 Active 70 DOM
-
2026-06-08days on market $80,000 Active 69 DOM
-
2026-06-07days on market $80,000 Active 68 DOM
-
2026-06-04days on market $80,000 Active 65 DOM
-
2026-06-03days on market $80,000 Active 64 DOM
-
2026-06-02days on market $80,000 Active 63 DOM
-
2026-06-01days on market $80,000 Active 62 DOM
-
2026-05-31days on market $80,000 Active 61 DOM
-
2026-05-07price $80,000
-
2026-03-31$90,000 Active
-
2026-02-10historical
-
2025-10-03$91,000 Active
-
2024-12-31historical
-
2024-06-18price $120,000
-
2024-06-15$119,000 Active
-
2002-12-07soldstatus $45,000
-
2002-11-19soldstatus $45,000
-
2002-10-17historical
-
2002-04-08$49,900
-
1985-12-01soldstatus $55,000
ⓘ Source: listings_history table (triggers on properties + properties_extension) + one-shot
backfill from property_details.listing_events for pre-trigger history.
Tax reassessment forecast FL · Resets to sale price
- Current annual tax
- $456 · $38/mo
- Projected year-2 tax
- $664 · $55/mo
- Expected delta
- +$208/yr (+$17/mo · 45.7%)
ⓘ Screening estimate from a state-policy table — verify with the county assessor before closing.
Climate risk First Street
- Flood 1/10 Low FEMA zone X (unshaded) · 0% chance over 30 yrs
- Wildfire 1/10 Low
- Heat 10/10 Extreme 7 d/yr ≥105°F today · 26 d/yr by 30 yrs out
- Wind 10/10 Extreme 99% chance of damaging wind over 30 yrs
- Air quality 2/10 Low 0 unhealthy d/yr today · 2 by 30 yrs out
Nearby sold comps map
Loading sold comps map…
Walkable amenities ~0.75 mi
Loading nearby amenities…
Taxation est. · year 1
- Rental income
- $23,777
- − Mortgage interest
- −$4,481
- − Property taxes
- −$456
- − Insurance
- −$400
- − Repairs & maintenance
- −$1,902
- − Management
- −$1,902
- − HOA
- −$9,384
- − Depreciation
- −$2,327
- Taxable income
- $2,924
- Est. tax owed @ 24.0%
- −$702
- After-tax cash flow
- $2,808/yr
For passive investors: Depreciation is non-cash, so a rental often shows a tax loss while cash-flowing — sheltering income. Rental losses are passive: they offset passive income freely, and up to $25,000/yr can offset ordinary (W-2) income if you actively participate and your MAGI is under $100k (phasing out to $0 by $150k); unused losses carry forward. On sale, claimed depreciation is recaptured at up to 25%, and gains may owe capital-gains tax (a 1031 exchange can defer both). Figures are a year-1 estimate at your 24.0% rate — not tax advice; consult a CPA.
Schools (NCES district)
- District
- Palm Beach
- NCES district ID
- 1201500
- Math proficiency
- 46% ▼ -16.00%
- Reading proficiency
- 53% ▼ -4.00%
- Median HH income
- $53,943
- Composite
- 42.72/100
- National rank
- #3160
- State rank
- #34 of 73 in FL
Livability — Palm Springs
- Score
- 73/100
- State rank
- #297
- US rank
- #5045
Category grades
Schools grade is shown separately in the Schools card above.
Census & demographics
- County
- Palm Beach County · 1,438,312 people
- City population
- 49,443
- Metro
- Miami-Fort Lauderdale-Pompano Beach, FL
- Population (ZIP)
- 49,443
- Household income
- $61,963
- Rent vs Own
- Severe rent burden
- 2663.0
Population outlook (Palm Beach County) Hauer SSP2
- Today (2025)
- 1,637,487 people
- By 2030
- 1,743,255 · +6.5%
- By 2040
- 1,948,712 · +19.0%
- By 2050
- 2,132,979 · +30.3%
- By 2075
- 2,530,027 · +54.5%
- By 2100
- 2,706,979 · +65.3%
Race, ethnicity, and origin ACS 2023
- Neighborhood character
- Diverse neighborhood (Simpson 0.59)
- Race & ethnicity
- Hispanic / Latino 59% Two or more races 26% White 20% Black 17% Asian 2%
- Hispanic origin (detail)
- Mexican 11% Puerto Rican 6% Cuban 16% Dominican 2%
- Common ancestry
- Hispanic 9% Romanian 1% Lithuanian 1%
- Foreign-born
- 52% · Canada, Jamaica
- Languages at home
- 31% English-only · Spanish 54% French/Haitian/Cajun 10% Other Indo-European 2%
Political lean MEDSL · Palm Beach
- 2024 margin
- Toss-up / Even · D 50.0% · R 49.2%
- 2008→2024 swing
- -22.1pp toward R · 2008: 22.9pp · 2024: 0.8pp
- All cycles
- 2024: D+0.8 2020: D+12.8 2016: D+15.3 2012: D+17.0 2008: D+22.9
Not yet ingested
- Civics
- —
Market trends
- HPI YoY
- ▼ -269.03%
- Current HPI
- 493.0041
- Rent YoY
- ▼ -2.47%
- Metro
- Miami-Fort Lauderdale-Pompano Beach, FL
- State GDP YoY
- ▲ 3.28%
- F500 in state
- 36
Industry mix (Fortune 500 HQ in FL)
| Industry | F500 HQs | Revenue |
|---|---|---|
| Industrial Technology | 2 | $29B |
|
||
| Insurance | 2 | $17B |
|
||
| Retail | 1 | $60B |
|
||
| Technology Distribution | 1 | $58B |
|
||
| Homebuilding | 1 | $35B |
|
||
| Technology Manufacturing | 1 | $35B |
|
||
Price history
+45.5% since first listed12 events — show timeline
- 2026-05-07 Price Changed $80,000 Beaches MLS
- 2026-03-31 Listed $90,000 Beaches MLS
- 2026-02-10 Listing Removed — Beaches MLS
- 2025-10-03 Listed $91,000 Beaches MLS
- 2024-12-31 Listing Removed — Beaches MLS
- 2024-06-18 Price Changed $120,000 Beaches MLS
- 2024-06-15 Listed $119,000 Beaches MLS
- 2002-12-07 Sold (Public Records) $45,000 Public Records
- 2002-11-19 Sold (MLS) $45,000 Beaches MLS
- 2002-10-17 Listing Removed — Beaches MLS
- 2002-04-08 Listed $49,900 Beaches MLS
- 1985-12-01 Sold (Public Records) $55,000 Public Records
Property tax history
+1.7%/yrLatest (2025): $456 · +6.3% YoY. Source: county tax records.
Cash-flow waterfall
monthlySold comps — $/sqft
last 12 mo · ≤1 miLoading sold comps…