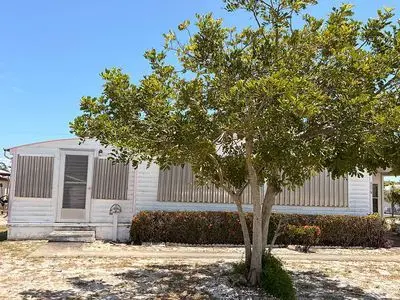
8079 SE Eagle Ave · Hobe Sound, FL
Flood risk 1/10 · Minimal
- FEMA flood zone
- X (unshaded)
- Chance of flooding over 30 yrs
- 0.0%
- Est. flood insurance / yr
- $507 – $1,088
Fire risk 3/10 · Minor
- Est. fire insurance / yr
- $947 – $1,759
Heat risk 10/10 · Severe
- Hot days now (above 106°F)
- 7 days/yr
- Hot days in 30 yrs
- 24 days/yr
Wind risk 10/10 · Severe
- Chance of severe wind over 30 yrs
- 99.0%
Air-quality risk 2/10 · Minimal
- Unhealthy air days now
- 1 days/yr
- Unhealthy air days in 30 yrs
- 1 days/yr
Risk factors via First Street. Map © Google.
Why this score? — see what drove the B+ grade
The composite is a weighted blend of 9 inputs, each scored 0–100. Each bar is that input's sub-score; the figure is the points it added to the 100-point composite (weight × sub-score).
- Cash flow +30.0/30.0
- ARV discount +15.0/15.0
- 1% rule +10.0/10.0
- DSCR +10.0/10.0
- Schools +4.5/10.0
- Livability +3.5/5.0
- Rent growth +3.0/5.0
- Condition / age +2.5/5.0
- Appreciation +0.0/10.0
$134,900
🖨 Deal sheet (PDF) 📄 Offer letter ✓ Due diligence
Listing remarks
Investor / Builder Special & acirc; & euro; & ldquo; Redevelopment Opportunity Rare opportunity for experienced investors, builders, or entrepreneurs seeking a redevelopment project in Hobe Sound. This double-wide manufactured home (962 sq ft) with two enclosed porches and an attached shed sits on a 7,362 sq ft corner lot. Located within approximately 10 miles of area beaches and near a Publix shopping center at the entrance to the Ridgeway community (constructed approx. 5 years ago). No HOA. Optional access to community amenities (clubhouse, pool, shuffleboard, etc. ) is available for a nominal annual fee. All-ages community. Property is being sold strictly as-is, where-is.
Key facts
- Attached shed
- Corner lot
- Two enclosed porches
Tags
Neighborhood map
What this means for you Summary
Snapshot
- This is a 3-bed/2.0-bath manufactured listed at $135k.
Deal economics
- At list price, monthly cash flow is $956 ($11k/yr) — positive.
- The deal already cash-flows at list — no discount required.
- Meets the 1% rule at list price ($2k rent vs $135k).
- Recommended offer: $131k (3.0% below list) — sets the bar for market timing.
- Cap rate 14.8% vs local median 3.3% in Hobe Sound — top-decile yield for the area; either an underpriced asset or a hidden risk that comps aren't pricing in. Stress-test before assuming the spread holds.
Location & tenants
- Location reads 69/100 on livability (#497 in FL) — a middle-class / working-renter tenant base. Strengths: housing A+, crime A, cost of living A; Watch: employment C-, amenities F, commute F.
- Martin (suburban): math 52% / reading 53% proficiency, ranked #24 of 73 in FL (top 33%) — acceptable for families but not a draw, mixed tenant base, ~2y average lease.
- Zoned schools: Sea Wind Elementary School (math 43% / reading 46%, grade F, #1,288 of 2,144 statewide, top 62%, 501 students, 72% FRL); Murray Middle School (math 45% / reading 43%, grade D, #327 of 571 statewide, top 57%, 616 students, 69% FRL); South Fork High School (math 36% / reading 48%, grade F, #275 of 667 statewide, top 42%, 1,810 students, 51% FRL) — zoned schools average 64% FRL vs 41% district-wide (23 pts higher); higher-poverty schools than district average — tighter screening recommended.
- Market conditions: Rents rising (+1.8%/yr); 283 active listings in the ZIP; 8 comparable units currently listed for rent nearby; rentals at typical pace (median 25d on market — plan ~3-4 weeks tenant-placement turnaround); 737 units permitted in Martin County in 2024 (167 in 5+ unit buildings).
- This rent runs 41% of the median local income ($70k/yr) — at the standard rent-burdened threshold; future hikes will face affordability resistance.
Forward outlook
- Local home prices are declining (-3.0%/yr); year-one equity from $933 of loan paydown is wiped out by about $4k of value loss. Plan a longer hold.
- Martin County population projected at +19% by 2050 — long-run rental-demand tailwind backs the buy-and-hold thesis.
- At projected returns (-3.0% appreciation + 1.8% rent growth), your $38k cash investment doubles in ~5 years — after that, you're playing with house money.
Negotiation context
- It's been on market 40 days — a 3% lower offer ($131k) is reasonable based on typical stale-listing flexibility.
Risks & watch-outs
- Climate carrying-cost: severe wind risk, 99% chance of damaging wind over 30y; extreme-heat days projected 7→24/yr by 2055 (HVAC capex compounding) — expect insurance premiums to compound above CPI over the hold.
Questions for the listing agent
- It's been on market 40 days. Have you received any prior offers? Is the seller open to a 3% concession, seller financing, or rate buy-down credit?
- Built in 1974 — when were the roof, HVAC, electrical panel, plumbing, and water heater last replaced?
- Is there a deadline driving the sale (1031 exchange, divorce, estate, relocation)? That informs how much negotiation room exists.
- What's the average days-on-market for RENTAL listings here right now (not sales)? A rising rental-DOM trend means longer vacancies and softer asking-rent achievability than the comps imply.
- What's the recent tenant-quality profile in this submarket — average credit score on applications, eviction rate, late-payment / NSF rate, and stable-employment percentage? A property-management company in the area should have these aggregated.
- How much new for-sale + rental construction is in the pipeline within 1–3 miles? Heavy new supply typically softens prices + rents 12–24 months out; constrained supply supports both.
Investment metrics
- 1% rule
- 1.79% ✓
- Cap rate
- 14.80%
- Cash-on-cash
- 30.38%
- DSCR
- 2.35
- GRM
- 4.6
CMA / ARV
- ARV (on-the-fly)
- $192,960
- Comps found
- 12
Show comp detail 12 sales within ~0.75 mi
| Address | Dist | Beds/Ba | Sqft | Sold | Price | $/sf | Match |
|---|---|---|---|---|---|---|---|
| 8217 SE Swan Ave | 0.12mi | 2/2.0 (-1) | 960 (0%) | 2mo | $196,000 | $204 | 88 |
| 6900 SE Congress St | 0.31mi | 2/2.0 (-1) | 960 (0%) | 3mo | $138,000 | $144 | 78 |
| 8001 SE Shenandoah Dr | 0.26mi | 2/2.0 (-1) | 960 (0%) | 7mo | $180,000 | $188 | 77 |
| 7878 SE Swan Ave | 0.22mi | 2/2.0 (-1) | 999 (+4%) | 2mo | $154,000 | $154 | 77 |
| 8500 SE Eagle Ave | 0.39mi | 2/2.0 (-1) | 960 (0%) | 4mo | $135,000 | $141 | 73 |
| 8301 SE Skylark Ave | 0.27mi | 2/1.0 (-1) | 1,020 (+6%) | 1mo | $213,000 | $209 | 67 |
| 7667 SE Swan Ave | 0.39mi | 2/1.0 (-1) | 920 (-4%) | 1mo | $185,000 | $201 | 65 |
| 7749 SE Eagle Ave | 0.29mi | 2/2.0 (-1) | 896 (-7%) | 8mo | $210,000 | $234 | 64 |
| 7359 SE Eagle Ave | 0.66mi | 2/2.0 (-1) | 958 (-0%) | 2mo | $220,000 | $230 | 63 |
| 7184 SE Redbird Cir | 0.32mi | 2/2.0 (-1) | 1,080 (+12%) | 2mo | $190,000 | $176 | 58 |
| 7690 SE Eagle Ave | 0.35mi | 3/1.0 | 1,056 (+10%) | 8mo | $150,000 | $142 | 56 |
| 7398 SE Swan Ave | 0.64mi | 2/2.0 (-1) | 840 (-12%) | 5mo | $208,000 | $248 | 40 |
Match score weights: distance 35% · size 25% · config 20% · recency 20%. Top-matched comps best support the ARV.
Projected returns pro-forma
-3.0% appreciation · 1.8% rent growth · sell at horizon
- IRR
- 23.7%
- Equity multiple
- 1.96×
- Total profit
- $36,213
- Equity at exit
- $20,114
- IRR
- 30.8%
- Equity multiple
- 3.61×
- Total profit
- $98,603
- Equity at exit
- $11,664
Cash invested: $37,772 (down + closing). Projections, not guarantees.
Landlord ↔ Tenant lean methodology
- Overall (STATE)
- 87 Strongly Landlord-Friendly
- State Florida
- 87 Strongly Landlord-Friendly · R+3
- County
- — inherits STATE
- City
- — inherits STATE
ZIP-level market 33455
- Rents YoY
- 1.8%
- Active inventory
- 283
- Price-to-rent
- 4.6×
Monthly cashflow live
- Estimated rent
- $2,421 high interval (Pro) →
- Mortgage (P&I)
- −$707
- Tax from tax record
- −$192 /mo · $2,309/yr
- Insurance
- −$56
- HOA
- −$0
- Vacancy / Maint / Mgmt
- −$508
- Net cashflow
- $956
Break-even live
Sensitivity live
| Price | -10% $1,033 | -5% $995 | +0% $956 | +5% $918 | +10% $880 |
|---|---|---|---|---|---|
| Rent | -10% $765 | -5% $861 | +0% $956 | +5% $1,052 | +10% $1,148 |
| Rate | -1.0pp $1,024 | -0.5pp $991 | base $956 | +0.5pp $921 | +1.0pp $886 |
UW: 25.0% down · 7.5% · 30yr · 1.5% tax · 5.0% vac · 8.0% maint · 8.0% mgmt
Financing live
Cash to close
- Down payment
- $33,725
- Closing costs
- $4,047
- Reserves months
- —
- Total cash needed
- —
Loan-product check · same deal, 3 products live
Conventional
25% down · 7.5% · 30yr
- Down + closing
- —
- Monthly P&I
- —
- Monthly cashflow
- —
- DSCR
- —
- Eligible?
- —
Personal DTI + credit; lowest rate.
DSCR
20% down · 8.5% · 30yr
- Down + closing
- —
- Monthly P&I
- —
- Monthly cashflow
- —
- DSCR
- —
- Eligible?
- —
No personal income docs; deal must DSCR.
Hard money
10% down · 12.0% · 12mo
- Down + closing
- —
- Monthly P&I
- —
- Monthly cashflow
- —
- DSCR
- —
- Eligible?
- —
Short-term bridge; refi at stabilization.
Rent comps 8 comps
| Address | Beds | Baths | Sqft | Rent | $/sqft | DOM | Units | Dist |
|---|---|---|---|---|---|---|---|---|
| 8160 SE Eagle Ave Hobe Sound, FL | 2.0 | 1.0 | 672 | $1,600 | $2.38 | 25d | 1 | 0.07mi |
| 8002 SE Skylark Ave Hobe Sound, FL | 3.0 | 2.0 | 990 | $2,000 | $2.02 | 25d | 1 | 0.09mi |
| 6948 SE Delegate St Hobe Sound, FL | 2.0 | 2.0 | 840 | $1,775 | $2.11 | 25d | 1 | 0.24mi |
| 7109 SE Ridgeway Ter Hobe Sound, FL | 2.0 | 1.0 | 624 | $1,600 | $2.56 | 23d | 1 | 0.25mi |
| 7568 SE Swan Ave Hobe Sound, FL | 2.0 | 2.0 | 1052 | $2,300 | $2.19 | 25d | 1 | 0.48mi |
| 8905 SE Sandy Ln Hobe Sound, FL | 2.0 | 2.0 | 1006 | $1,850 | $1.84 | 25d | 1 | 0.75mi |
| 8997 SE Sandy Ln Hobe Sound, FL | 2.0 | 1.0 | 900 | $2,000 | $2.22 | 25d | 1 | 0.82mi |
| 9073 SE Hobe Ridge Ave Hobe Sound, FL | 2.0 | 2.0 | 1029 | $2,100 | $2.04 | 15d | 1 | 0.90mi |
Listing history 17 events
-
2026-06-21days on market $134,900 Active 40 DOM
-
2026-06-18days on market $134,900 Active 37 DOM
-
2026-06-17days on market $134,900 Active 36 DOM
-
2026-06-16days on market $134,900 Active 35 DOM
-
2026-06-15days on market $134,900 Active 34 DOM
-
2026-06-14days on market $134,900 Active 32 DOM
-
2026-06-13days on market $134,900 Active 31 DOM
-
2026-06-10days on market $134,900 Active 29 DOM
-
2026-06-09days on market $134,900 Active 28 DOM
-
2026-06-08days on market $134,900 Active 27 DOM
-
2026-06-07days on market $134,900 Active 26 DOM
-
2026-06-03days on market $134,900 Active 22 DOM
-
2026-06-02days on market $134,900 Active 21 DOM
-
2026-06-01days on market $134,900 Active 20 DOM
-
2026-05-31days on market $134,900 Active 19 DOM
-
2026-05-31days on market $134,900 Active 18 DOM
-
2026-05-12$134,900 Active 1416-char remark
ⓘ Source: listings_history table (triggers on properties + properties_extension) + one-shot
backfill from property_details.listing_events for pre-trigger history.
Tax reassessment forecast FL · Resets to sale price
- Current annual tax
- $2,309 · $192/mo
- Projected year-2 tax
- $2,309 · $192/mo
- Expected delta
- $0/yr ($0/mo · 0.0%)
ⓘ Screening estimate from a state-policy table — verify with the county assessor before closing.
Climate risk First Street
- Flood 1/10 Low FEMA zone X (unshaded) · 0% chance over 30 yrs
- Wildfire 3/10 Moderate
- Heat 10/10 Extreme 7 d/yr ≥106°F today · 24 d/yr by 30 yrs out
- Wind 10/10 Extreme 99% chance of damaging wind over 30 yrs
- Air quality 2/10 Low 1 unhealthy d/yr today · 1 by 30 yrs out
Nearby sold comps map
Loading sold comps map…
Walkable amenities ~0.75 mi
Loading nearby amenities…
Taxation est. · year 1
- Rental income
- $29,049
- − Mortgage interest
- −$7,556
- − Property taxes
- −$2,309
- − Insurance
- −$674
- − Repairs & maintenance
- −$2,324
- − Management
- −$2,324
- − Depreciation
- −$3,924
- Taxable income
- $9,937
- Est. tax owed @ 24.0%
- −$2,385
- After-tax cash flow
- $9,091/yr
For passive investors: Depreciation is non-cash, so a rental often shows a tax loss while cash-flowing — sheltering income. Rental losses are passive: they offset passive income freely, and up to $25,000/yr can offset ordinary (W-2) income if you actively participate and your MAGI is under $100k (phasing out to $0 by $150k); unused losses carry forward. On sale, claimed depreciation is recaptured at up to 25%, and gains may owe capital-gains tax (a 1031 exchange can defer both). Figures are a year-1 estimate at your 24.0% rate — not tax advice; consult a CPA.
Schools (NCES district)
- District
- Martin
- NCES district ID
- 1201290
- Math proficiency
- 52% ▼ -14.00%
- Reading proficiency
- 53% ▼ -4.00%
- Median HH income
- $52,482
- Composite
- 45.1/100
- National rank
- #2690
- State rank
- #24 of 73 in FL
Livability — Hobe Sound
- Score
- 69/100
- State rank
- #497
- US rank
- #8763
Category grades
Schools grade is shown separately in the Schools card above.
Census & demographics
- Census place
- Hobe Sound, FL
- County
- Martin County · 165,223 people
- City population
- 20,018
- Metro
- Port St. Lucie, FL
- Population (ZIP)
- 20,018
- Household income
- $70,389
- Rent vs Own
- Severe rent burden
- 317.0
Population outlook (Martin County) Hauer SSP2
- Today (2025)
- 172,383 people
- By 2030
- 180,192 · +4.5%
- By 2040
- 194,114 · +12.6%
- By 2050
- 204,992 · +18.9%
- By 2075
- 229,641 · +33.2%
- By 2100
- 232,146 · +34.7%
Race, ethnicity, and origin ACS 2023
- Neighborhood character
- Predominantly White (84%)
- Race & ethnicity
- White 84% Hispanic / Latino 8% Two or more races 6% Black 5% Asian 1%
- Hispanic origin (detail)
- Mexican 3% Dominican 1%
- Common ancestry
- Romanian 5% Italian 2% Slovak 2%
- Foreign-born
- 8% · Canada
- Languages at home
- 91% English-only · Spanish 6% Other Indo-European 1%
Political lean MEDSL · Martin
- 2024 margin
- Solid R (+31.1) · D 34.1% · R 65.2%
- 2008→2024 swing
- -17.5pp toward R · 2008: -13.6pp · 2024: -31.1pp
- All cycles
- 2024: R+31.1 2020: R+24.6 2016: R+26.9 2012: R+22.9 2008: R+13.6
Not yet ingested
- Civics
- —
Market trends
- HPI YoY
- ▼ -287.05%
- Current HPI
- 356.7273
- Rent YoY
- ▲ 1.80%
- Metro
- Port St. Lucie, FL
- State GDP YoY
- ▲ 3.28%
- F500 in state
- 36
Industry mix (Fortune 500 HQ in FL)
| Industry | F500 HQs | Revenue |
|---|---|---|
| Industrial Technology | 2 | $29B |
|
||
| Insurance | 2 | $17B |
|
||
| Retail | 1 | $60B |
|
||
| Technology Distribution | 1 | $58B |
|
||
| Homebuilding | 1 | $35B |
|
||
| Technology Manufacturing | 1 | $35B |
|
||
Price history
1 event — show timeline
- 2026-05-12 Listed $134,900 FSBO.com
Property tax history
+15.5%/yrLatest (2025): $2,309 · +4.9% YoY. Source: county tax records.
Cash-flow waterfall
monthlySold comps — $/sqft
last 12 mo · ≤1 miLoading sold comps…