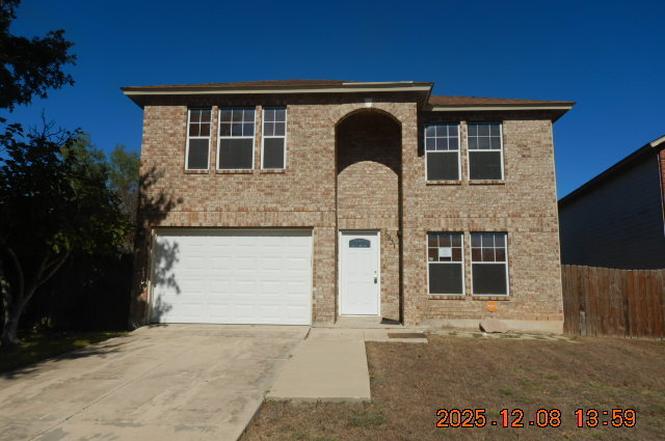
8931 Dakota Run · Converse, TX
Flood risk 1/10 · Minimal
- FEMA flood zone
- X (unshaded)
- Chance of flooding over 30 yrs
- 0.0%
- Est. flood insurance / yr
- $507 – $1,088
Fire risk 5/10 · Moderate
- Est. fire insurance / yr
- $1,222 – $2,270
Heat risk 8/10 · Major
- Hot days now (above 108°F)
- 7 days/yr
- Hot days in 30 yrs
- 22 days/yr
Wind risk 8/10 · Major
- Chance of severe wind over 30 yrs
- 80.0%
Air-quality risk 1/10 · Minimal
- Unhealthy air days now
- 0 days/yr
- Unhealthy air days in 30 yrs
- 0 days/yr
Risk factors via First Street. Map © Google.
Why this score? — see what drove the D+ grade
The composite is a weighted blend of 9 inputs, each scored 0–100. Each bar is that input's sub-score; the figure is the points it added to the 100-point composite (weight × sub-score).
- ARV discount +15.0/15.0
- Cash flow +14.3/30.0
- 1% rule +5.8/10.0
- DSCR +4.3/10.0
- Livability +3.3/5.0
- Condition / age +2.5/5.0
- Schools +2.4/10.0
- Rent growth +2.2/5.0
- Appreciation +0.0/10.0
$165,000
🖨 Deal sheet (PDF) 📄 Offer letter ✓ Due diligence
Listing remarks MLS
Great home in Dover Subdivision. Home new paint in home. This home has large master bedroom and large secondary bedrooms. This property is located in cul de sac and is close to shopping, freeways and schools.
Key facts
- Quiet cul-de-sac lot
- Attached garage
- Updated bathrooms
Tags
Property features AI
Finance
- Other: Subdivision: Dover
- Financial info: Down payment assistance resources available
- HOA & community: Mandatory HOA; Quarterly HOA fee; Subdivision amenities include a park/playground
Exterior
- Parking: Attached 2-car garage
- Utilities: Public water; Public sewer
- Home design: Pre-owned single-family home; Approximately 24 years old
- Construction: Brick and 4-sided masonry exterior with cement fiber accents; Slab foundation; Composition roof
- Exterior features: Privacy fence; Located on a cul-de-sac/dead end
Interior
- Kitchen: Kitchen (12 x 10)
- Bedrooms: Master bedroom on upper level with walk-in closet, ceiling fan, and full bath; Bedroom 2 (16 x 12); Bedroom 3 (16 x 12)
- Flooring: Ceramic tile flooring; Slate flooring
- Bathrooms: Two full bathrooms and one half bath; Master bath with shower only and single vanity (10 x 8)
- Heating & cooling: Central heating (electric); Central air conditioning
- Interior features: Ceiling fans throughout; Washer and dryer connections; Living and dining room combined; Utility room inside; All window coverings remain
- Laundry & utility: Utility room (11 x 8); Washer and dryer connections in home
Neighborhood map
What this means for you Summary
Snapshot
- This is a 3-bed/2.5-bath single-family listed at $165k.
Deal economics
- At list price, monthly cash flow is $29 ($348/yr) — positive.
- The deal already cash-flows at list — no discount required.
- Meets the 1% rule at list price ($2k rent vs $165k).
- Recommended offer: $145k (12.0% below list) — sets the bar for market timing.
- Cap rate 6.5% vs local median 4.3% in Converse — top-decile yield for the area; either an underpriced asset or a hidden risk that comps aren't pricing in. Stress-test before assuming the spread holds.
Location & tenants
- Location reads 66/100 on livability (#649 in TX) — a middle-class / working-renter tenant base. Strengths: cost of living A+, housing A+, employment B; Watch: crime C-, amenities F, commute F.
- Judson ISD (suburban): math 21% / reading 33% proficiency, ranked #660 of 826 in TX (top 80%) — low school quality limits family demand, transient renter base, plan for 1-2y turnover.
- Zoned schools: Elolf El (math 22% / reading 22%, grade F, #3,333 of 4,322 statewide, top 80%, 668 students, 65% FRL); Judson Middle (math 21% / reading 34%, grade F, #1,156 of 1,662 statewide, top 71%, 1,259 students, 70% FRL); Karen Wagner H S (math 12% / reading 29%, grade F, #1,389 of 1,632 statewide, top 86%, 2,366 students, 80% FRL).
- Market conditions: Rents soft (-1.1%/yr); 1207 active listings in the ZIP; 40 comparable units currently listed for rent nearby; rentals at typical pace (median 20d on market — plan ~3-4 weeks tenant-placement turnaround); solid renter incomes; 8,308 units permitted in Bexar County in 2024 (2,506 in 5+ unit buildings).
Forward outlook
- Local home prices are declining (-3.0%/yr); year-one equity from $1k of loan paydown is wiped out by about $5k of value loss. Plan a longer hold.
- Bexar County population projected at +50% by 2050 — long-run rental-demand tailwind backs the buy-and-hold thesis.
Negotiation context
- It's been on market 123 days — a 12% lower offer ($145k) is reasonable based on typical stale-listing flexibility.
- 7 sale attempts since 15y ago; this cycle's ask has dropped $20k (11%) from the opening price — seller is motivated, your offer sets the floor, not the list.
Risks & watch-outs
- Climate carrying-cost: severe wind risk, 80% chance of damaging wind over 30y; moderate wildfire risk; extreme-heat days projected 7→22/yr by 2055 (HVAC capex compounding) — expect insurance premiums to compound above CPI over the hold.
Questions for the listing agent
- It's been on market 123 days. Have you received any prior offers? Is the seller open to a 12% concession, seller financing, or rate buy-down credit?
- What does the HOA fee cover, when was the last increase, and are there any pending special assessments or reserve-fund shortfalls?
- Why hasn't it sold? Are there any deal-killer items the seller is aware of (foundation, flood, title, zoning, code violations)?
- Is there a deadline driving the sale (1031 exchange, divorce, estate, relocation)? That informs how much negotiation room exists.
- The area grade is low — what's the realistic commute time and amenity access for the typical tenant pool here? Any planned neighborhood developments (good or bad) we should know about?
- What's the average days-on-market for RENTAL listings here right now (not sales)? A rising rental-DOM trend means longer vacancies and softer asking-rent achievability than the comps imply.
- What's the recent tenant-quality profile in this submarket — average credit score on applications, eviction rate, late-payment / NSF rate, and stable-employment percentage? A property-management company in the area should have these aggregated.
- How much new for-sale + rental construction is in the pipeline within 1–3 miles? Heavy new supply typically softens prices + rents 12–24 months out; constrained supply supports both.
Investment metrics
- 1% rule
- 1.08% ✓
- Cap rate
- 6.50%
- Cash-on-cash
- 0.75%
- DSCR
- 1.03
- GRM
- 7.7
CMA / ARV
- ARV (on-the-fly)
- $243,628
- Comps found
- 12
Show comp detail 12 sales within ~0.75 mi
| Address | Dist | Beds/Ba | Sqft | Sold | Price | $/sf | Match |
|---|---|---|---|---|---|---|---|
| 8936 Dakota Run | 0.03mi | 3/2.5 | 1,582 (0%) | 2mo | $189,000 | $119 | 97 |
| 9207 Crestway Rd | 0.31mi | 3/2.0 | 1,634 (+3%) | 2mo | $250,999 | $154 | 76 |
| 8915 Slumber St | 0.46mi | 3/2.0 | 1,568 (-1%) | 1mo | $189,900 | $121 | 74 |
| 6323 Monk Lndg | 0.61mi | 3/2.0 | 1,570 (-1%) | 2mo | $344,900 | $220 | 67 |
| 9402 Dassler Spgs | 0.50mi | 3/2.0 | 1,510 (-5%) | 1mo | $255,999 | $170 | 66 |
| 7438 Coers Blvd | 0.66mi | 3/2.0 | 1,588 (+0%) | 1mo | $185,000 | $116 | 66 |
| 6517 Titan Park | 0.54mi | 3/2.0 | 1,510 (-5%) | 1mo | $236,999 | $157 | 64 |
| 6447 Beech Trl | 0.51mi | 3/2.5 | 1,698 (+7%) | 2mo | $190,000 | $112 | 62 |
| 6630 Snow Mdw | 0.66mi | 3/2.0 | 1,525 (-4%) | 0mo | $215,000 | $141 | 61 |
| 9222 Espadrille Run | 0.39mi | 3/2.0 | 1,384 (-12%) | 1mo | $258,500 | $187 | 58 |
| 8174 Ocean Meadow Dr | 0.74mi | 3/2.5 | 1,698 (+7%) | 1mo | $198,975 | $117 | 52 |
| 6310 Monk Lndg | 0.66mi | 3/2.0 | 1,386 (-12%) | 1mo | $318,900 | $230 | 46 |
Match score weights: distance 35% · size 25% · config 20% · recency 20%. Top-matched comps best support the ARV.
Projected returns pro-forma
-3.0% appreciation · 0.0% rent growth · sell at horizon
- IRR
- -19.1%
- Equity multiple
- 0.35×
- Total profit
- $-29,948
- Equity at exit
- $24,602
- IRR
- -21.8%
- Equity multiple
- 0.06×
- Total profit
- $-43,215
- Equity at exit
- $14,266
Cash invested: $46,200 (down + closing). Projections, not guarantees.
Landlord ↔ Tenant lean methodology
- Overall (STATE)
- 87 Strongly Landlord-Friendly
- State Texas
- 87 Strongly Landlord-Friendly · R+5
- County
- — inherits STATE
- City
- — inherits STATE
ZIP-level market 78109
- Home prices YoY
- -17.8%
- Rents YoY
- -1.1%
- Active inventory
- 1207
- Price-to-rent
- 7.7×
Monthly cashflow live
- Estimated rent
- $1,786 high interval (Pro) →
- Mortgage (P&I)
- −$865
- Tax from tax record
- −$335 /mo · $4,021/yr
- Insurance
- −$69
- HOA
- −$113
- Vacancy / Maint / Mgmt
- −$375
- Net cashflow
- $29
Break-even live
Sensitivity live
| Price | -10% $122 | -5% $76 | +0% $29 | +5% $-18 | +10% $-64 |
|---|---|---|---|---|---|
| Rent | -10% $-112 | -5% $-42 | +0% $29 | +5% $100 | +10% $170 |
| Rate | -1.0pp $112 | -0.5pp $71 | base $29 | +0.5pp $-14 | +1.0pp $-57 |
UW: 25.0% down · 7.5% · 30yr · 1.5% tax · 5.0% vac · 8.0% maint · 8.0% mgmt
Financing live
Cash to close
- Down payment
- $41,250
- Closing costs
- $4,950
- Reserves months
- —
- Total cash needed
- —
Loan-product check · same deal, 3 products live
Conventional
25% down · 7.5% · 30yr
- Down + closing
- —
- Monthly P&I
- —
- Monthly cashflow
- —
- DSCR
- —
- Eligible?
- —
Personal DTI + credit; lowest rate.
DSCR
20% down · 8.5% · 30yr
- Down + closing
- —
- Monthly P&I
- —
- Monthly cashflow
- —
- DSCR
- —
- Eligible?
- —
No personal income docs; deal must DSCR.
Hard money
10% down · 12.0% · 12mo
- Down + closing
- —
- Monthly P&I
- —
- Monthly cashflow
- —
- DSCR
- —
- Eligible?
- —
Short-term bridge; refi at stabilization.
Rent comps 40 comps
| Address | Beds | Baths | Sqft | Rent | $/sqft | DOM | Units | Dist |
|---|---|---|---|---|---|---|---|---|
| 6610 Eastern Clouds Converse, TX | 3.0 | 2.0 | 1496 | $1,610 | $1.08 | 0d | 1 | 0.03mi |
| 6810 Saharastone Dr Converse, TX | 3.0 | 2.0 | 1210 | $1,475 | $1.22 | 0d | 1 | 0.11mi |
| 6414 Kensinger Pass Converse, TX | 3.0 | 2.5 | 1582 | $2,100 | $1.33 | 45d | 1 | 0.20mi |
| 6907 Saharastone Dr Converse, TX | 3.0 | 3.0 | 1211 | $1,310 | $1.08 | 6d | 1 | 0.21mi |
| 6907 Saharastone Dr Converse, TX | 3.0 | 3.0 | 1211 | $1,416 | $1.17 | 14d | 1 | 0.21mi |
| 9019 Gore Cres Converse, TX | 3.0–5.0 | 2.0–3.5 | 2058 | $2,220 | $1.08 | 0d | 1 | 0.25mi |
| 8206 Longhorn Ridge Dr Converse, TX | 3.0 | 2.0 | 1386 | $1,525 | $1.10 | 4d | 1 | 0.31mi |
| 8914 Kestrel Oak Converse, TX | 3.0 | 2.5 | 1582 | $1,600 | $1.01 | 25d | 1 | 0.33mi |
| 6870 Flaming Ridge Dr Converse, TX | 3.0 | 2.5 | 1698 | $1,695 | $1.00 | 14d | 1 | 0.37mi |
| 6870 Flaming Ridge Dr Converse, TX | 3.0 | 2.0 | 1698 | $1,695 | $1.00 | 25d | 1 | 0.37mi |
| 8818 Slumber Ln Converse, TX | 3.0 | 2.0 | 1259 | $1,700 | $1.35 | 3d | 1 | 0.37mi |
| 6863 Cypress Mist Dr Converse, TX | 3.0 | 2.0 | 1735 | $1,550 | $0.89 | 12d | 1 | 0.38mi |
| 8818 Kestrel Oak Converse, TX | 3.0 | 2.5 | 1972 | $1,525 | $0.77 | 45d | 1 | 0.39mi |
| 6846 Columbia Ridge Dr Converse, TX | 3.0 | 2.0 | 1307 | $1,430 | $1.09 | 6d | 1 | 0.39mi |
| 7038 Cole Creek Dr Converse, TX | 3.0 | 2.5 | 1582 | $1,695 | $1.07 | 25d | 1 | 0.40mi |
| 8827 Slumber Ln Converse, TX | 3.0 | 2.0 | 1292 | $2,000 | $1.55 | 45d | 1 | 0.40mi |
| 8848 Staghorn Ml Converse, TX | 3.0 | 2.0 | 1212 | $1,500 | $1.24 | 6d | 1 | 0.41mi |
| 6123 Ironmill Crk Converse, TX | 3.0 | 2.0 | 1590 | $1,595 | $1.00 | 45d | 1 | 0.41mi |
| 9219 Foxing Blfs Converse, TX | 3.0 | 2.0 | 1526 | $1,850 | $1.21 | 25d | 1 | 0.41mi |
| 6822 Eden Grove Dr Converse, TX | 3.0 | 2.0 | 1435 | $1,490 | $1.04 | 45d | 1 | 0.43mi |
| 8732 Seneca Crk Converse, TX | 3.0 | 2.5 | 1582 | $1,445 | $0.91 | 45d | 1 | 0.43mi |
| 9234 Foxing Blfs Converse, TX | 3.0 | 2.5 | 1414 | $1,825 | $1.29 | 4d | 1 | 0.45mi |
| 6827 Cypress Mist Dr Converse, TX | 3.0 | 2.5 | 1698 | $1,449 | $0.85 | 4d | 1 | 0.45mi |
| 6802 Canary Meadow Dr Converse, TX | 3.0 | 2.0 | 1734 | $1,550 | $0.89 | 25d | 1 | 0.46mi |
| 9219 Bennett Frst Converse, TX | 3.0 | 2.0 | 1526 | $1,900 | $1.25 | 45d | 1 | 0.46mi |
| 6027 Kensinger Pass Converse, TX | 3.0 | 2.0 | 1332 | $1,480 | $1.11 | 6d | 1 | 0.47mi |
| 6439 Beech Trail Dr Converse, TX | 3.0 | 2.0 | 1520 | $1,450 | $0.95 | 14d | 1 | 0.50mi |
| 8320 Morning Grv Converse, TX | 4.0 | 2.5 | 1879 | $1,590 | $0.85 | 23d | 1 | 0.50mi |
| 9310 Bennett Frst Converse, TX | 4.0 | 2.5 | 2198 | $2,300 | $1.05 | 19d | 1 | 0.52mi |
| 6491 Beech Trail Dr Converse, TX | 3.0 | 2.0 | 1520 | $2,100 | $1.38 | 45d | 1 | 0.54mi |
| 9310 Nubuck Br Converse, TX | 3.0 | 2.0 | 1525 | $1,895 | $1.24 | 6d | 1 | 0.55mi |
| 9334 Aniston Blf Converse, TX | 4.0 | 2.5 | 2243 | $2,200 | $0.98 | 6d | 1 | 0.58mi |
| 8335 Bent Meadow Dr Converse, TX | 3.0 | 2.0 | 1513 | $1,595 | $1.05 | 45d | 1 | 0.58mi |
| 8911 Nature Trl Converse, TX | 4.0 | 2.5 | 2042 | $1,790 | $0.88 | 25d | 1 | 0.59mi |
| 8607 Rock Mdw Converse, TX | 4.0 | 3.0 | 1902 | $1,895 | $1.00 | 18d | 1 | 0.60mi |
| 8603 Rock Mdw Converse, TX | 4.0 | 3.0 | 2241 | $2,090 | $0.93 | 45d | 1 | 0.60mi |
| 9335 Nubuck Br Converse, TX | 4.0 | 2.5 | 2243 | $2,095 | $0.93 | 45d | 1 | 0.60mi |
| 5810 Rue Picasso Converse, TX | 4.0 | 3.0 | 2241 | $2,650 | $1.18 | 14d | 1 | 0.61mi |
| 6426 Thorpe Holw Converse, TX | 3.0 | 2.5 | 1414 | $1,600 | $1.13 | 25d | 1 | 0.62mi |
| 8151 Cheryl Meadow Dr Converse, TX | 3.0 | 2.5 | 1698 | $1,730 | $1.02 | 6d | 1 | 0.65mi |
HOA detail
- Monthly dues
- $113 · $1,356/yr
Listing history 23 events
-
2026-05-12status Pending
-
2026-05-01historical Active Option
-
2026-04-15status Back on Market
-
2026-04-13historical Active Option
-
2026-04-13status Back on Market
-
2026-04-08historical Active Option
-
2026-03-19price $165,000
-
2026-03-09status Back on Market
-
2026-03-04historical Active Option
-
2026-02-11price $175,000
-
2026-01-09$184,750 New
-
2022-05-05soldstatus Sold 211-char remark
Show marketing remark (211 chars)
Great home in Dover Subdivision. Home new paint in home. This home has large master bedroom and large secondary bedrooms. This property is located in cul de sac and is close to shopping, freeways and schools.
-
2022-05-05soldstatus
Show marketing remark (211 chars)
Great home in Dover Subdivision. Home new paint in home. This home has large master bedroom and large secondary bedrooms. This property is located in cul de sac and is close to shopping, freeways and schools.
-
2022-05-03status Pending 211-char remark
Show marketing remark (211 chars)
Great home in Dover Subdivision. Home new paint in home. This home has large master bedroom and large secondary bedrooms. This property is located in cul de sac and is close to shopping, freeways and schools.
-
2022-04-10price $215,000 211-char remark
Show marketing remark (211 chars)
Great home in Dover Subdivision. Home new paint in home. This home has large master bedroom and large secondary bedrooms. This property is located in cul de sac and is close to shopping, freeways and schools.
-
2022-04-04historical Active Option 211-char remark
Show marketing remark (211 chars)
Great home in Dover Subdivision. Home new paint in home. This home has large master bedroom and large secondary bedrooms. This property is located in cul de sac and is close to shopping, freeways and schools.
-
2022-04-03status Back on Market 211-char remark
Show marketing remark (211 chars)
Great home in Dover Subdivision. Home new paint in home. This home has large master bedroom and large secondary bedrooms. This property is located in cul de sac and is close to shopping, freeways and schools.
-
2022-03-09historical Active Option 211-char remark
Show marketing remark (211 chars)
Great home in Dover Subdivision. Home new paint in home. This home has large master bedroom and large secondary bedrooms. This property is located in cul de sac and is close to shopping, freeways and schools.
-
2022-03-09$210,000 New 211-char remark
Show marketing remark (211 chars)
Great home in Dover Subdivision. Home new paint in home. This home has large master bedroom and large secondary bedrooms. This property is located in cul de sac and is close to shopping, freeways and schools.
-
2011-07-15soldstatus
-
2011-07-12soldstatus 264-char remark
Show marketing remark (264 chars)
Great value for the money in the growing NE side of San Antonio. This 3/2 needs a little TLC but is priced well below market value. Open concept living and dining with tons of space for the entire family to spread out! Great location, close to shopping and dining!
-
2011-03-15historical 264-char remark
Show marketing remark (264 chars)
Great value for the money in the growing NE side of San Antonio. This 3/2 needs a little TLC but is priced well below market value. Open concept living and dining with tons of space for the entire family to spread out! Great location, close to shopping and dining!
-
2011-01-21$79,000 264-char remark
Show marketing remark (264 chars)
Great value for the money in the growing NE side of San Antonio. This 3/2 needs a little TLC but is priced well below market value. Open concept living and dining with tons of space for the entire family to spread out! Great location, close to shopping and dining!
ⓘ Source: listings_history table (triggers on properties + properties_extension) + one-shot
backfill from property_details.listing_events for pre-trigger history.
Tax reassessment forecast TX · Resets to sale price
- Current annual tax
- $4,021 · $335/mo
- Projected year-2 tax
- $4,021 · $335/mo
- Expected delta
- $0/yr ($0/mo · 0.0%)
ⓘ Screening estimate from a state-policy table — verify with the county assessor before closing.
Climate risk First Street
- Flood 1/10 Low FEMA zone X (unshaded) · 0% chance over 30 yrs
- Wildfire 5/10 Major
- Heat 8/10 Severe 7 d/yr ≥108°F today · 22 d/yr by 30 yrs out
- Wind 8/10 Severe 80% chance of damaging wind over 30 yrs
- Air quality 1/10 Low 0 unhealthy d/yr today · 0 by 30 yrs out
Nearby sold comps map
Loading sold comps map…
Walkable amenities ~0.75 mi
Loading nearby amenities…
Taxation est. · year 1
- Rental income
- $21,435
- − Mortgage interest
- −$9,243
- − Property taxes
- −$4,021
- − Insurance
- −$825
- − Repairs & maintenance
- −$1,715
- − Management
- −$1,715
- − HOA
- −$1,356
- − Depreciation
- −$4,800
- Taxable loss
- −$2,239
- Est. tax savings @ 24.0%
- +$537
- After-tax cash flow
- $886/yr
For passive investors: Depreciation is non-cash, so a rental often shows a tax loss while cash-flowing — sheltering income. Rental losses are passive: they offset passive income freely, and up to $25,000/yr can offset ordinary (W-2) income if you actively participate and your MAGI is under $100k (phasing out to $0 by $150k); unused losses carry forward. On sale, claimed depreciation is recaptured at up to 25%, and gains may owe capital-gains tax (a 1031 exchange can defer both). Figures are a year-1 estimate at your 24.0% rate — not tax advice; consult a CPA.
Schools (NCES district)
- District
- Judson ISD
- NCES district ID
- 4824990
- Math proficiency
- 21% ▼ -21.00%
- Reading proficiency
- 33% ▼ -7.00%
- Median HH income
- $57,542
- Composite
- 24.39/100
- National rank
- #7689
- State rank
- #660 of 826 in TX
Livability — Converse
- Score
- 66/100
- State rank
- #649
- US rank
- #12250
Category grades
Schools grade is shown separately in the Schools card above.
Census & demographics
- County
- Bexar County · 1,990,555 people
- City population
- 1,806,925
- Metro
- San Antonio-New Braunfels, TX
- Population (ZIP)
- 63,067
- Household income
- $91,320
- Rent vs Own
- Severe rent burden
- 1732.0
Population outlook (Bexar County) Hauer SSP2
- Today (2025)
- 2,336,851 people
- By 2030
- 2,560,728 · +9.6%
- By 2040
- 3,020,569 · +29.3%
- By 2050
- 3,493,522 · +49.5%
- By 2075
- 4,668,459 · +99.8%
- By 2100
- 5,533,242 · +136.8%
Race, ethnicity, and origin ACS 2023
- Neighborhood character
- Diverse neighborhood (Simpson 0.69)
- Race & ethnicity
- Hispanic / Latino 44% White 27% Two or more races 21% Black 21% Asian 3%
- Hispanic origin (detail)
- Mexican 29% Puerto Rican 4%
- Common ancestry
- Lithuanian 1% Romanian 1% Italian 1%
- Foreign-born
- 11% · Canada, Vietnam, South Korea
- Languages at home
- 71% English-only · Spanish 23% Tagalog/Filipino 1% Other Asian/Pacific 1%
Political lean MEDSL · Bexar
- 2024 margin
- Lean D (+9.8) · D 54.3% · R 44.6% · Other 1.1%
- 2008→2024 swing
- +4.2pp toward D · 2008: 5.6pp · 2024: 9.8pp
- All cycles
- 2024: D+9.8 2020: D+18.2 2016: D+13.5 2012: D+4.6 2008: D+5.6
Not yet ingested
- Civics
- —
Market trends
- HPI YoY
- ▼ -51.02%
- Current HPI
- 236.4923
- Rent YoY
- ▼ -1.08%
- Metro
- San Antonio-New Braunfels, TX
- State GDP YoY
- ▲ 3.95%
- F500 in state
- 110
Industry mix (Fortune 500 HQ in TX)
| Industry | F500 HQs | Revenue |
|---|---|---|
| Energy | 16 | $1,198B |
|
||
| Technology | 5 | $198B |
|
||
| Engineering / Construction | 4 | $72B |
|
||
| Energy Services | 3 | $60B |
|
||
| Utilities | 3 | $41B |
|
||
| Healthcare | 2 | $330B |
|
||
Price history
+108.9% since first listed23 events — show timeline
- 2026-05-12 Pending — LERA
- 2026-05-01 Contingent — LERA
- 2026-04-15 Relisted — LERA
- 2026-04-13 Contingent — LERA
- 2026-04-13 Relisted — LERA
- 2026-04-08 Contingent — LERA
- 2026-03-19 Price Changed $165,000 LERA
- 2026-03-09 Relisted — LERA
- 2026-03-04 Contingent — LERA
- 2026-02-11 Price Changed $175,000 LERA
- 2026-01-09 Listed $184,750 LERA
- 2022-05-05 Sold (MLS) — LERA
- 2022-05-05 Sold (Public Records) — Public Records
- 2022-05-03 Pending — LERA
- 2022-04-10 Price Changed $215,000 LERA
- 2022-04-04 Contingent — LERA
- 2022-04-03 Relisted — LERA
- 2022-03-09 Contingent — LERA
- 2022-03-09 Listed $210,000 LERA
- 2011-07-15 Sold (Public Records) — Public Records
- 2011-07-12 Sold (MLS) — LERA
- 2011-03-15 Listing Removed — LERA
- 2011-01-21 Listed $79,000 LERA
Property tax history
+12.9%/yrLatest (2025): $4,021 · +0.9% YoY. Source: county tax records.
Cash-flow waterfall
monthlySold comps — $/sqft
last 12 mo · ≤1 miLoading sold comps…