 Triplex
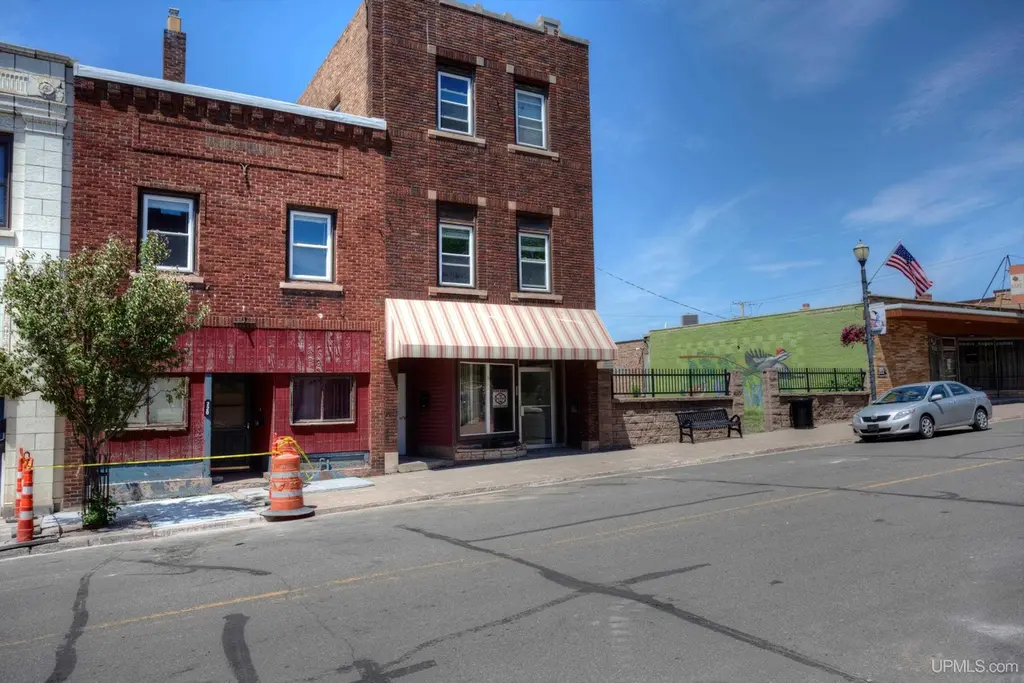
222 E Aurora St Unit 220 & 224 E Aurora Street · Ironwood, MI
Flood risk No data
- FEMA flood zone
- —
- Chance of flooding over 30 yrs
- —
- Est. flood insurance / yr
- —
Fire risk No data
- Est. fire insurance / yr
- —
Heat risk No data
- Hot days now (above threshold)
- —
- Hot days in 30 yrs
- —
Wind risk No data
- Chance of severe wind over 30 yrs
- —
Air-quality risk No data
- Unhealthy air days now
- —
- Unhealthy air days in 30 yrs
- —
Risk factors via First Street. Map © Google.
Why this score? — see what drove the B- grade
The composite is a weighted blend of 9 inputs, each scored 0–100. Each bar is that input's sub-score; the figure is the points it added to the 100-point composite (weight × sub-score).
- Cash flow +30.0/30.0
- 1% rule +10.0/10.0
- DSCR +10.0/10.0
- ARV discount +7.5/15.0
- Livability +3.5/5.0
- Schools +2.6/10.0
- Rent growth +2.5/5.0
- Condition / age +1.0/5.0
- Appreciation +0.0/10.0
$229,000
🖨 Deal sheet (PDF) 📄 Offer letter ✓ Due diligence
Multi-family units
County records classify this as Multi-Family (5+ Unit). Listing-text estimate: 3 units. estimate disagrees with records
5+ unit building — per-unit beds/baths from public records are typically unavailable; the breakdown below (if shown) is an estimate from the listing text.
Listing remarks
Downtown Ironwood Mixed-Use Investment Opportunity – 2 Commercial Spaces, 6 Apartments & Private Parking Positioned in the heart of vibrant Downtown Ironwood, this exceptional mixed-use property offers a rare combination of commercial visibility, residential income, and future development potential. Comprising 222 E Aurora Street, 220 E Aurora Street, and 224 E Aurora Street, this property presents multiple revenue streams in one prime downtown location. At 222 E Aurora Street, the street-level commercial space welcomes customers with expansive display windows and a warm, inviting atmosphere. Inside, you'll find a carpeted retail area highlighted by a decorative corner fireplace
Key facts
- Commercial spaces
- Private parking
- Downtown location
Tags
Property features AI
Finance
- Other: Zoned commercial
- Financial info: Multi-family building with 7 total units (investor/multi-unit property)
- HOA & community: Association/landlord pays lawn maintenance, electric, gas, snow removal, taxes, trash removal, water/sewer; Community amenities include grounds maintenance, security, sidewalks, street lights, pet-friendly (dogs and cats allowed), Wi‑Fi available, fiber optic internet
Exterior
- Parking: Detached garage (1 parking space in garage); Off-street parking; 3+ parking spaces (unassigned/general)
- Security: Community offers security (per association/community amenities)
- Utilities: 200+ amp electrical service with circuit breakers; Public water; Public sanitary sewer; Natural gas connected; Electricity connected; Cable connected; Phone available; Internet via Spectrum (fiber optic listed in community amenities); Sewer connected
- Home design: Multi-family property; More than 2 stories; Built in 1900; Located on north side of street; main street location, walkable to school
- Construction: Brick and cedar construction; Basement foundation
- Exterior features: Brick and cedar exterior; Sidewalks; Street lights; Cleared, unpaved lot
Interior
- Kitchen: Dishwasher; Microwave; Range/Oven; Refrigerator
- Bedrooms: Multiple units (7 total) — individual bedroom counts not provided
- Flooring: Hardwood floors
- Bathrooms: Main floor full bathroom; 1 lavatory; 7 full bathrooms (total reported); 8 total baths/lavatories
- Heating & cooling: Boiler heating; Ceiling fans; Wall/Window air conditioning; Natural gas fuel
- Interior features: Hardwood floors; Walk-in closet; Decorative fireplace; Has basement
- Laundry & utility: Full basement with outside/walk-out entrance (basement type); Electric water heater
Neighborhood map
What this means for you Summary
Snapshot
- This is a 3 × 3-bed/2.5-bath units multifamily listed at $229k. Condition is rated poor.
Deal economics
- At list price, monthly cash flow is $1k ($15k/yr) — positive. Per door: $420/mo.
- The deal already cash-flows at list — no discount required.
- Meets the 1% rule at list price ($4k rent vs $229k).
- Cap rate 12.9% vs local median 5.7% in Ironwood — top-decile yield for the area; either an underpriced asset or a hidden risk that comps aren't pricing in. Stress-test before assuming the spread holds.
Location & tenants
- Location reads 70/100 on livability (#325 in MI) — a middle-class / working-renter tenant base. Strengths: cost of living A+, crime A, housing A; Watch: health & safety C-, amenities F, commute F.
- Ironwood Area Schools Of Gogebic County (town): math 23% / reading 40% proficiency, ranked #361 of 540 in MI (top 67%) — families likely to look elsewhere, expect single-tenant / working-renter base with shorter leases.
- Zoned schools: Gogebic Co Community Education (28 students, 79% FRL) — zoned schools average 79% FRL vs 49% district-wide (29 pts higher); higher-poverty schools than district average — tighter screening recommended.
- Market conditions: 69 active listings in the ZIP; 28 units permitted in Gogebic County in 2024 (0 in 5+ unit buildings).
Forward outlook
- Local home prices are declining (-3.0%/yr); year-one equity from $2k of loan paydown is wiped out by about $7k of value loss. Plan a longer hold.
- Gogebic County population projected at -24% by 2050 — secular population decline; favor cash flow + early exit over multi-decade hold.
- At projected returns (-3.0% appreciation + 3.0% rent growth), your $64k cash investment doubles in ~6 years — after that, you're playing with house money.
Negotiation context
- Only 12 days on market — expect competitive offers; lowballing is unlikely to land.
Risks & watch-outs
- Watch-outs: built in 1900 — expect roof / HVAC / electrical / plumbing capex.
Questions for the listing agent
- Can we see the unit-by-unit rent roll, current vacancy, and any below-market leases? What's the average tenancy length?
- What capital expenditures (roof, boiler, parking lot, exteriors) have been made in the last 5 years, and what's planned in the next 2?
- Have any recent inspections been done? Can we get a copy of the seller's disclosures and any deferred-maintenance estimates?
- Built in 1900 — when were the roof, HVAC, electrical panel, plumbing, and water heater last replaced?
- Is there a deadline driving the sale (1031 exchange, divorce, estate, relocation)? That informs how much negotiation room exists.
- Schools are D-rated, which usually means shorter tenancies and higher turnover. Who's the typical renter profile here, and what's been the actual vacancy rate?
- What's the average days-on-market for RENTAL listings here right now (not sales)? A rising rental-DOM trend means longer vacancies and softer asking-rent achievability than the comps imply.
- What's the recent tenant-quality profile in this submarket — average credit score on applications, eviction rate, late-payment / NSF rate, and stable-employment percentage? A property-management company in the area should have these aggregated.
- How much new apartment / multifamily construction is in the pipeline within 1–3 miles? Heavy new supply (>2% of stock underway) typically softens rents 12–24 months out; light construction supports rent growth.
Investment metrics
- 1% rule
- 1.57% ✓
- Cap rate
- 12.90%
- Cash-on-cash
- 23.61%
- DSCR
- 2.05
- GRM
- 5.3
CMA / ARV
No comps found within radius.
Projected returns pro-forma
-3.0% appreciation · 3.0% rent growth · sell at horizon
- IRR
- 16.7%
- Equity multiple
- 1.68×
- Total profit
- $43,288
- Equity at exit
- $34,145
- IRR
- 25.3%
- Equity multiple
- 3.20×
- Total profit
- $141,367
- Equity at exit
- $19,800
Cash invested: $64,120 (down + closing). Projections, not guarantees.
Landlord ↔ Tenant lean methodology
- Overall (STATE)
- 62 Landlord-Friendly
- State Michigan
- 62 Landlord-Friendly · EVEN
- County
- — inherits STATE
- City
- — inherits STATE
ZIP-level market 49938
- Home prices YoY
- -23.3%
- Active inventory
- 69
- Price-to-rent
- 15.9×
Monthly cashflow live
- Estimated rent
- $3,600 medium interval (Pro) →
- Mortgage (P&I)
- −$1,201
- Tax est. 1.5%
- −$286 /mo · $3,435/yr
- Insurance
- −$95
- HOA
- −$0
- Vacancy / Maint / Mgmt
- −$756
- Net cashflow
- $1,261
Break-even live
Sensitivity live
| Price | -10% $1,420 | -5% $1,341 | +0% $1,261 | +5% $1,182 | +10% $1,103 |
|---|---|---|---|---|---|
| Rent | -10% $977 | -5% $1,119 | +0% $1,261 | +5% $1,404 | +10% $1,546 |
| Rate | -1.0pp $1,377 | -0.5pp $1,320 | base $1,261 | +0.5pp $1,202 | +1.0pp $1,142 |
3-unit breakdown (identical units grouped — click to expand)
| Units | Beds | Baths | Est. rent |
|---|---|---|---|
| 3× units | 3 | 2.5 | $3,600 |
| #1 | 3 | 2.5 | $1,200 |
| #2 | 3 | 2.5 | $1,200 |
| #3 | 3 | 2.5 | $1,200 |
| Total (3 units) | $3,600 | ||
UW: 25.0% down · 7.5% · 30yr · 1.5% tax · 5.0% vac · 8.0% maint · 8.0% mgmt
Financing live
Cash to close
- Down payment
- $57,250
- Closing costs
- $6,870
- Reserves months
- —
- Total cash needed
- —
Loan-product check · same deal, 3 products live
Conventional
25% down · 7.5% · 30yr
- Down + closing
- —
- Monthly P&I
- —
- Monthly cashflow
- —
- DSCR
- —
- Eligible?
- —
Personal DTI + credit; lowest rate.
DSCR
20% down · 8.5% · 30yr
- Down + closing
- —
- Monthly P&I
- —
- Monthly cashflow
- —
- DSCR
- —
- Eligible?
- —
No personal income docs; deal must DSCR.
Hard money
10% down · 12.0% · 12mo
- Down + closing
- —
- Monthly P&I
- —
- Monthly cashflow
- —
- DSCR
- —
- Eligible?
- —
Short-term bridge; refi at stabilization.
Listing history 10 events
-
2026-06-22days on market $229,000 Active 12 DOM
-
2026-06-21days on market $229,000 Active 11 DOM
-
2026-06-21days on market $229,000 Active 10 DOM
-
2026-06-18days on market $229,000 Active 8 DOM
-
2026-06-17days on market $229,000 Active 7 DOM
-
2026-06-16days on market $229,000 Active 6 DOM
-
2026-06-15days on market $229,000 Active 5 DOM
-
2026-06-13days on market $229,000 Active 3 DOM
-
2026-06-12remarks 689-char remark
-
2026-06-12$229,000 Active 2 DOM
ⓘ Source: listings_history table (triggers on properties + properties_extension) + one-shot
backfill from property_details.listing_events for pre-trigger history.
Nearby sold comps map
Loading sold comps map…
Walkable amenities ~0.75 mi
Loading nearby amenities…
Taxation est. · year 1
- Rental income
- $43,200
- − Mortgage interest
- −$12,828
- − Property taxes
- −$3,435
- − Insurance
- −$1,145
- − Repairs & maintenance
- −$3,456
- − Management
- −$3,456
- − Depreciation
- −$6,662
- Taxable income
- $12,219
- Est. tax owed @ 24.0%
- −$2,932
- After-tax cash flow
- $12,205/yr
For passive investors: Depreciation is non-cash, so a rental often shows a tax loss while cash-flowing — sheltering income. Rental losses are passive: they offset passive income freely, and up to $25,000/yr can offset ordinary (W-2) income if you actively participate and your MAGI is under $100k (phasing out to $0 by $150k); unused losses carry forward. On sale, claimed depreciation is recaptured at up to 25%, and gains may owe capital-gains tax (a 1031 exchange can defer both). Figures are a year-1 estimate at your 24.0% rate — not tax advice; consult a CPA.
Condition & rehab AI · 12 photos
This property requires extensive renovations, including new ceilings, cabinets, and appliances, to improve its condition and increase its value.
Repairs flagged
- Major ceiling — Exposed and damaged
- Major cabinets — Missing and exposed
- Major appliances — Exposed and missing
Value-add opportunities
- Both New ceiling and cabinets — Improves both resale and rental value
- Both New appliances — Improves both resale and rental value
- Both Painting — Improves both resale and rental value
Renovation cost estimate screening
| Repair item | Severity | Est. cost |
|---|---|---|
| ceiling · Exposed and damaged | Major | $15,000–50,000 |
| cabinets · Missing and exposed | Major | $15,000–50,000 |
| appliances · Exposed and missing | Major | $15,000–50,000 |
| Total estimated repair cost · 3 items | $45,000–150,000 |
Value-add ROI direction
- Both New ceiling and cabinets — Improves both resale and rental value ↑
- Both New appliances — Improves both resale and rental value ↑
- Both Painting — Improves both resale and rental value ↑
ⓘ Cost ranges are severity-bucket heuristics (US national rule-of-thumb). Get contractor quotes + a written scope before underwriting a rehab budget.
Schools (NCES district)
- District
- Ironwood Area Schools Of Gogebic County
- NCES district ID
- 2619470
- Math proficiency
- 23% ▼ -13.00%
- Reading proficiency
- 40% ▼ -5.00%
- Median HH income
- $33,313
- Composite
- 25.78/100
- National rank
- #7369
- State rank
- #361 of 540 in MI
Livability — Ironwood
- Score
- 70/100
- State rank
- #325
- US rank
- #8024
Category grades
Schools grade is shown separately in the Schools card above.
Census & demographics
- Census place
- Ironwood, MI
- Population (ZIP)
- 7,424
Population outlook (Gogebic County) Hauer SSP2
- Today (2025)
- 13,951 people
- By 2030
- 13,191 · -5.4%
- By 2040
- 11,739 · -15.9%
- By 2050
- 10,580 · -24.2%
- By 2075
- 8,530 · -38.9%
- By 2100
- 6,903 · -50.5%
Race, ethnicity, and origin ACS 2023
- Neighborhood character
- Predominantly White (94%)
- Race & ethnicity
- White 94% Two or more races 3% Hispanic / Latino 2%
- Common ancestry
- Romanian 10% Lithuanian 4% Portuguese 3%
- Foreign-born
- 1%
- Languages at home
- 97% English-only · Spanish 2%
Political lean MEDSL · Gogebic
- 2024 margin
- R (+17.1) · D 40.8% · R 57.9% · Other 1.2%
- 2008→2024 swing
- -34.4pp toward R · 2008: 17.3pp · 2024: -17.1pp
- All cycles
- 2024: R+17.1 2020: R+12.5 2016: R+15.0 2012: D+8.1 2008: D+17.3
Not yet ingested
- Civics
- —
Market trends
- HPI YoY
- ▼ -61.86%
- Current HPI
- 204.0924
- Rent YoY
- —
- Metro
- —
- State GDP YoY
- ▲ 1.37%
- F500 in state
- 28
Industry mix (Fortune 500 HQ in MI)
| Industry | F500 HQs | Revenue |
|---|---|---|
| Automotive Parts | 3 | $48B |
|
||
| Automotive | 2 | $372B |
|
||
| Chemicals | 1 | $45B |
|
||
| Automotive Retail | 1 | $29B |
|
||
| Healthcare / Medical Devices | 1 | $23B |
|
||
| Automotive Technology | 1 | $20B |
|
||
Price history
1 event — show timeline
- 2026-06-02 Listed $229,000 MiRealSource-MiMLS
Cash-flow waterfall
monthlySold comps — $/sqft
last 12 mo · ≤1 miLoading sold comps…