2331 Belleair Rd #804 · Largo, FL
Flood risk 9/10 · Severe
- FEMA flood zone
- AE
- Chance of flooding over 30 yrs
- 0.99%
- Est. flood insurance / yr
- $1,737 – $8,500
Fire risk 1/10 · Minimal
- Est. fire insurance / yr
- $947 – $1,759
Heat risk 10/10 · Severe
- Hot days now (above 107°F)
- 7 days/yr
- Hot days in 30 yrs
- 23 days/yr
Wind risk 10/10 · Severe
- Chance of severe wind over 30 yrs
- 99.0%
Air-quality risk 3/10 · Minor
- Unhealthy air days now
- 3 days/yr
- Unhealthy air days in 30 yrs
- 3 days/yr
Risk factors via First Street. Map © Google.
Why this score? — see what drove the B- grade
The composite is a weighted blend of 9 inputs, each scored 0–100. Each bar is that input's sub-score; the figure is the points it added to the 100-point composite (weight × sub-score).
- Cash flow +30.0/30.0
- 1% rule +10.0/10.0
- DSCR +10.0/10.0
- ARV discount +7.5/15.0
- Schools +4.3/10.0
- Livability +4.1/5.0
- Condition / age +2.5/5.0
- Rent growth +1.2/5.0
- Appreciation +0.0/10.0
$95,000
🖨 Deal sheet 📄 Offer letter ✓ Due diligence
Listing remarks
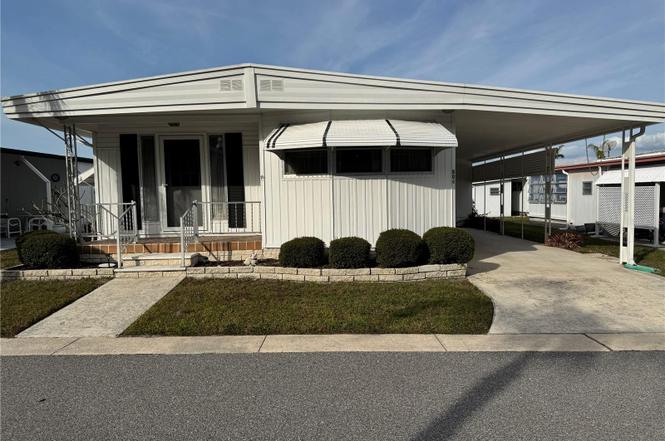
Welcome Home to Beautiful Country Park, a 128-unit, vibrant 55-Plus Manufactured Home Community located in Clearwater, Florida. This is a Resident Owned Co-Op with many fine features. Country Park was named “Community Association of the Year – 2024. This charming 2-bedroom, 2-bathroom home offers comfortable and spacious living. The home is situated in the back half of the park walking distance to the pool and clubhouse. The interior of this home is spacious. It has a large living area with a separate dining room. The kitchen has plenty of counter space and a movable island/sitting space. The bedrooms are large with plenty of closets. The kitchen is equipped with lots of storage
Key facts
- Large living area
- Lots of storage
- Separate dining room
Tags
Property features AI
Finance
- Other: Furnished; Third-party listing; Directions: Belcher Road to Belleair Road; Country Park on the right. Enter park, go past pool/clubhouse, last street (8th Street) turn right; 2nd unit on right, Unit 804.
- Financial info: Total monthly fees approximately $260; total annual fees $3,120; Lease restrictions apply
- HOA & community: Monthly association fee of $260 (includes common area taxes, pool, grounds maintenance, management, sewer, trash, water); Association approval required; Association amenities: Clubhouse, Laundry, Pool, Recreation facilities, Shuffleboard court; Senior community; Pets not allowed
Exterior
- Parking: Driveway with tandem parking; 2-car carport
- Utilities: Public water; Public sewer; Electricity connected; Cable available; Broadband/high-speed internet available; Water connected; Sewer connected
- Home design: Mobile home (double wide); One story; Faces south; Entry on main level
- Construction: Metal siding; Roof over; Pillar/post/pier foundation; Building area about 1,577 sq ft
- Exterior features: Awning(s); Shed(s); Paved road access
Interior
- Kitchen: Dishwasher; Range; Refrigerator
- Bedrooms: 2 bedrooms
- Flooring: Laminate
- Bathrooms: 2 full bathrooms
- Heating & cooling: Central heating; Central air conditioning
- Interior features: Thermostat; Window treatments
- Laundry & utility: Washer; Dryer; Laundry located outside
Neighborhood map
What this means for you Summary
Snapshot
- This is a 2-bed/2.0-bath manufactured listed at $95k.
Deal economics
- At list price, monthly cash flow is $249 ($3k/yr) — positive.
- The deal already cash-flows at list — no discount required.
- Meets the 1% rule at list price ($2k rent vs $95k).
- Recommended offer: $84k (12.0% below list) — sets the bar for market timing.
- Cap rate 14.8% vs local median 4.2% in Largo — top-decile yield for the area; either an underpriced asset or a hidden risk that comps aren't pricing in. Stress-test before assuming the spread holds.
Location & tenants
- Location reads 82/100 on livability (#82 in FL, #1,240 nationally) — a professional / high-income tenant draw. Strengths: commute A+, cost of living A+, housing A+; Watch: employment D+, amenities F.
- Pinellas (suburban): math 51% / reading 51% proficiency, ranked #31 of 73 in FL (top 42%) — acceptable for families but not a draw, mixed tenant base, ~2y average lease.
- Market conditions: Rents falling (-5.2%/yr); 261 active listings in the ZIP; 40 comparable units currently listed for rent nearby; rentals at typical pace (median 18d on market — plan ~3-4 weeks tenant-placement turnaround); 2,676 units permitted in Pinellas County in 2024 (1,422 in 5+ unit buildings).
- This rent runs 35% of the median local income ($67k/yr) — at the standard rent-burdened threshold; future hikes will face affordability resistance.
Forward outlook
- Local home prices are declining (-3.0%/yr); year-one equity from $657 of loan paydown is wiped out by about $3k of value loss. Plan a longer hold.
- Pinellas County population projected at +14% by 2050 — modest demand growth; plan on rents tracking national, not racing it.
Negotiation context
- It's been on market 160 days — a 12% lower offer ($84k) is reasonable based on typical stale-listing flexibility.
- Current owner paid $40k; list at $95k implies a 138% gain — meaningful room to come down on a strong offer.
Risks & watch-outs
- Watch-outs: flood insurance adds $427/mo.
- Climate carrying-cost: in FEMA flood zone AE (mandatory federal flood insurance); severe wind risk, 99% chance of damaging wind over 30y; extreme-heat days projected 7→23/yr by 2055 (HVAC capex compounding) — expect insurance premiums to compound above CPI over the hold.
Questions for the listing agent
- It's been on market 160 days. Have you received any prior offers? Is the seller open to a 12% concession, seller financing, or rate buy-down credit?
- Built in 1973 — when were the roof, HVAC, electrical panel, plumbing, and water heater last replaced?
- What's the actual annual flood-insurance premium (NFIP or private), and is the property in a SFHA with mandatory coverage?
- What does the HOA fee cover, when was the last increase, and are there any pending special assessments or reserve-fund shortfalls?
- Why hasn't it sold? Are there any deal-killer items the seller is aware of (foundation, flood, title, zoning, code violations)?
- Is there a deadline driving the sale (1031 exchange, divorce, estate, relocation)? That informs how much negotiation room exists.
- What's the average days-on-market for RENTAL listings here right now (not sales)? A rising rental-DOM trend means longer vacancies and softer asking-rent achievability than the comps imply.
- What's the recent tenant-quality profile in this submarket — average credit score on applications, eviction rate, late-payment / NSF rate, and stable-employment percentage? A property-management company in the area should have these aggregated.
- How much new for-sale + rental construction is in the pipeline within 1–3 miles? Heavy new supply typically softens prices + rents 12–24 months out; constrained supply supports both.
Investment metrics
- 1% rule
- 2.09% ✓
- Cap rate
- 14.82%
- Cash-on-cash
- 30.46%
- DSCR
- 2.36
- GRM
- 4.0
CMA / ARV
No comps found within radius.
Projected returns pro-forma
-3.0% appreciation · 0.0% rent growth · sell at horizon
- IRR
- -5.3%
- Equity multiple
- 0.81×
- Total profit
- $-4,944
- Equity at exit
- $14,165
- IRR
- -3.4%
- Equity multiple
- 0.83×
- Total profit
- $-4,631
- Equity at exit
- $8,214
Cash invested: $26,600 (down + closing). Projections, not guarantees.
Landlord ↔ Tenant lean methodology
- Overall (STATE)
- 87 Strongly Landlord-Friendly
- State Florida
- 87 Strongly Landlord-Friendly · R+3
- County
- — inherits STATE
- City
- — inherits STATE
ZIP-level market 33764
- Rents YoY
- -5.2%
- Active inventory
- 261
- Price-to-rent
- 4.0×
Monthly cashflow live
- Estimated rent
- $1,986 high interval (Pro) →
- Mortgage (P&I)
- −$498
- Tax from tax record
- −$96 /mo · $1,152/yr
- Insurance
- −$40
- Flood insurance flood zone
- −$427 /mo · $5,118/yr
- HOA
- −$260
- Vacancy / Maint / Mgmt
- −$417
- Net cashflow
- $249
Break-even live
UW: 25.0% down · 7.5% · 30yr · 1.5% tax · 5.0% vac · 8.0% maint · 8.0% mgmt
Financing live
Cash to close
- Down payment
- $23,750
- Closing costs
- $2,850
- Reserves months
- —
- Total cash needed
- —
Loan-product check · same deal, 3 products live
Conventional
25% down · 7.5% · 30yr
- Down + closing
- —
- Monthly P&I
- —
- Monthly cashflow
- —
- DSCR
- —
- Eligible?
- —
Personal DTI + credit; lowest rate.
DSCR
20% down · 8.5% · 30yr
- Down + closing
- —
- Monthly P&I
- —
- Monthly cashflow
- —
- DSCR
- —
- Eligible?
- —
No personal income docs; deal must DSCR.
Hard money
10% down · 12.0% · 12mo
- Down + closing
- —
- Monthly P&I
- —
- Monthly cashflow
- —
- DSCR
- —
- Eligible?
- —
Short-term bridge; refi at stabilization.
Rent comps 40 comps
| Address | Beds | Baths | Sqft | Rent | $/sqft | DOM | Units | Dist |
|---|---|---|---|---|---|---|---|---|
| 2207 Belleair Rd Unit B7 Clearwater, FL | 2.0 | 1.0 | 857 | $1,800 | $2.10 | 20d | 1 | 0.27mi |
| 2207 Belleair Rd Unit B4 Clearwater, FL | 2.0 | 1.0 | 857 | $1,625 | $1.90 | 14d | 1 | 0.27mi |
| 2225 Nursery Rd Clearwater, FL | 2.0 | 1.0–2.0 | 802 | $1,850 | $2.31 | 24d | 1 | 0.36mi |
| 1550 S Belcher Rd Clearwater, FL | 1.0 | 1.0 | 825 | $1,350 | $1.64 | 4d | 1 | 0.48mi |
| 2159 Nursery Rd Clearwater, FL | 1.0–3.0 | 1.0–2.0 | 870 | $1,481 | $1.70 | 1d | 10 | 0.53mi |
| 2102 Nursery Rd Unit 2 Clearwater, FL | 2.0 | 2.0 | 960 | $1,555 | $1.62 | 14d | 1 | 0.60mi |
| 1433 S Belcher Rd Unit F9 Clearwater, FL | 2.0 | 2.0 | 855 | $2,450 | $2.87 | 2d | 1 | 0.61mi |
| 1433 S Belcher Rd Clearwater, FL | 1.0–2.0 | 1.0–2.0 | 748 | $2,450 | $3.27 | 20d | 2 | 0.65mi |
| 2100 Nursery Rd Clearwater, FL | 1.0–2.0 | 1.0–2.0 | 910 | $1,750 | $1.92 | 3d | 10 | 0.68mi |
| 2554 Oak Trl S Clearwater, FL | 1.0–2.0 | 1.0–2.0 | 862 | $2,131 | $2.47 | 2d | 14 | 0.69mi |
| 1564 Flournoy Cir W Unit 1515105P Clearwater, FL | 2.0 | 2.0 | 990 | $5,329 | $5.38 | 14d | 1 | 0.75mi |
| 1515 Flournoy Loop Unit 1511623P Clearwater, FL | 1.0 | 1.0 | 796 | $4,866 | $6.11 | 2d | 1 | 0.78mi |
| 1515 Flournoy Loop Unit 1511622P Clearwater, FL | 1.0 | 1.0 | 796 | $3,057 | $3.84 | 14d | 1 | 0.78mi |
| 1551 Flournoy Cir W Clearwater, FL | 1.0–3.0 | 1.0–2.0 | 916 | $2,086 | $2.28 | 2d | 32 | 0.78mi |
| 2705 Via Murano #125 Clearwater, FL | 1.0 | 1.0 | 890 | $1,795 | $2.02 | 24d | 1 | 0.81mi |
| 2705 Via Murano #136 Clearwater, FL | 2.0 | 1.0 | 980 | $2,100 | $2.14 | 17d | 1 | 0.81mi |
| 2430 Harn Blvd Unit 14 Clearwater, FL | 1.0 | 1.0 | 725 | $1,400 | $1.93 | 24d | 1 | 0.84mi |
| 2430 Harn Blvd Unit 7 Clearwater, FL | 1.0 | 1.0 | 725 | $1,500 | $2.07 | 4d | 1 | 0.84mi |
| 2723 Via Capri #834 Clearwater, FL | 1.0 | 1.0 | 770 | $1,875 | $2.44 | 4d | 1 | 0.85mi |
| 1000 Cove Cay Dr Unit 2F Clearwater, FL | 2.0 | 2.0 | 960 | $2,295 | $2.39 | 24d | 1 | 0.85mi |
| 2236 Morningside Dr Clearwater, FL | 2.0 | 1.5 | 902 | $2,200 | $2.44 | 4d | 1 | 0.86mi |
| 1330 Moreland Dr Clearwater, FL | 2.0 | 2.0 | 1192 | $2,125 | $1.78 | 24d | 3 | 0.87mi |
| 2721 Via Murano #324 Clearwater, FL | 1.0 | 1.0 | 770 | $1,750 | $2.27 | 4d | 1 | 0.88mi |
| 2724 Via Murano #634 Clearwater, FL | 1.0 | 1.0 | 890 | $1,695 | $1.90 | 24d | 1 | 0.90mi |
| 2732 Via Murano #527 Clearwater, FL | 2.0 | 2.0 | 1110 | $2,800 | $2.52 | 24d | 1 | 0.95mi |
| 19029 US Highway 19 N Unit 6-10 Clearwater, FL | 1.0 | 1.0 | 875 | $1,300 | $1.49 | 4d | 1 | 0.99mi |
| 1819 Clearbrooke Dr Clearwater, FL | 2.0 | 1.5 | 997 | $2,125 | $2.13 | 17d | 1 | 1.04mi |
| 2700 Cove Cay Dr Unit 1-5D Clearwater, FL | 1.0 | 1.5 | 920 | $1,750 | $1.90 | 24d | 1 | 1.04mi |
| 1884 Clearbrooke Dr Clearwater, FL | 2.0 | 2.0 | 997 | $2,300 | $2.31 | 24d | 1 | 1.08mi |
| 19029 U.S. 19 Unit 7-8 Clearwater, FL | 2.0 | 2.0 | 1060 | $2,200 | $2.08 | 17d | 1 | 1.11mi |
| 19029 U.S. 19 Unit 1-19 Clearwater, FL | 1.0 | 1.5 | 950 | $2,000 | $2.11 | 22d | 1 | 1.11mi |
| 19135 US Highway 19 N Clearwater, FL | 1.0–4.0 | 1.0–2.5 | 1139 | $1,849 | $1.62 | 2d | 30 | 1.12mi |
| 2755 Via Capri #1226 Clearwater, FL | 2.0 | 1.0 | 980 | $2,798 | $2.86 | 4d | 1 | 1.12mi |
| 2755 Via Capri #1237 Clearwater, FL | 1.0 | 1.0 | 980 | $2,000 | $2.04 | 22d | 1 | 1.12mi |
| 1653 Bravo Dr Clearwater, FL | 1.0 | 1.0 | 850 | $2,200 | $2.59 | 4d | 1 | 1.13mi |
| 16485 US Highway 19 N Clearwater, FL | 3.0 | 1.0–2.0 | 984 | $2,877 | $2.92 | 1d | 249 | 1.15mi |
| 16485 US Highway 19 N Clearwater, FL | 3.0 | 1.0–2.0 | 984 | $3,006 | $3.06 | 17d | 100 | 1.15mi |
| 2618 Cove Cay Dr Clearwater, FL | 1.0–2.0 | 1.0–2.0 | 807 | $1,850 | $2.29 | 24d | 2 | 1.24mi |
| 2618 Cove Cay Dr #909 Clearwater, FL | 2.0 | 2.0 | 1050 | $1,850 | $1.76 | 20d | 1 | 1.25mi |
| 4500 E Bay Dr #149 Clearwater, FL | 2.0 | 2.0 | 1050 | $1,850 | $1.76 | 24d | 1 | 1.26mi |
HOA detail
- Monthly dues
- $260 · $3,120/yr
- Likely covers
- waterpool
Listing history 15 events
-
2026-06-18days on market $95,000 Active 160 DOM
-
2026-06-17days on market $95,000 Active 159 DOM
-
2026-06-16days on market $95,000 Active 158 DOM
-
2026-06-15days on market $95,000 Active 157 DOM
-
2026-06-13days on market $95,000 Active 155 DOM
-
2026-06-09days on market $95,000 Active 151 DOM
-
2026-06-08days on market $95,000 Active 150 DOM
-
2026-06-07days on market $95,000 Active 149 DOM
-
2026-06-04days on market $95,000 Active 146 DOM
-
2026-06-03days on market $95,000 Active 145 DOM
-
2026-06-01days on market $95,000 Active 143 DOM
-
2026-05-31days on market $95,000 Active 142 DOM
-
2026-04-06price $95,000
-
2026-01-09$115,000 Active
-
2002-10-01soldstatus $39,900
ⓘ Source: listings_history table (triggers on properties + properties_extension) + one-shot
backfill from property_details.listing_events for pre-trigger history.
Tax reassessment forecast FL · Resets to sale price
- Current annual tax
- $1,152 · $96/mo
- Projected year-2 tax
- $1,152 · $96/mo
- Expected delta
- $0/yr ($0/mo · 0.0%)
ⓘ Screening estimate from a state-policy table — verify with the county assessor before closing.
Climate risk First Street
- Flood 9/10 Extreme FEMA zone AE · 99% chance over 30 yrs
- Wildfire 1/10 Low
- Heat 10/10 Extreme 7 d/yr ≥107°F today · 23 d/yr by 30 yrs out
- Wind 10/10 Extreme 99% chance of damaging wind over 30 yrs
- Air quality 3/10 Moderate 3 unhealthy d/yr today · 3 by 30 yrs out
Nearby sold comps map
Loading sold comps map…
Walkable amenities ~0.75 mi
Loading nearby amenities…
Taxation est. · year 1
- Rental income
- $23,832
- − Mortgage interest
- −$5,321
- − Property taxes
- −$1,152
- − Insurance
- −$5,594
- − Repairs & maintenance
- −$1,907
- − Management
- −$1,907
- − HOA
- −$3,120
- − Depreciation
- −$2,764
- Taxable income
- $2,068
- Est. tax owed @ 24.0%
- −$496
- After-tax cash flow
- $2,487/yr
For passive investors: Depreciation is non-cash, so a rental often shows a tax loss while cash-flowing — sheltering income. Rental losses are passive: they offset passive income freely, and up to $25,000/yr can offset ordinary (W-2) income if you actively participate and your MAGI is under $100k (phasing out to $0 by $150k); unused losses carry forward. On sale, claimed depreciation is recaptured at up to 25%, and gains may owe capital-gains tax (a 1031 exchange can defer both). Figures are a year-1 estimate at your 24.0% rate — not tax advice; consult a CPA.
Schools (NCES district)
- District
- Pinellas
- NCES district ID
- 1201560
- Math proficiency
- 51% ▼ -5.00%
- Reading proficiency
- 51% ▼ -3.00%
- Median HH income
- $46,270
- Composite
- 43.27/100
- National rank
- #3046
- State rank
- #31 of 73 in FL
Livability — Largo
- Score
- 82/100
- State rank
- #82
- US rank
- #1240
Category grades
Schools grade is shown separately in the Schools card above.
Census & demographics
- Census place
- Largo, FL
- County
- Pinellas County · 939,478 people
- City population
- 106,311
- Metro
- Tampa-St. Petersburg-Clearwater, FL
- Population (ZIP)
- 27,311
- Household income
- $67,256
- Rent vs Own
- Severe rent burden
- 1118.0
Population outlook (Pinellas County) Hauer SSP2
- Today (2025)
- 1,027,532 people
- By 2030
- 1,063,586 · +3.5%
- By 2040
- 1,125,020 · +9.5%
- By 2050
- 1,168,637 · +13.7%
- By 2075
- 1,265,188 · +23.1%
- By 2100
- 1,260,357 · +22.7%
Race, ethnicity, and origin ACS 2023
- Neighborhood character
- Predominantly White (76%)
- Race & ethnicity
- White 76% Hispanic / Latino 13% Two or more races 8% Asian 4% Black 2%
- Hispanic origin (detail)
- Mexican 2% Puerto Rican 3% Cuban 2%
- Common ancestry
- Romanian 4% Lithuanian 3% German 2%
- Foreign-born
- 14% · Canada, Jamaica, Vietnam
- Languages at home
- 80% English-only · Spanish 10% Russian/Polish/Slavic 4% Other Indo-European 2%
Political lean MEDSL · Pinellas
- 2024 margin
- Lean R (+5.2) · D 46.9% · R 52.1%
- 2008→2024 swing
- -13.5pp toward R · 2008: 8.3pp · 2024: -5.2pp
- All cycles
- 2024: R+5.2 2020: D+0.2 2016: R+1.1 2012: D+5.6 2008: D+8.3
Not yet ingested
- Civics
- —
Market trends
- HPI YoY
- ▼ -350.08%
- Current HPI
- 315.4133
- Rent YoY
- ▼ -5.24%
- Metro
- Tampa-St. Petersburg-Clearwater, FL
- State GDP YoY
- ▲ 3.28%
- F500 in state
- 36
Industry mix (Fortune 500 HQ in FL)
| Industry | F500 HQs | Revenue |
|---|---|---|
| Industrial Technology | 2 | $29B |
|
||
| Insurance | 2 | $17B |
|
||
| Retail | 1 | $60B |
|
||
| Technology Distribution | 1 | $58B |
|
||
| Homebuilding | 1 | $35B |
|
||
| Technology Manufacturing | 1 | $35B |
|
||
Price history
+138.1% since first listed3 events — show timeline
- 2026-04-06 Price Changed $95,000 Stellar MLS as Distributed by MLS Grid
- 2026-01-09 Listed $115,000 Stellar MLS as Distributed by MLS Grid
- 2002-10-01 Sold (Public Records) $39,900 Public Records
Property tax history
+3.0%/yrLatest (2025): $1,152 · +3.0% YoY. Source: county tax records.
Cash-flow waterfall
monthlySold comps — $/sqft
last 12 mo · ≤1 miLoading sold comps…