1849 Glens Falls Mountain Rd · Lake Luzerne, NY
Flood risk 1/10 · Minimal
- FEMA flood zone
- X
- Chance of flooding over 30 yrs
- 0.0%
- Est. flood insurance / yr
- $507 – $1,088
Fire risk 3/10 · Minor
- Est. fire insurance / yr
- $691 – $1,283
Heat risk 2/10 · Minimal
- Hot days now (above 93°F)
- 7 days/yr
- Hot days in 30 yrs
- 16 days/yr
Wind risk 2/10 · Minimal
- Chance of severe wind over 30 yrs
- 2.0%
Air-quality risk 1/10 · Minimal
- Unhealthy air days now
- 0 days/yr
- Unhealthy air days in 30 yrs
- 0 days/yr
Risk factors via First Street. Map © Google.
Why this score? — see what drove the B+ grade
The composite is a weighted blend of 9 inputs, each scored 0–100. Each bar is that input's sub-score; the figure is the points it added to the 100-point composite (weight × sub-score).
- Cash flow +30.0/30.0
- 1% rule +10.0/10.0
- DSCR +10.0/10.0
- Appreciation +10.0/10.0
- ARV discount +7.5/15.0
- Schools +4.2/10.0
- Livability +3.2/5.0
- Rent growth +2.5/5.0
- Condition / age +2.5/5.0
$150,000
🖨 Deal sheet 📄 Offer letter ✓ Due diligence
Listing remarks
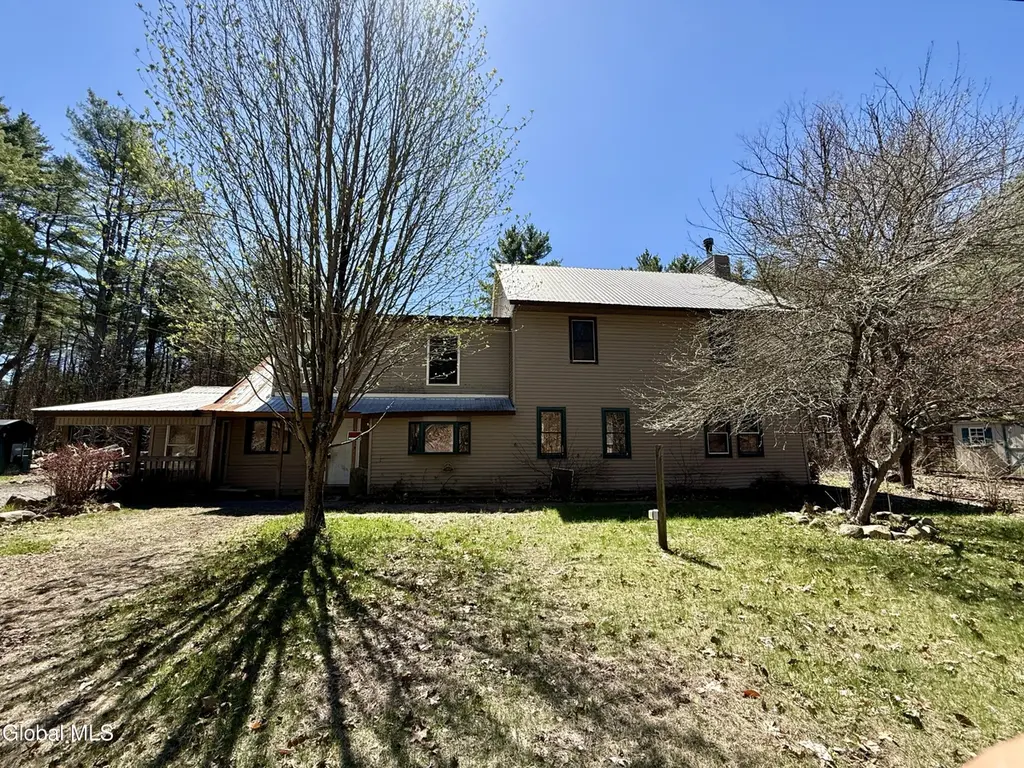
Opportunity to transform an enormous 3,648 sq ft Adirondack retreat on a semi-secluded . 71-acre lot. This home, originally built in 1950 and renovated in 1985, features rustic knotty pine interiors, including floors and walls, a large living room with a fireplace, an expansive dining area, and a generous open kitchen. The layout offers versatility with a front office or in-law suite on the main level and a first-floor bathroom/bedroom combo suitable for multi-generational living. The second floor is anchored by the primary bedroom, which includes an open space that previously housed plumbing for a potential en-suite bathroom, though buyers will need to verify feasibility. The property inc
Key facts
- 0.71 acre lot
- Garage
- Built 1950
Property features AI
Exterior
- Parking: One-car garage; Driveway; Total parking for 4 vehicles
- Utilities: Septic tank
- Home design: Single-family residence; Property listed in fixer condition; Lot about 0.71 acre
- Construction: Vinyl siding construction
- Exterior features: Metal roof; Vinyl siding
Interior
- Kitchen: Kitchen on first level; Appliances: Other
- Bedrooms: Primary bedroom on second level; Additional bedrooms on first and second levels
- Bathrooms: Two full bathrooms (both on first level)
- Interior features: Fireplace (1); Crawl space basement; Total of 12 rooms
Neighborhood map
What this means for you Summary
Snapshot
- This is a 5-bed/1.0-bath single-family listed at $150k.
Deal economics
- At list price, monthly cash flow is $1k ($18k/yr) — positive.
- The deal already cash-flows at list — no discount required.
- Meets the 1% rule at list price ($3k rent vs $150k).
- Recommended offer: $148k (1.5% below list) — sets the bar for market timing.
Location & tenants
- Location reads 65/100 on livability (#682 in NY) — a middle-class / working-renter tenant base. Strengths: housing A+, crime A; Watch: amenities F, commute F, health & safety D-.
- Hadley-Luzerne Central School District (rural): math 41% / reading 57% proficiency, ranked #396 of 590 in NY (top 67%) — families likely to look elsewhere, expect single-tenant / working-renter base with shorter leases.
- Zoned schools: Hadley-Luzerne Junior-Senior High School (math 62% / reading 67%, grade B-, #776 of 1,100 statewide, top 73%, 304 students, 54% FRL).
- Zoned-school proficiency averages 64% at this address vs 49% district-wide (+16 pts) — the actual schools serving this property are materially stronger than the Hadley-Luzerne Central School District average implies; a family-tenant draw the district grade alone would hide.
- Market conditions: 39 active listings in the ZIP; 180 units permitted in Warren County in 2024 (40 in 5+ unit buildings).
Forward outlook
- In year one you build about $16k of equity ($1k loan paydown + $15k appreciation (10.0% local appreciation)).
- Warren County population projected at -19% by 2050 — secular population decline; favor cash flow + early exit over multi-decade hold.
- At projected returns (10.0% appreciation + 3.0% rent growth), your $42k cash investment doubles in ~2 years — after that, you're playing with house money.
- By year 3, paydown + projected appreciation supports a ~$41k cash-out refi (75% LTV) — recoverable capital for the next deal without selling this one.
Negotiation context
- It's been on market 21 days — a 2% lower offer ($148k) is reasonable based on typical stale-listing flexibility.
- 2 sale attempts; this cycle's ask is 900% above the opening price — seller raised mid-cycle; expect resistance to lowballs.
- Current owner paid $36k; list at $150k implies a 317% gain — meaningful room to come down on a strong offer.
Risks & watch-outs
- Watch-outs: property tax is 3.0% of price; built in 1950 — expect roof / HVAC / electrical / plumbing capex.
Questions for the listing agent
- Built in 1950 — when were the roof, HVAC, electrical panel, plumbing, and water heater last replaced?
- Property tax is high relative to price — has the assessment been appealed recently, and will the sale trigger a re-assessment?
- Is there a deadline driving the sale (1031 exchange, divorce, estate, relocation)? That informs how much negotiation room exists.
- What's the average days-on-market for RENTAL listings here right now (not sales)? A rising rental-DOM trend means longer vacancies and softer asking-rent achievability than the comps imply.
- What's the recent tenant-quality profile in this submarket — average credit score on applications, eviction rate, late-payment / NSF rate, and stable-employment percentage? A property-management company in the area should have these aggregated.
- How much new for-sale + rental construction is in the pipeline within 1–3 miles? Heavy new supply typically softens prices + rents 12–24 months out; constrained supply supports both.
Investment metrics
- 1% rule
- 2.26% ✓
- Cap rate
- 18.00%
- Cash-on-cash
- 41.82%
- DSCR
- 2.86
- GRM
- 3.7
CMA / ARV
- ARV (median comp)
- $1,365,000
- List price
- $150,000
- Delta
- -89.01%
- Verdict
- UNDERPRICED
- Comps
- 1 within 2.0 mi
Projected returns pro-forma
10.0% appreciation · 3.0% rent growth · sell at horizon
- IRR
- 56.8%
- Equity multiple
- 5.17×
- Total profit
- $175,087
- Equity at exit
- $135,132
- IRR
- 50.3%
- Equity multiple
- 11.54×
- Total profit
- $442,611
- Equity at exit
- $291,417
Cash invested: $42,000 (down + closing). Projections, not guarantees.
Landlord ↔ Tenant lean methodology
- Overall (STATE)
- 15 Strongly Tenant-Friendly
- State New York
- 15 Strongly Tenant-Friendly · D+10
- County
- — inherits STATE
- City
- — inherits STATE
ZIP-level market 12846
- Home prices YoY
- 16.1%
- Active inventory
- 39
- Price-to-rent
- 3.7×
Monthly cashflow live
- Estimated rent
- $3,395 medium interval (Pro) →
- Mortgage (P&I)
- −$787
- Tax from tax record
- −$369 /mo · $4,428/yr
- Insurance
- −$62
- HOA
- −$0
- Vacancy / Maint / Mgmt
- −$713
- Net cashflow
- $1,464
Break-even live
UW: 25.0% down · 7.5% · 30yr · 1.5% tax · 5.0% vac · 8.0% maint · 8.0% mgmt
Financing live
Cash to close
- Down payment
- $37,500
- Closing costs
- $4,500
- Reserves months
- —
- Total cash needed
- —
Loan-product check · same deal, 3 products live
Conventional
25% down · 7.5% · 30yr
- Down + closing
- —
- Monthly P&I
- —
- Monthly cashflow
- —
- DSCR
- —
- Eligible?
- —
Personal DTI + credit; lowest rate.
DSCR
20% down · 8.5% · 30yr
- Down + closing
- —
- Monthly P&I
- —
- Monthly cashflow
- —
- DSCR
- —
- Eligible?
- —
No personal income docs; deal must DSCR.
Hard money
10% down · 12.0% · 12mo
- Down + closing
- —
- Monthly P&I
- —
- Monthly cashflow
- —
- DSCR
- —
- Eligible?
- —
Short-term bridge; refi at stabilization.
Listing history 5 events
-
2026-05-18status Active 1699-char remark
-
2026-05-06status Pending 1699-char remark
-
2026-04-25price $150,000 1699-char remark
-
2026-04-25$15,000 Active 1699-char remark
-
1997-11-28soldstatus $36,000
ⓘ Source: listings_history table (triggers on properties + properties_extension) + one-shot
backfill from property_details.listing_events for pre-trigger history.
Tax reassessment forecast NY · Partial reset (capped growth)
- Current annual tax
- $4,428 · $369/mo
- Projected year-2 tax
- $4,428 · $369/mo
- Expected delta
- $0/yr ($0/mo · 0.0%)
ⓘ Screening estimate from a state-policy table — verify with the county assessor before closing.
Climate risk First Street
- Flood 1/10 Low FEMA zone X · 0% chance over 30 yrs
- Wildfire 3/10 Moderate
- Heat 2/10 Low 7 d/yr ≥93°F today · 16 d/yr by 30 yrs out
- Wind 2/10 Low 2% chance of damaging wind over 30 yrs
- Air quality 1/10 Low 0 unhealthy d/yr today · 0 by 30 yrs out
Nearby sold comps map
Loading sold comps map…
Walkable amenities ~0.75 mi
Loading nearby amenities…
Taxation est. · year 1
- Rental income
- $40,738
- − Mortgage interest
- −$8,402
- − Property taxes
- −$4,428
- − Insurance
- −$750
- − Repairs & maintenance
- −$3,259
- − Management
- −$3,259
- − Depreciation
- −$4,364
- Taxable income
- $16,276
- Est. tax owed @ 24.0%
- −$3,906
- After-tax cash flow
- $13,659/yr
For passive investors: Depreciation is non-cash, so a rental often shows a tax loss while cash-flowing — sheltering income. Rental losses are passive: they offset passive income freely, and up to $25,000/yr can offset ordinary (W-2) income if you actively participate and your MAGI is under $100k (phasing out to $0 by $150k); unused losses carry forward. On sale, claimed depreciation is recaptured at up to 25%, and gains may owe capital-gains tax (a 1031 exchange can defer both). Figures are a year-1 estimate at your 24.0% rate — not tax advice; consult a CPA.
Schools (NCES district)
- District
- Hadley-Luzerne Central School District
- NCES district ID
- 3613110
- Math proficiency
- 41% ▼ -15.00%
- Reading proficiency
- 57% ▲ 2.00%
- Median HH income
- $52,974
- Composite
- 42.18/100
- National rank
- #3292
- State rank
- #396 of 590 in NY
Livability — Lake Luzerne
- Score
- 65/100
- State rank
- #682
- US rank
- #12851
Category grades
Schools grade is shown separately in the Schools card above.
Census & demographics
- Population (ZIP)
- 3,007
Population outlook (Warren County) Hauer SSP2
- Today (2025)
- 62,372 people
- By 2030
- 60,491 · -3.0%
- By 2040
- 55,616 · -10.8%
- By 2050
- 50,437 · -19.1%
- By 2075
- 40,843 · -34.5%
- By 2100
- 31,159 · -50.0%
Race, ethnicity, and origin ACS 2023
- Neighborhood character
- Predominantly White (98%)
- Race & ethnicity
- White 98%
- Common ancestry
- Romanian 10% Lithuanian 10% German 5%
- Foreign-born
- 1% · Canada
Political lean MEDSL · Warren
- 2024 margin
- Toss-up / Even · D 47.9% · R 52.1%
- 2008→2024 swing
- -6.9pp toward R · 2008: 2.6pp · 2024: -4.2pp
- All cycles
- 2024: R+4.2 2020: R+0.2 2016: R+10.6 2012: D+2.1 2008: D+2.6
Not yet ingested
- Civics
- —
Market trends
- HPI YoY
- ▲ 46.73%
- Current HPI
- 336.2179
- Rent YoY
- —
- Metro
- —
- State GDP YoY
- ▲ 2.60%
- F500 in state
- 92
Industry mix (Fortune 500 HQ in NY)
| Industry | F500 HQs | Revenue |
|---|---|---|
| Financial Services | 10 | $950B |
|
||
| Consumer Goods | 9 | $162B |
|
||
| Insurance | 4 | $225B |
|
||
| Telecommunications | 2 | $144B |
|
||
| Pharmaceuticals | 2 | $112B |
|
||
| Media / Entertainment | 2 | $69B |
|
||
Price history
+316.7% since first listed6 events — show timeline
- 2026-05-29 Pending — Global MLS
- 2026-05-18 Relisted — Global MLS
- 2026-05-06 Pending — Global MLS
- 2026-04-25 Price Changed $150,000 Global MLS
- 2026-04-25 Listed $15,000 Global MLS
- 1997-11-28 Sold (Public Records) $36,000 Public Records
Property tax history
+2.5%/yrLatest (2025): $4,428 · +5.1% YoY. Source: county tax records.
Cash-flow waterfall
monthlySold comps — $/sqft
last 12 mo · ≤1 miLoading sold comps…