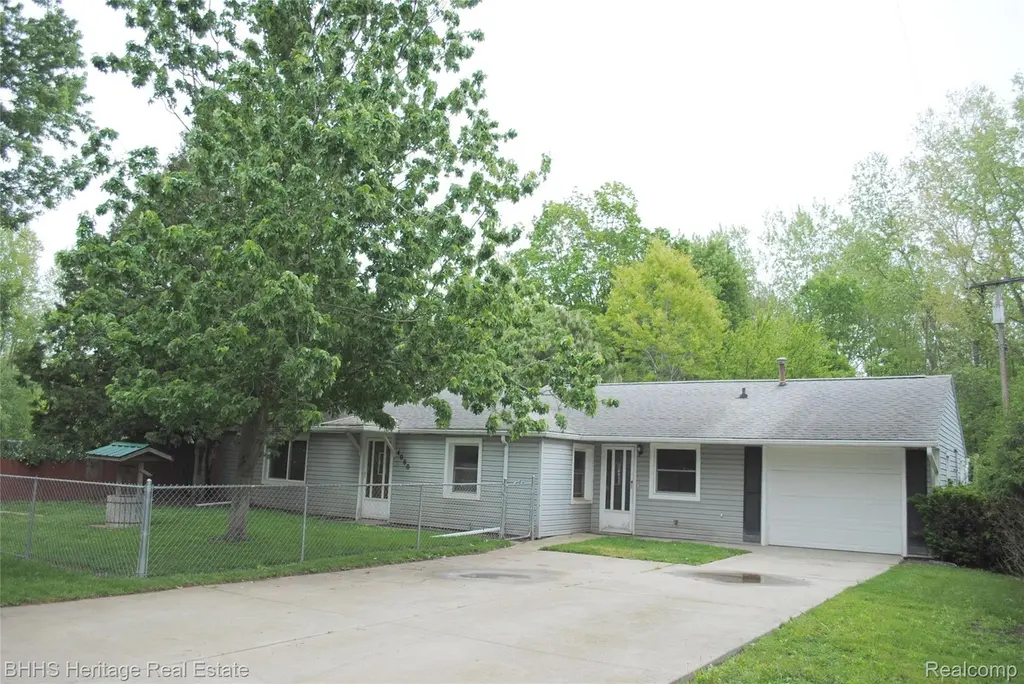
4080 Potts Rd · Fowlerville, MI
Flood risk 1/10 · Minimal
- FEMA flood zone
- X (unshaded)
- Chance of flooding over 30 yrs
- 0.0%
- Est. flood insurance / yr
- $507 – $1,088
Fire risk 1/10 · Minimal
- Est. fire insurance / yr
- $784 – $1,456
Heat risk 2/10 · Minimal
- Hot days now (above 96°F)
- 7 days/yr
- Hot days in 30 yrs
- 15 days/yr
Wind risk 2/10 · Minimal
- Chance of severe wind over 30 yrs
- —
Air-quality risk 2/10 · Minimal
- Unhealthy air days now
- 1 days/yr
- Unhealthy air days in 30 yrs
- 2 days/yr
Risk factors via First Street. Map © Google.
Why this score? — see what drove the D+ grade
The composite is a weighted blend of 9 inputs, each scored 0–100. Each bar is that input's sub-score; the figure is the points it added to the 100-point composite (weight × sub-score).
- Cash flow +15.1/30.0
- ARV discount +15.0/15.0
- DSCR +4.6/10.0
- 1% rule +3.3/10.0
- Livability +3.3/5.0
- Schools +3.2/10.0
- Rent growth +2.5/5.0
- Condition / age +2.5/5.0
- Appreciation +0.0/10.0
$125,000
🖨 Deal sheet (PDF) 📄 Offer letter ✓ Due diligence
Listing remarks MLS
Here we have a fixer upper / handi man special that features just under 1000 sq foot, 2 bedroom with a bonus area, large living room, Kitchen with eating area, 1 full bath, large mud room and drive through attached garage. Home has air conditioning, full house generator, water tight roof and furnace. Sits on about 1/4 acre of land, has a fenced area in the front and large shed in the rear yard. Priced to sell fast!
Key facts
- Air conditioning
- Eating area
- Large living room
Tags
Property features AI
Finance
- Other: Pets allowed
Exterior
- Parking: Attached garage with direct access and drive-through; garage faces front (1 garage space)
- Utilities: Private well water; Septic tank sewer
- Home design: Single-family residence; One level; Ground-level entry with steps
- Construction: Vinyl siding; Asphalt roof; Slab foundation; Built area above grade: 936 square feet
- Exterior features: Porch; Exterior lighting; Gravel road access
Interior
- Bathrooms: 1 full bathroom
- Heating & cooling: Central air conditioning; Forced air heating (natural gas)
- Interior features: Electric water heater; 6 total rooms
Neighborhood map
What this means for you Summary
Snapshot
- This is a 2-bed/1.0-bath single-family listed at $125k.
Deal economics
- At list price, monthly cash flow is $42 ($501/yr) — positive.
- The deal already cash-flows at list — no discount required.
- To meet the 1% rule (rent ≥ 1% of price), the offer needs to be $104k (16.7% below list).
- Recommended offer: $104k (16.7% below list) — sets the bar for 1% rule.
- Cap rate 6.7% vs local median 2.6% in Fowlerville — top-decile yield for the area; either an underpriced asset or a hidden risk that comps aren't pricing in. Stress-test before assuming the spread holds.
Location & tenants
- Location reads 66/100 on livability (#440 in MI) — a middle-class / working-renter tenant base. Strengths: cost of living A+, housing A+; Watch: crime D, employment D, amenities F.
- Fowlerville Community Schools (town): math 30% / reading 42% proficiency, ranked #240 of 540 in MI (top 44%) — families likely to look elsewhere, expect single-tenant / working-renter base with shorter leases.
- Zoned schools: Natalie Kreeger Elementary School (math 28% / reading 35%, grade F, #850 of 1,397 statewide, top 61%, 554 students, 43% FRL); Fowlerville Junior High School (math 30% / reading 47%, grade F, #228 of 493 statewide, top 47%, 578 students, 42% FRL); Fowlerville High School (math 32% / reading 47%, grade F, #304 of 713 statewide, top 46%, 847 students, 34% FRL).
- Market conditions: 117 active listings in the ZIP; 3 comparable units currently listed for rent nearby; rentals at typical pace (median 27d on market — plan ~3-4 weeks tenant-placement turnaround); 488 units permitted in Livingston County in 2024 (0 in 5+ unit buildings).
Forward outlook
- Local home prices are declining (-3.0%/yr); year-one equity from $864 of loan paydown is wiped out by about $4k of value loss. Plan a longer hold.
- Livingston County population projected at +7% by 2050 — modest demand growth; plan on rents tracking national, not racing it.
Negotiation context
- Only 5 days on market — expect competitive offers; lowballing is unlikely to land.
- 4 sale attempts with the ask held roughly flat each time — persistent listings suggest the price (not the market) is what's stuck; bring a comps-based counter.
Risks & watch-outs
- Watch-outs: built in 1952 — expect roof / HVAC / electrical / plumbing capex.
Questions for the listing agent
- Built in 1952 — when were the roof, HVAC, electrical panel, plumbing, and water heater last replaced?
- Is there a deadline driving the sale (1031 exchange, divorce, estate, relocation)? That informs how much negotiation room exists.
- Crime grade is D in this area — have there been break-ins, vandalism, or insurance claims at this property in the last 3 years? What carrier currently insures it and at what premium?
- The area grade is low — what's the realistic commute time and amenity access for the typical tenant pool here? Any planned neighborhood developments (good or bad) we should know about?
- What's the average days-on-market for RENTAL listings here right now (not sales)? A rising rental-DOM trend means longer vacancies and softer asking-rent achievability than the comps imply.
- What's the recent tenant-quality profile in this submarket — average credit score on applications, eviction rate, late-payment / NSF rate, and stable-employment percentage? A property-management company in the area should have these aggregated.
- How much new for-sale + rental construction is in the pipeline within 1–3 miles? Heavy new supply typically softens prices + rents 12–24 months out; constrained supply supports both.
Investment metrics
- 1% rule
- 0.83% ✗
- Cap rate
- 6.69%
- Cash-on-cash
- 1.43%
- DSCR
- 1.06
- GRM
- 10.0
CMA / ARV
- ARV (on-the-fly)
- $221,832
- Comps found
- 2
Show comp detail 2 sales within ~0.75 mi
| Address | Dist | Beds/Ba | Sqft | Sold | Price | $/sf | Match |
|---|---|---|---|---|---|---|---|
| 4080 Potts Rd | 0.00mi | 2/1.0 | 936 (0%) | 0mo | $125,000 | $134 | 100 |
| 9220 W Grand River Rd | 0.39mi | 2/1.0 | 908 (-3%) | 22mo | $215,000 | $237 | 58 |
Match score weights: distance 35% · size 25% · config 20% · recency 20%. Top-matched comps best support the ARV.
Projected returns pro-forma
-3.0% appreciation · 3.0% rent growth · sell at horizon
- IRR
- -14.1%
- Equity multiple
- 0.50×
- Total profit
- $-17,633
- Equity at exit
- $18,638
- IRR
- -5.3%
- Equity multiple
- 0.65×
- Total profit
- $-12,075
- Equity at exit
- $10,808
Cash invested: $35,000 (down + closing). Projections, not guarantees.
Landlord ↔ Tenant lean methodology
- Overall (STATE)
- 62 Landlord-Friendly
- State Michigan
- 62 Landlord-Friendly · EVEN
- County
- — inherits STATE
- City
- — inherits STATE
ZIP-level market 48836
- Active inventory
- 117
- Price-to-rent
- 10.0×
Monthly cashflow live
- Estimated rent
- $1,041 medium interval (Pro) →
- Mortgage (P&I)
- −$656
- Tax from tax record
- −$73 /mo · $881/yr
- Insurance
- −$52
- HOA
- −$0
- Vacancy / Maint / Mgmt
- −$219
- Net cashflow
- $42
Break-even live
Sensitivity live
| Price | -10% $112 | -5% $77 | +0% $42 | +5% $6 | +10% $-29 |
|---|---|---|---|---|---|
| Rent | -10% $-41 | -5% $1 | +0% $42 | +5% $83 | +10% $124 |
| Rate | -1.0pp $105 | -0.5pp $74 | base $42 | +0.5pp $9 | +1.0pp $-24 |
UW: 25.0% down · 7.5% · 30yr · 1.5% tax · 5.0% vac · 8.0% maint · 8.0% mgmt
Financing live
Cash to close
- Down payment
- $31,250
- Closing costs
- $3,750
- Reserves months
- —
- Total cash needed
- —
Loan-product check · same deal, 3 products live
Conventional
25% down · 7.5% · 30yr
- Down + closing
- —
- Monthly P&I
- —
- Monthly cashflow
- —
- DSCR
- —
- Eligible?
- —
Personal DTI + credit; lowest rate.
DSCR
20% down · 8.5% · 30yr
- Down + closing
- —
- Monthly P&I
- —
- Monthly cashflow
- —
- DSCR
- —
- Eligible?
- —
No personal income docs; deal must DSCR.
Hard money
10% down · 12.0% · 12mo
- Down + closing
- —
- Monthly P&I
- —
- Monthly cashflow
- —
- DSCR
- —
- Eligible?
- —
Short-term bridge; refi at stabilization.
Rent comps 3 comps
| Address | Beds | Baths | Sqft | Rent | $/sqft | DOM | Units | Dist |
|---|---|---|---|---|---|---|---|---|
| 332 Garden Ln Fowlerville, MI | 2.0 | 1.0 | 900 | $995 | $1.11 | 26d | 1 | 1.29mi |
| 271 Garden Ln Fowlerville, MI | 2.0 | 1.0 | 975 | $1,125 | $1.15 | 0d | 1 | 1.36mi |
| 220 W Frank St Fowlerville, MI | 1.0 | 1.0 | 750 | $1,000 | $1.33 | 45d | 1 | 1.37mi |
Listing history 5 events
-
2026-05-24$125,000 Active
Show marketing remark (418 chars)
Here we have a fixer upper / handi man special that features just under 1000 sq foot, 2 bedroom with a bonus area, large living room, Kitchen with eating area, 1 full bath, large mud room and drive through attached garage. Home has air conditioning, full house generator, water tight roof and furnace. Sits on about 1/4 acre of land, has a fenced area in the front and large shed in the rear yard. Priced to sell fast!
-
2026-05-24$125,000 Active 418-char remark
Show marketing remark (418 chars)
Here we have a fixer upper / handi man special that features just under 1000 sq foot, 2 bedroom with a bonus area, large living room, Kitchen with eating area, 1 full bath, large mud room and drive through attached garage. Home has air conditioning, full house generator, water tight roof and furnace. Sits on about 1/4 acre of land, has a fenced area in the front and large shed in the rear yard. Priced to sell fast!
-
2026-03-05historical
-
2026-03-03$159,900 Active
-
2026-03-03$159,900 Active
ⓘ Source: listings_history table (triggers on properties + properties_extension) + one-shot
backfill from property_details.listing_events for pre-trigger history.
Tax reassessment forecast MI · Partial reset (capped growth)
- Current annual tax
- $881 · $73/mo
- Projected year-2 tax
- $1,403 · $117/mo
- Expected delta
- +$522/yr (+$44/mo · 59.3%)
ⓘ Screening estimate from a state-policy table — verify with the county assessor before closing.
Climate risk First Street
- Flood 1/10 Low FEMA zone X (unshaded) · 0% chance over 30 yrs
- Wildfire 1/10 Low
- Heat 2/10 Low 7 d/yr ≥96°F today · 15 d/yr by 30 yrs out
- Wind 2/10 Low
- Air quality 2/10 Low 1 unhealthy d/yr today · 2 by 30 yrs out
Nearby sold comps map
Loading sold comps map…
Walkable amenities ~0.75 mi
Loading nearby amenities…
Taxation est. · year 1
- Rental income
- $12,497
- − Mortgage interest
- −$7,002
- − Property taxes
- −$881
- − Insurance
- −$625
- − Repairs & maintenance
- −$1,000
- − Management
- −$1,000
- − Depreciation
- −$3,636
- Taxable loss
- −$1,647
- Est. tax savings @ 24.0%
- +$395
- After-tax cash flow
- $896/yr
For passive investors: Depreciation is non-cash, so a rental often shows a tax loss while cash-flowing — sheltering income. Rental losses are passive: they offset passive income freely, and up to $25,000/yr can offset ordinary (W-2) income if you actively participate and your MAGI is under $100k (phasing out to $0 by $150k); unused losses carry forward. On sale, claimed depreciation is recaptured at up to 25%, and gains may owe capital-gains tax (a 1031 exchange can defer both). Figures are a year-1 estimate at your 24.0% rate — not tax advice; consult a CPA.
Schools (NCES district)
- District
- Fowlerville Community Schools
- NCES district ID
- 2614730
- Math proficiency
- 30% ▼ -10.00%
- Reading proficiency
- 42% ▼ -5.00%
- Median HH income
- $62,306
- Composite
- 32.31/100
- National rank
- #5748
- State rank
- #240 of 540 in MI
Livability — Fowlerville
- Score
- 66/100
- State rank
- #440
- US rank
- #12262
Category grades
Schools grade is shown separately in the Schools card above.
Census & demographics
- City population
- 14,978
- Population (ZIP)
- 14,978
Population outlook (Livingston County) Hauer SSP2
- Today (2025)
- 202,920 people
- By 2030
- 209,173 · +3.1%
- By 2040
- 216,878 · +6.9%
- By 2050
- 217,485 · +7.2%
- By 2075
- 217,590 · +7.2%
- By 2100
- 197,095 · -2.9%
Race, ethnicity, and origin ACS 2023
- Neighborhood character
- Predominantly White (96%)
- Race & ethnicity
- White 96% Two or more races 2%
- Common ancestry
- Romanian 7% Italian 6% Lithuanian 4%
- Foreign-born
- 1%
Political lean MEDSL · Livingston
- 2024 margin
- Strong R (+23.9) · D 37.4% · R 61.3% · Other 1.3%
- 2008→2024 swing
- -10.7pp toward R · 2008: -13.3pp · 2024: -23.9pp
- All cycles
- 2024: R+23.9 2020: R+22.6 2016: R+29.6 2012: R+23.3 2008: R+13.3
Not yet ingested
- Civics
- —
Market trends
- HPI YoY
- ▼ -150.44%
- Current HPI
- 201.7919
- Rent YoY
- —
- Metro
- —
- State GDP YoY
- ▲ 1.37%
- F500 in state
- 28
Industry mix (Fortune 500 HQ in MI)
| Industry | F500 HQs | Revenue |
|---|---|---|
| Automotive Parts | 3 | $48B |
|
||
| Automotive | 2 | $372B |
|
||
| Chemicals | 1 | $45B |
|
||
| Automotive Retail | 1 | $29B |
|
||
| Healthcare / Medical Devices | 1 | $23B |
|
||
| Automotive Technology | 1 | $20B |
|
||
Price history
-21.8% since first listed5 events — show timeline
- 2026-05-24 Listed $125,000 REALCOMP
- 2026-05-24 Listed $125,000 MiRealSource-MiMLS
- 2026-03-05 Listing Removed — MiRealSource-MiMLS
- 2026-03-03 Listed $159,900 REALCOMP
- 2026-03-03 Listed $159,900 MiRealSource-MiMLS
Property tax history
+3.1%/yrLatest (2025): $881 · +3.0% YoY. Source: county tax records.
Cash-flow waterfall
monthlySold comps — $/sqft
last 12 mo · ≤1 miLoading sold comps…