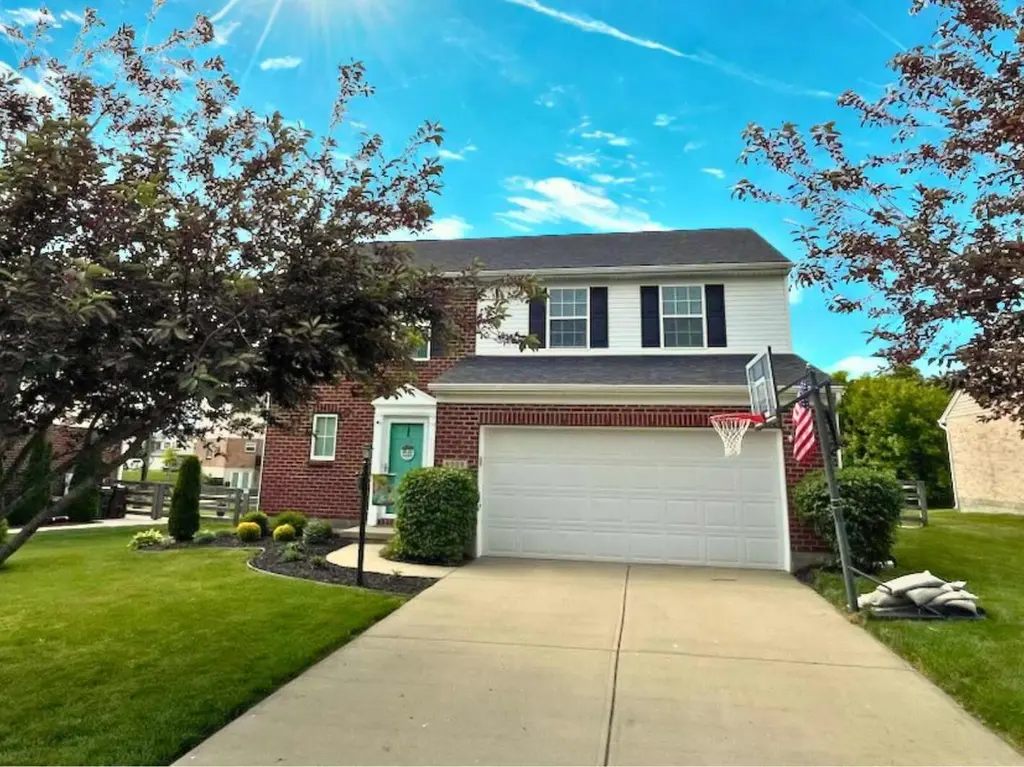
6359 Alexandra Ct · Independence, KY
Flood risk 1/10 · Minimal
- FEMA flood zone
- X (unshaded)
- Chance of flooding over 30 yrs
- 0.0%
- Est. flood insurance / yr
- $507 – $1,088
Fire risk 1/10 · Minimal
- Est. fire insurance / yr
- $839 – $1,559
Heat risk 4/10 · Minor
- Hot days now (above 103°F)
- 7 days/yr
- Hot days in 30 yrs
- 19 days/yr
Wind risk 2/10 · Minimal
- Chance of severe wind over 30 yrs
- 1.0%
Air-quality risk 3/10 · Minor
- Unhealthy air days now
- 2 days/yr
- Unhealthy air days in 30 yrs
- 3 days/yr
Risk factors via First Street. Map © Google.
Why this score? — see what drove the D grade
The composite is a weighted blend of 9 inputs, each scored 0–100. Each bar is that input's sub-score; the figure is the points it added to the 100-point composite (weight × sub-score).
- ARV discount +15.0/15.0
- Cash flow +8.9/30.0
- Schools +4.0/10.0
- Rent growth +3.8/5.0
- Livability +3.6/5.0
- DSCR +2.5/10.0
- Condition / age +2.5/5.0
- 1% rule +2.3/10.0
- Appreciation +0.0/10.0
$300,000
🖨 Deal sheet (PDF) 📄 Offer letter ✓ Due diligence
Listing remarks MLS
100% Financing Available Through USDA/Rural Housing on this immaculate brick wrapped home boasting of an open floor plan-maintenance free laminate throughout the 1st floor-ample natural light-neutral décor-custom built kitchen island accented by open shelving-morning room featuring cathedral ceilings-oversized master suite-2nd floor laundry-fenced yard, paver stone patio, meticulous landscaping & so much more!
Key facts
- Open floor plan
- Walk-in closet
- Ensuite bath
Tags
Property features AI
Finance
- Financial info: Home warranty included
- HOA & community: Annual association fee of $185; Has association
Exterior
- Parking: Driveway; 2-car attached garage with garage door opener (garage faces front)
- Utilities: Public water; Public sewer; Natural gas available; Sewer available; Water available
- Home design: Single family residence; Two levels; Existing structure; Built in 2010
- Construction: Brick and vinyl siding; Shingle roof; Slab foundation
- Exterior features: Patio; Split rail fencing; City street frontage
Interior
- Kitchen: Electric Range; Dishwasher; Microwave; Refrigerator
- Bedrooms: Primary bedroom (18 x 11); Bedroom 2 (15 x 12); Bedroom 3 (11 x 9)
- Bathrooms: 2 full bathrooms; 1 half bathroom; Primary bath (10 x 5); Bathroom (7 x 5); Bathroom (6 x 3)
- Heating & cooling: Forced air heating; Central air conditioning
- Interior features: Open floorplan; High ceilings; Recessed lighting; Ceiling fan(s); Built-in features; Bookcases; Kitchen island; Pantry; Laminate counters; Eat-in kitchen
- Laundry & utility: Washer hookup; Electric dryer hookup (upper level)
Neighborhood map
What this means for you Summary
Snapshot
- This is a 3-bed/2.5-bath single-family listed at $300k.
Deal economics
- At list price, monthly cash flow is $-242 ($-3k/yr) — negative.
- To cash-flow at today's rent, offer at most $257k (14.2% below list).
- To meet the 1% rule (rent ≥ 1% of price), the offer needs to be $220k (26.8% below list).
- Recommended offer: $220k (26.8% below list) — sets the bar for 1% rule.
- Cap rate 5.3% vs local median 3.7% in Independence — top-decile yield for the area; either an underpriced asset or a hidden risk that comps aren't pricing in. Stress-test before assuming the spread holds.
Location & tenants
- Location reads 72/100 on livability (#130 in KY) — a middle-class / working-renter tenant base. Strengths: crime A+, employment A+, cost of living A+; Watch: amenities F, commute F, health & safety F.
- Kenton County (suburban): math 42% / reading 48% proficiency, ranked #14 of 165 in KY (top 8%) — families likely to look elsewhere, expect single-tenant / working-renter base with shorter leases.
- Zoned schools: White'S Tower Elementary School (math 60% / reading 64%, grade B, #24 of 676 statewide, top 4%, 631 students, 41% FRL); Woodland Middle School (math 38% / reading 50%, grade D, #40 of 217 statewide, top 19%, 616 students, 48% FRL); Scott High School (math 33% / reading 33%, grade F, #94 of 254 statewide, top 37%, 1,071 students, 42% FRL).
- Market conditions: Rents rising fast (+5.4%/yr); 258 active listings in the ZIP; solid renter incomes; 699 units permitted in Kenton County in 2024 (287 in 5+ unit buildings).
Forward outlook
- Local home prices are declining (-3.0%/yr); year-one equity from $2k of loan paydown is wiped out by about $9k of value loss. Plan a longer hold.
- Kenton County population projected at +5% by 2050 — modest demand growth; plan on rents tracking national, not racing it.
Negotiation context
- Only 2 days on market — expect competitive offers; lowballing is unlikely to land.
- 4 sale attempts since 16y ago with the ask held roughly flat each time — persistent listings suggest the price (not the market) is what's stuck; bring a comps-based counter.
- Current owner paid $215k; 40% above their basis — modest negotiation headroom, anchor on the comps not their cost.
Questions for the listing agent
- What do current leases actually rent for vs. the listed asking? Can we see a recent rent roll and the last 12 months of T-12 income?
- What does the HOA fee cover, when was the last increase, and are there any pending special assessments or reserve-fund shortfalls?
- Is there a deadline driving the sale (1031 exchange, divorce, estate, relocation)? That informs how much negotiation room exists.
- Schools are B-rated — typically a magnet for longer-tenancy family renters. What's the average tenant stay here, and is there a school-zone premium baked into asking?
- The area grade is low — what's the realistic commute time and amenity access for the typical tenant pool here? Any planned neighborhood developments (good or bad) we should know about?
- What's the average days-on-market for RENTAL listings here right now (not sales)? A rising rental-DOM trend means longer vacancies and softer asking-rent achievability than the comps imply.
- What's the recent tenant-quality profile in this submarket — average credit score on applications, eviction rate, late-payment / NSF rate, and stable-employment percentage? A property-management company in the area should have these aggregated.
- How much new for-sale + rental construction is in the pipeline within 1–3 miles? Heavy new supply typically softens prices + rents 12–24 months out; constrained supply supports both.
Investment metrics
- 1% rule
- 0.73% ✗
- Cap rate
- 5.33%
- Cash-on-cash
- -3.46%
- DSCR
- 0.85
- GRM
- 11.4
CMA / ARV
- ARV (median comp)
- $363,008
- List price
- $300,000
- Delta
- -17.36%
- Verdict
- UNDERPRICED
- Comps
- 20 within 1.0 mi
Show comp detail 12 sales within ~0.75 mi
| Address | Dist | Beds/Ba | Sqft | Sold | Price | $/sf | Match |
|---|---|---|---|---|---|---|---|
| 748 Stablewatch Dr | 0.49mi | 3/3.0 | 1,858 (+3%) | 2mo | $360,000 | $194 | 68 |
| 794 Stonybrook Ct | 0.50mi | 3/2.0 | 1,727 (-4%) | 4mo | $374,900 | $217 | 65 |
| 3115 Summit Run Dr | 0.51mi | 4/2.5 (+1) | 1,833 (+2%) | 5mo | $330,000 | $180 | 64 |
| 798 Stonybrook Ct | 0.50mi | 3/2.5 | 1,918 (+7%) | 2mo | $399,900 | $208 | 64 |
| 6314 Filly Ct | 0.46mi | 4/2.5 (+1) | 1,742 (-3%) | 6mo | $337,000 | $193 | 63 |
| 787 Stablewatch Dr | 0.36mi | 4/2.5 (+1) | 1,950 (+8%) | 4mo | $347,000 | $178 | 61 |
| 3146 Meadoway Ct | 0.65mi | 3/2.5 | 1,700 (-6%) | 7mo | $286,500 | $169 | 55 |
| 9738 Cloveridge Dr | 0.49mi | 4/2.5 (+1) | 1,603 (-11%) | 3mo | $300,000 | $187 | 52 |
| 3199 Summitrun Dr | 0.69mi | 3/2.5 | 2,000 (+11%) | 2mo | $325,000 | $163 | 47 |
| 6451 Lakearbor Dr | 0.50mi | 4/3.5 (+1) | 1,971 (+10%) | 10mo | $320,000 | $162 | 44 |
| 3185 Meadoway Ct | 0.72mi | 3/2.5 | 1,603 (-11%) | 9mo | $280,000 | $175 | 40 |
| 6346 Stallion Ct | 0.63mi | 3/2.5 | 1,546 (-14%) | 9mo | $369,900 | $239 | 40 |
Match score weights: distance 35% · size 25% · config 20% · recency 20%. Top-matched comps best support the ARV.
Projected returns pro-forma
-3.0% appreciation · 5.37% rent growth · sell at horizon
- IRR
- -19.6%
- Equity multiple
- 0.30×
- Total profit
- $-58,691
- Equity at exit
- $44,731
- IRR
- -8.3%
- Equity multiple
- 0.43×
- Total profit
- $-47,970
- Equity at exit
- $25,939
Cash invested: $84,000 (down + closing). Projections, not guarantees.
Landlord ↔ Tenant lean methodology
- Overall (STATE)
- 83 Strongly Landlord-Friendly
- State Kentucky
- 83 Strongly Landlord-Friendly · R+16
- County
- — inherits STATE
- City
- — inherits STATE
ZIP-level market 41051
- Home prices YoY
- -32.6%
- Rents YoY
- 5.4%
- Active inventory
- 258
- Price-to-rent
- 11.4×
Monthly cashflow live
- Estimated rent
- $2,196 medium interval (Pro) →
- Mortgage (P&I)
- −$1,573
- Tax from tax record
- −$263 /mo · $3,161/yr
- Insurance
- −$125
- HOA
- −$15
- Vacancy / Maint / Mgmt
- −$461
- Net cashflow
- $-242
Break-even live
Sensitivity live
| Price | -10% $-72 | -5% $-157 | +0% $-242 | +5% $-327 | +10% $-412 |
|---|---|---|---|---|---|
| Rent | -10% $-415 | -5% $-329 | +0% $-242 | +5% $-155 | +10% $-69 |
| Rate | -1.0pp $-91 | -0.5pp $-166 | base $-242 | +0.5pp $-320 | +1.0pp $-399 |
UW: 25.0% down · 7.5% · 30yr · 1.5% tax · 5.0% vac · 8.0% maint · 8.0% mgmt
Financing live
Cash to close
- Down payment
- $75,000
- Closing costs
- $9,000
- Reserves months
- —
- Total cash needed
- —
Loan-product check · same deal, 3 products live
Conventional
25% down · 7.5% · 30yr
- Down + closing
- —
- Monthly P&I
- —
- Monthly cashflow
- —
- DSCR
- —
- Eligible?
- —
Personal DTI + credit; lowest rate.
DSCR
20% down · 8.5% · 30yr
- Down + closing
- —
- Monthly P&I
- —
- Monthly cashflow
- —
- DSCR
- —
- Eligible?
- —
No personal income docs; deal must DSCR.
Hard money
10% down · 12.0% · 12mo
- Down + closing
- —
- Monthly P&I
- —
- Monthly cashflow
- —
- DSCR
- —
- Eligible?
- —
Short-term bridge; refi at stabilization.
HOA detail
- Monthly dues
- $15 · $180/yr
- Likely covers
- landscaping
Listing history 11 events
-
2026-05-17status Pending 1006-char remark
-
2026-05-15$300,000 Active 1006-char remark
-
2020-11-05soldstatus $215,000 Closed 424-char remark
Show marketing remark (424 chars)
100% Financing Available Through USDA/Rural Housing on this immaculate brick wrapped home boasting of an open floor plan-maintenance free laminate throughout the 1st floor-ample natural light-neutral décor-custom built kitchen island accented by open shelving-morning room featuring cathedral ceilings-oversized master suite-2nd floor laundry-fenced yard, paver stone patio, meticulous landscaping & so much more!
-
2020-09-28status Pending 424-char remark
Show marketing remark (424 chars)
100% Financing Available Through USDA/Rural Housing on this immaculate brick wrapped home boasting of an open floor plan-maintenance free laminate throughout the 1st floor-ample natural light-neutral décor-custom built kitchen island accented by open shelving-morning room featuring cathedral ceilings-oversized master suite-2nd floor laundry-fenced yard, paver stone patio, meticulous landscaping & so much more!
-
2020-09-25$215,000 Active 424-char remark
Show marketing remark (424 chars)
100% Financing Available Through USDA/Rural Housing on this immaculate brick wrapped home boasting of an open floor plan-maintenance free laminate throughout the 1st floor-ample natural light-neutral décor-custom built kitchen island accented by open shelving-morning room featuring cathedral ceilings-oversized master suite-2nd floor laundry-fenced yard, paver stone patio, meticulous landscaping & so much more!
-
2016-11-15soldstatus $155,500
-
2016-11-14soldstatus $155,500
Show marketing remark (200 chars)
Terrific home in the Hickory Valley subdivision. Features a fenced-in backyard, open kitchen and living room area as well as 2nd floor laundry! Master Bedroom has a large walk-in closet and Full Bath.
-
2016-09-12$155,000
Show marketing remark (200 chars)
Terrific home in the Hickory Valley subdivision. Features a fenced-in backyard, open kitchen and living room area as well as 2nd floor laundry! Master Bedroom has a large walk-in closet and Full Bath.
-
2013-05-30soldstatus $142,000
-
2010-05-20soldstatus $142,520
-
2010-02-15$142,520
ⓘ Source: listings_history table (triggers on properties + properties_extension) + one-shot
backfill from property_details.listing_events for pre-trigger history.
Tax reassessment forecast KY · Resets to sale price
- Current annual tax
- $3,161 · $263/mo
- Projected year-2 tax
- $3,161 · $263/mo
- Expected delta
- $0/yr ($0/mo · 0.0%)
ⓘ Screening estimate from a state-policy table — verify with the county assessor before closing.
Climate risk First Street
- Flood 1/10 Low FEMA zone X (unshaded) · 0% chance over 30 yrs
- Wildfire 1/10 Low
- Heat 4/10 Moderate 7 d/yr ≥103°F today · 19 d/yr by 30 yrs out
- Wind 2/10 Low 100% chance of damaging wind over 30 yrs
- Air quality 3/10 Moderate 2 unhealthy d/yr today · 3 by 30 yrs out
Nearby sold comps map
Loading sold comps map…
Walkable amenities ~0.75 mi
Loading nearby amenities…
Taxation est. · year 1
- Rental income
- $26,349
- − Mortgage interest
- −$16,805
- − Property taxes
- −$3,161
- − Insurance
- −$1,500
- − Repairs & maintenance
- −$2,108
- − Management
- −$2,108
- − HOA
- −$180
- − Depreciation
- −$8,727
- Taxable loss
- −$8,239
- Est. tax savings @ 24.0%
- +$1,977
- After-tax cash flow
- $-926/yr
For passive investors: Depreciation is non-cash, so a rental often shows a tax loss while cash-flowing — sheltering income. Rental losses are passive: they offset passive income freely, and up to $25,000/yr can offset ordinary (W-2) income if you actively participate and your MAGI is under $100k (phasing out to $0 by $150k); unused losses carry forward. On sale, claimed depreciation is recaptured at up to 25%, and gains may owe capital-gains tax (a 1031 exchange can defer both). Figures are a year-1 estimate at your 24.0% rate — not tax advice; consult a CPA.
Schools (NCES district)
- District
- Kenton County
- NCES district ID
- 2103090
- Math proficiency
- 42% ▼ -13.00%
- Reading proficiency
- 48% ▼ -14.00%
- Median HH income
- $66,183
- Composite
- 40.17/100
- National rank
- #3789
- State rank
- #14 of 165 in KY
Livability — Independence
- Score
- 72/100
- State rank
- #130
- US rank
- #6165
Category grades
Schools grade is shown separately in the Schools card above.
Census & demographics
- Census place
- Independence, KY
- County
- Kenton County · 142,881 people
- City population
- 33,054
- Metro
- Cincinnati, OH-KY-IN
- Population (ZIP)
- 33,054
- Household income
- $104,201
- Rent vs Own
- Severe rent burden
- 243.0
Population outlook (Kenton County) Hauer SSP2
- Today (2025)
- 174,205 people
- By 2030
- 177,897 · +2.1%
- By 2040
- 182,671 · +4.9%
- By 2050
- 183,543 · +5.4%
- By 2075
- 178,977 · +2.7%
- By 2100
- 159,920 · -8.2%
Race, ethnicity, and origin ACS 2023
- Neighborhood character
- Predominantly White (93%)
- Race & ethnicity
- White 93% Two or more races 3% Hispanic / Latino 2% Black 1% Asian 1%
- Common ancestry
- Italian 3% Lithuanian 3% Slovak 2%
- Foreign-born
- 3% · China, Canada
- Languages at home
- 96% English-only · Spanish 1% Chinese 1% Other Asian/Pacific 1%
Political lean MEDSL · Kenton
- 2024 margin
- Strong R (+21.7) · D 38.2% · R 59.9% · Other 1.9%
- 2008→2024 swing
- -0.9pp no change · 2008: -20.9pp · 2024: -21.7pp
- All cycles
- 2024: R+21.7 2020: R+19.3 2016: R+26.1 2012: R+24.3 2008: R+20.9
Not yet ingested
- Civics
- —
Market trends
- HPI YoY
- ▼ -105.60%
- Current HPI
- 218.492
- Rent YoY
- ▲ 5.37%
- Metro
- Cincinnati, OH-KY-IN
- State GDP YoY
- ▲ 1.81%
- F500 in state
- 4
Industry mix (Fortune 500 HQ in KY)
| Industry | F500 HQs | Revenue |
|---|---|---|
| Healthcare | 1 | $118B |
|
||
| Food / Beverage | 1 | $7B |
|
||
Price history
+110.5% since first listed11 events — show timeline
- 2026-05-17 Pending — NKMLS
- 2026-05-15 Listed $300,000 NKMLS
- 2020-11-05 Sold (MLS) $215,000 NKMLS
- 2020-09-28 Pending — NKMLS
- 2020-09-25 Listed $215,000 NKMLS
- 2016-11-15 Sold (Public Records) $155,500 Public Records
- 2016-11-14 Sold (MLS) $155,500 NKMLS
- 2016-09-12 Listed $155,000 NKMLS
- 2013-05-30 Sold (Public Records) $142,000 Public Records
- 2010-05-20 Sold (MLS) $142,520 NKMLS
- 2010-02-15 Listed $142,520 NKMLS
Property tax history
+5.2%/yrLatest (2025): $3,161 · +19.2% YoY. Source: county tax records.
Cash-flow waterfall
monthlySold comps — $/sqft
last 12 mo · ≤1 miLoading sold comps…