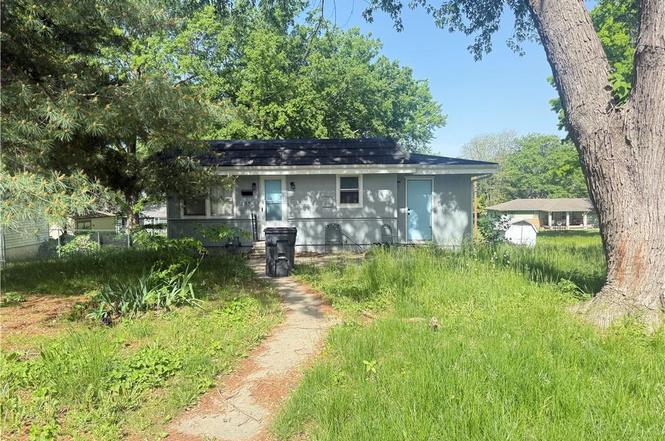
505 SW 18th St · Blue Springs, MO
Flood risk 1/10 · Minimal
- FEMA flood zone
- X (unshaded)
- Chance of flooding over 30 yrs
- 0.0%
- Est. flood insurance / yr
- $473 – $860
Fire risk 1/10 · Minimal
- Est. fire insurance / yr
- $1,054 – $1,958
Heat risk 4/10 · Minor
- Hot days now (above 107°F)
- 7 days/yr
- Hot days in 30 yrs
- 16 days/yr
Wind risk 2/10 · Minimal
- Chance of severe wind over 30 yrs
- —
Air-quality risk 4/10 · Minor
- Unhealthy air days now
- 5 days/yr
- Unhealthy air days in 30 yrs
- 5 days/yr
Risk factors via First Street. Map © Google.
Why this score? — see what drove the D+ grade
The composite is a weighted blend of 9 inputs, each scored 0–100. Each bar is that input's sub-score; the figure is the points it added to the 100-point composite (weight × sub-score).
- Cash flow +12.7/30.0
- ARV discount +11.1/15.0
- Schools +5.1/10.0
- Livability +4.1/5.0
- DSCR +3.8/10.0
- 1% rule +3.4/10.0
- Rent growth +2.8/5.0
- Condition / age +2.5/5.0
- Appreciation +0.0/10.0
$173,000
🖨 Deal sheet 📄 Offer letter ✓ Due diligence
Listing remarks MLS
BEAUTIFUL HOUSE ON AWESOME LOT!!! Don't miss this charmer with modern updates and conveniences. New kitchen!! newer flooring, HVAC, roof, gutters, exterior and interior paint and much more. So many uses for the extra room in the basement and the huge lot. Tandum 2 car garage is so roomy. The laundry room is a dream. Less than a mile from downtown Blue Springs. Add a detached garage? This house is move-in ready so pack up your stuff and make this one yours.
Key facts
- Quick access to i-70
- 0.37 acre lot
- 2 garage spots
Tags
Neighborhood map
What this means for you Summary
Snapshot
- This is a 3-bed/1.0-bath single-family listed at $173k.
Deal economics
- At list price, monthly cash flow is $-18 ($-215/yr) — negative.
- To cash-flow at today's rent, offer at most $170k (1.8% below list).
- To meet the 1% rule (rent ≥ 1% of price), the offer needs to be $144k (16.5% below list).
- Recommended offer: $144k (16.5% below list) — sets the bar for 1% rule.
- Cap rate 6.2% vs local median 3.2% in Blue Springs — top-decile yield for the area; either an underpriced asset or a hidden risk that comps aren't pricing in. Stress-test before assuming the spread holds.
Location & tenants
- Location reads 82/100 on livability (#11 in MO, #1,297 nationally) — a professional / high-income tenant draw. Strengths: cost of living A+, housing A+, health & safety A+; Watch: commute F.
- Blue Springs R-IV (suburban): math 55% / reading 60% proficiency, ranked #17 of 324 in MO (top 5%) — acceptable for families but not a draw, mixed tenant base, ~2y average lease.
- Zoned schools: Thomas J. Ultican Elem. (math 59% / reading 61%, grade B-, #120 of 1,115 statewide, top 11%, 430 students, 40% FRL); Blue Springs High (math 50% / reading 65%, grade C, #49 of 521 statewide, top 9%, 2,383 students, 28% FRL).
- Market conditions: Rents rising (+1.0%/yr); 141 active listings in the ZIP; 12 comparable units currently listed for rent nearby; rentals leasing fast (median 8d on market — plan ~1-2 weeks tenant-placement turnaround); solid renter incomes; 4,002 units permitted in Jackson County in 2024 (2,271 in 5+ unit buildings).
Forward outlook
- Local home prices are declining (-3.0%/yr); year-one equity from $1k of loan paydown is wiped out by about $5k of value loss. Plan a longer hold.
- Jackson County population projected at +4% by 2050 — modest demand growth; plan on rents tracking national, not racing it.
Negotiation context
- Only 8 days on market — expect competitive offers; lowballing is unlikely to land.
- 7 sale attempts since 5y ago with the ask held roughly flat each time — persistent listings suggest the price (not the market) is what's stuck; bring a comps-based counter.
Risks & watch-outs
- Watch-outs: built in 1956 — expect roof / HVAC / electrical / plumbing capex.
Questions for the listing agent
- What do current leases actually rent for vs. the listed asking? Can we see a recent rent roll and the last 12 months of T-12 income?
- Built in 1956 — when were the roof, HVAC, electrical panel, plumbing, and water heater last replaced?
- Is there a deadline driving the sale (1031 exchange, divorce, estate, relocation)? That informs how much negotiation room exists.
- Schools are A-rated — typically a magnet for longer-tenancy family renters. What's the average tenant stay here, and is there a school-zone premium baked into asking?
- The area grade is low — what's the realistic commute time and amenity access for the typical tenant pool here? Any planned neighborhood developments (good or bad) we should know about?
- What's the average days-on-market for RENTAL listings here right now (not sales)? A rising rental-DOM trend means longer vacancies and softer asking-rent achievability than the comps imply.
- What's the recent tenant-quality profile in this submarket — average credit score on applications, eviction rate, late-payment / NSF rate, and stable-employment percentage? A property-management company in the area should have these aggregated.
- How much new for-sale + rental construction is in the pipeline within 1–3 miles? Heavy new supply typically softens prices + rents 12–24 months out; constrained supply supports both.
Investment metrics
- 1% rule
- 0.84% ✗
- Cap rate
- 6.17%
- Cash-on-cash
- -0.44%
- DSCR
- 0.98
- GRM
- 10.0
CMA / ARV
- ARV (on-the-fly)
- $188,160
- Comps found
- 12
Show comp detail 12 sales within ~0.75 mi
| Address | Dist | Beds/Ba | Sqft | Sold | Price | $/sf | Match |
|---|---|---|---|---|---|---|---|
| 402 SW 17th St | 0.12mi | 2/1.0 (-1) | 806 (-4%) | 1mo | $210,000 | $261 | 82 |
| 503 SW 17th St | 0.06mi | 2/1.0 (-1) | 920 (+10%) | 9mo | $199,000 | $216 | 69 |
| 705 SW 17th St | 0.15mi | 3/1.0 | 926 (+10%) | 9mo | $215,000 | $232 | 68 |
| 1809 W Main St | 0.32mi | 2/1.0 (-1) | 800 (-5%) | 5mo | $190,000 | $238 | 68 |
| 318 SW 10th St | 0.47mi | 3/1.0 | 897 (+7%) | 6mo | $184,000 | $205 | 61 |
| 1201 SW South Ave | 0.34mi | 2/1.0 (-1) | 826 (-2%) | 20mo | $185,000 | $224 | 60 |
| 107 NW 16th St | 0.37mi | 2/1.0 (-1) | 794 (-6%) | 17mo | $159,000 | $200 | 54 |
| 1200 NW B St | 0.65mi | 2/1.0 (-1) | 884 (+5%) | 3mo | $195,000 | $221 | 54 |
| 320 SW 10th St | 0.47mi | 2/1.0 (-1) | 810 (-4%) | 22mo | $155,000 | $191 | 49 |
| 1108 NW B St | 0.66mi | 2/1.0 (-1) | 744 (-11%) | 10mo | $175,000 | $235 | 37 |
| 805 South Summit Cir | 0.66mi | 3/2.5 | 928 (+10%) | 13mo | $289,900 | $312 | 35 |
| 806 SW Walnut St | 0.57mi | 3/1.0 | 950 (+13%) | 20mo | $145,000 | $153 | 35 |
Match score weights: distance 35% · size 25% · config 20% · recency 20%. Top-matched comps best support the ARV.
Projected returns pro-forma
-3.0% appreciation · 1.01% rent growth · sell at horizon
- IRR
- -19.2%
- Equity multiple
- 0.34×
- Total profit
- $-32,010
- Equity at exit
- $25,795
- IRR
- -16.4%
- Equity multiple
- 0.16×
- Total profit
- $-40,528
- Equity at exit
- $14,958
Cash invested: $48,440 (down + closing). Projections, not guarantees.
Landlord ↔ Tenant lean methodology
- Overall (STATE)
- 81 Strongly Landlord-Friendly
- State Missouri
- 81 Strongly Landlord-Friendly · R+10
- County
- — inherits STATE
- City
- — inherits STATE
ZIP-level market 64015
- Rents YoY
- 1.0%
- Active inventory
- 141
- Price-to-rent
- 10.0×
Monthly cashflow live
- Estimated rent
- $1,445 high interval (Pro) →
- Mortgage (P&I)
- −$907
- Tax from tax record
- −$180 /mo · $2,161/yr
- Insurance
- −$72
- HOA
- −$0
- Vacancy / Maint / Mgmt
- −$303
- Net cashflow
- $-18
Break-even live
UW: 25.0% down · 7.5% · 30yr · 1.5% tax · 5.0% vac · 8.0% maint · 8.0% mgmt
Financing live
Cash to close
- Down payment
- $43,250
- Closing costs
- $5,190
- Reserves months
- —
- Total cash needed
- —
Loan-product check · same deal, 3 products live
Conventional
25% down · 7.5% · 30yr
- Down + closing
- —
- Monthly P&I
- —
- Monthly cashflow
- —
- DSCR
- —
- Eligible?
- —
Personal DTI + credit; lowest rate.
DSCR
20% down · 8.5% · 30yr
- Down + closing
- —
- Monthly P&I
- —
- Monthly cashflow
- —
- DSCR
- —
- Eligible?
- —
No personal income docs; deal must DSCR.
Hard money
10% down · 12.0% · 12mo
- Down + closing
- —
- Monthly P&I
- —
- Monthly cashflow
- —
- DSCR
- —
- Eligible?
- —
Short-term bridge; refi at stabilization.
Rent comps 12 comps
| Address | Beds | Baths | Sqft | Rent | $/sqft | DOM | Units | Dist |
|---|---|---|---|---|---|---|---|---|
| 402 SW 6 St Unit 402 Blue Springs, MO | 2.0 | 1.0 | 900 | $1,135 | $1.26 | 3d | 1 | 0.83mi |
| 212 NW 27th Street Ct Blue Springs, MO | 2.0 | 1.0 | 1080 | $1,325 | $1.23 | 43d | 1 | 0.85mi |
| 1200 SW 7th Ter Blue Springs, MO | 1.0–2.0 | 1.0–1.5 | 746 | $1,149 | $1.54 | 7d | 3 | 0.98mi |
| 2318 NW Chatham Pl Blue Springs, MO | 3.0 | 1.0 | 988 | $1,601 | $1.62 | 12d | 1 | 0.98mi |
| 258 NW Woods Chapel Rd Blue Springs, MO | 2.0 | 1.5 | 915 | $1,215 | $1.33 | 43d | 1 | 1.04mi |
| 256 NW Woods Chapel Rd Blue Springs, MO | 2.0 | 1.5 | 915 | $1,248 | $1.36 | 23d | 1 | 1.06mi |
| 1003 NW 12 St Blue Springs, MO | 3.0 | 2.0 | 1014 | $1,495 | $1.47 | 16d | 1 | 1.10mi |
| 128 N 1st St Blue Springs, MO | 3.0 | 2.0 | 1100 | $1,706 | $1.55 | 7d | 1 | 1.19mi |
| 2101 SW 8th St Unit d Blue Springs, MO | 2.0 | 1.0 | 1051 | $1,095 | $1.04 | 7d | 1 | 1.27mi |
| 1141 NW Arlington Pl Blue Springs, MO | 1.0–2.0 | 1.0 | 774 | $1,393 | $1.80 | 1d | 10 | 1.40mi |
| 1300 Candletree Dr Blue Springs, MO | 1.0–2.0 | 1.0–1.5 | 845 | $1,075 | $1.27 | 3d | 11 | 1.47mi |
| 101 NW Mock Ave Blue Springs, MO | 1.0–2.0 | 1.0–2.0 | 937 | $1,550 | $1.65 | 1d | 5 | 1.49mi |
Listing history 23 events
-
2026-02-21status Pending
-
2026-02-13$173,000 Active
-
2025-12-16historical
-
2025-10-28status Active
-
2025-08-22historical Active Under Contract
-
2025-08-06status Active
-
2025-06-27historical Active Under Contract
-
2025-06-03price $175,000
-
2025-05-07price $190,000
-
2025-04-15$200,000 Active
-
2023-07-18soldstatus
-
2023-07-17soldstatus Closed 460-char remark
Show marketing remark (460 chars)
BEAUTIFUL HOUSE ON AWESOME LOT!!! Don't miss this charmer with modern updates and conveniences. New kitchen!! newer flooring, HVAC, roof, gutters, exterior and interior paint and much more. So many uses for the extra room in the basement and the huge lot. Tandum 2 car garage is so roomy. The laundry room is a dream. Less than a mile from downtown Blue Springs. Add a detached garage? This house is move-in ready so pack up your stuff and make this one yours.
-
2023-06-16status Pending 460-char remark
Show marketing remark (460 chars)
BEAUTIFUL HOUSE ON AWESOME LOT!!! Don't miss this charmer with modern updates and conveniences. New kitchen!! newer flooring, HVAC, roof, gutters, exterior and interior paint and much more. So many uses for the extra room in the basement and the huge lot. Tandum 2 car garage is so roomy. The laundry room is a dream. Less than a mile from downtown Blue Springs. Add a detached garage? This house is move-in ready so pack up your stuff and make this one yours.
-
2023-06-05price $187,500 460-char remark
Show marketing remark (460 chars)
BEAUTIFUL HOUSE ON AWESOME LOT!!! Don't miss this charmer with modern updates and conveniences. New kitchen!! newer flooring, HVAC, roof, gutters, exterior and interior paint and much more. So many uses for the extra room in the basement and the huge lot. Tandum 2 car garage is so roomy. The laundry room is a dream. Less than a mile from downtown Blue Springs. Add a detached garage? This house is move-in ready so pack up your stuff and make this one yours.
-
2023-05-20$190,000 Active 460-char remark
Show marketing remark (460 chars)
BEAUTIFUL HOUSE ON AWESOME LOT!!! Don't miss this charmer with modern updates and conveniences. New kitchen!! newer flooring, HVAC, roof, gutters, exterior and interior paint and much more. So many uses for the extra room in the basement and the huge lot. Tandum 2 car garage is so roomy. The laundry room is a dream. Less than a mile from downtown Blue Springs. Add a detached garage? This house is move-in ready so pack up your stuff and make this one yours.
-
2021-04-27soldstatus
-
2021-04-23soldstatus Closed
-
2021-04-01status Pending
-
2021-03-26status Active
-
2021-03-23status Pending
-
2021-03-19$160,000 Active
-
2016-03-11soldstatus
-
2009-06-25soldstatus
ⓘ Source: listings_history table (triggers on properties + properties_extension) + one-shot
backfill from property_details.listing_events for pre-trigger history.
Tax reassessment forecast MO · Resets to sale price
- Current annual tax
- $2,161 · $180/mo
- Projected year-2 tax
- $2,161 · $180/mo
- Expected delta
- $0/yr ($0/mo · 0.0%)
ⓘ Screening estimate from a state-policy table — verify with the county assessor before closing.
Climate risk First Street
- Flood 1/10 Low FEMA zone X (unshaded) · 0% chance over 30 yrs
- Wildfire 1/10 Low
- Heat 4/10 Moderate 7 d/yr ≥107°F today · 16 d/yr by 30 yrs out
- Wind 2/10 Low
- Air quality 4/10 Moderate 5 unhealthy d/yr today · 5 by 30 yrs out
Nearby sold comps map
Loading sold comps map…
Walkable amenities ~0.75 mi
Loading nearby amenities…
Taxation est. · year 1
- Rental income
- $17,339
- − Mortgage interest
- −$9,691
- − Property taxes
- −$2,161
- − Insurance
- −$865
- − Repairs & maintenance
- −$1,387
- − Management
- −$1,387
- − Depreciation
- −$5,033
- Taxable loss
- −$3,184
- Est. tax savings @ 24.0%
- +$764
- After-tax cash flow
- $550/yr
For passive investors: Depreciation is non-cash, so a rental often shows a tax loss while cash-flowing — sheltering income. Rental losses are passive: they offset passive income freely, and up to $25,000/yr can offset ordinary (W-2) income if you actively participate and your MAGI is under $100k (phasing out to $0 by $150k); unused losses carry forward. On sale, claimed depreciation is recaptured at up to 25%, and gains may owe capital-gains tax (a 1031 exchange can defer both). Figures are a year-1 estimate at your 24.0% rate — not tax advice; consult a CPA.
Schools (NCES district)
- District
- Blue Springs R-IV
- NCES district ID
- 2905310
- Math proficiency
- 55% ▼ -10.00%
- Reading proficiency
- 60% ▼ -6.00%
- Median HH income
- $67,959
- Composite
- 50.71/100
- National rank
- #1819
- State rank
- #17 of 324 in MO
Livability — Blue Springs
- Score
- 82/100
- State rank
- #11
- US rank
- #1297
Category grades
Schools grade is shown separately in the Schools card above.
Census & demographics
- Census place
- Blue Springs, MO
- County
- Jackson County · 687,798 people
- City population
- 61,033
- Metro
- Kansas City, MO-KS
- Population (ZIP)
- 32,245
- Household income
- $84,518
- Rent vs Own
- Severe rent burden
- 555.0
Population outlook (Jackson County) Hauer SSP2
- Today (2025)
- 719,589 people
- By 2030
- 731,456 · +1.6%
- By 2040
- 746,689 · +3.8%
- By 2050
- 749,289 · +4.1%
- By 2075
- 736,227 · +2.3%
- By 2100
- 668,210 · -7.1%
Race, ethnicity, and origin ACS 2023
- Neighborhood character
- Predominantly White (80%)
- Race & ethnicity
- White 80% Black 7% Two or more races 7% Hispanic / Latino 7% Asian 1%
- Hispanic origin (detail)
- Mexican 5%
- Common ancestry
- Italian 11% Slovak 3% Lithuanian 2%
- Foreign-born
- 2% · Canada, Vietnam
- Languages at home
- 96% English-only · Spanish 2%
Political lean MEDSL · Jackson
- 2024 margin
- D (+19.3) · D 58.9% · R 39.5% · Other 1.6%
- 2008→2024 swing
- -6.1pp toward R · 2008: 25.4pp · 2024: 19.3pp
- All cycles
- 2024: D+19.3 2020: D+22.0 2016: D+16.6 2012: D+19.0 2008: D+25.4
Not yet ingested
- Civics
- —
Market trends
- HPI YoY
- ▼ -199.47%
- Current HPI
- 232.221
- Rent YoY
- ▲ 1.01%
- Metro
- Kansas City, MO-KS
- State GDP YoY
- ▲ 1.84%
- F500 in state
- 20
Industry mix (Fortune 500 HQ in MO)
| Industry | F500 HQs | Revenue |
|---|---|---|
| Healthcare | 1 | $163B |
|
||
| Insurance | 1 | $21B |
|
||
| Industrial Technology | 1 | $17B |
|
||
| Retail | 1 | $16B |
|
||
| Industrial Distribution | 1 | $10B |
|
||
| Utilities | 1 | $9B |
|
||
Price history
+8.1% since first listed23 events — show timeline
- 2026-02-21 Pending — Heartland MLS as Distributed by MLS Grid
- 2026-02-13 Listed $173,000 Heartland MLS as Distributed by MLS Grid
- 2025-12-16 Listing Removed — Heartland MLS as Distributed by MLS Grid
- 2025-10-28 Relisted — Heartland MLS as Distributed by MLS Grid
- 2025-08-22 Contingent — Heartland MLS as Distributed by MLS Grid
- 2025-08-06 Relisted — Heartland MLS as Distributed by MLS Grid
- 2025-06-27 Contingent — Heartland MLS as Distributed by MLS Grid
- 2025-06-03 Price Changed $175,000 Heartland MLS as Distributed by MLS Grid
- 2025-05-07 Price Changed $190,000 Heartland MLS as Distributed by MLS Grid
- 2025-04-15 Listed $200,000 Heartland MLS as Distributed by MLS Grid
- 2023-07-18 Sold (Public Records) — Public Records
- 2023-07-17 Sold (MLS) — Heartland MLS as Distributed by MLS Grid
- 2023-06-16 Pending — Heartland MLS as Distributed by MLS Grid
- 2023-06-05 Price Changed $187,500 Heartland MLS as Distributed by MLS Grid
- 2023-05-20 Listed $190,000 Heartland MLS as Distributed by MLS Grid
- 2021-04-27 Sold (Public Records) — Public Records
- 2021-04-23 Sold (MLS) — Heartland MLS as Distributed by MLS Grid
- 2021-04-01 Pending — Heartland MLS as Distributed by MLS Grid
- 2021-03-26 Relisted — Heartland MLS as Distributed by MLS Grid
- 2021-03-23 Pending — Heartland MLS as Distributed by MLS Grid
- 2021-03-19 Listed $160,000 Heartland MLS as Distributed by MLS Grid
- 2016-03-11 Sold (Public Records) — Public Records
- 2009-06-25 Sold (Public Records) — Public Records
Property tax history
+4.8%/yrLatest (2025): $2,161 · -11.6% YoY. Source: county tax records.
Cash-flow waterfall
monthlySold comps — $/sqft
last 12 mo · ≤1 miLoading sold comps…