 Multi-family
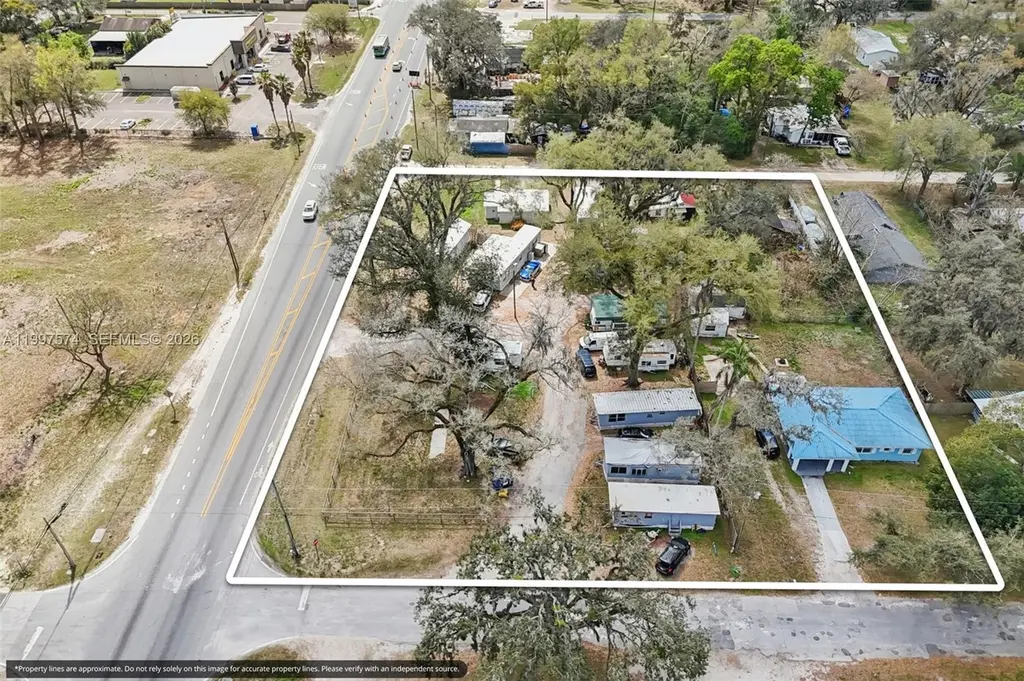
4233 Gall Blvd · Zephyrhills South, FL
Flood risk 1/10 · Minimal
- FEMA flood zone
- X (unshaded)
- Chance of flooding over 30 yrs
- 0.0%
- Est. flood insurance / yr
- $507 – $1,088
Fire risk 4/10 · Minor
- Est. fire insurance / yr
- $947 – $1,759
Heat risk 9/10 · Severe
- Hot days now (above 108°F)
- 7 days/yr
- Hot days in 30 yrs
- 24 days/yr
Wind risk 9/10 · Severe
- Chance of severe wind over 30 yrs
- 99.0%
Air-quality risk 2/10 · Minimal
- Unhealthy air days now
- 1 days/yr
- Unhealthy air days in 30 yrs
- 2 days/yr
Risk factors via First Street. Map © Google.
Why this score? — see what drove the B grade
The composite is a weighted blend of 9 inputs, each scored 0–100. Each bar is that input's sub-score; the figure is the points it added to the 100-point composite (weight × sub-score).
- Cash flow +30.0/30.0
- DSCR +10.0/10.0
- 1% rule +8.7/10.0
- ARV discount +7.5/15.0
- Appreciation +5.0/10.0
- Schools +4.3/10.0
- Livability +2.9/5.0
- Rent growth +2.5/5.0
- Condition / age +2.5/5.0
$1,275,000
🖨 Deal sheet 📄 Offer letter ✓ Due diligence
Listing remarks
Cash-Flowing 14-Unit Mobile Home Park MHP | Zephyrhills FL | 11.76% CAPRATE 14-Unit Mobile Home Park & RV Park | $200K Income | Zephyrhills FL Property includes 2 single-family homes, 8 mobile homes, and 4 RV pads generating approximately $200,000 in annual income with additional upside potential. Immediate Upside Potential (~$10,000+ Increase) High-Visibility Location on Gall Blvd FEMA Zone X (Low Flood Risk) Consistently Strong Tenant Demand Fully Fenced Property with On-Site Management Turnkey Investment with Stable Cash Flow Property Overview This well-maintained mobile home park and rental portfolio is ideally located directly off Gall Blvd in the rapidly growing Zephyrhills mark
Key facts
- 30 parking spots
- Built 1987
- Listed 48 days
Property features AI
Finance
- Financial info: Electricity included with rent
Exterior
- Parking: 30 parking spaces
- Utilities: Public sewer; Cable available
- Home design: Single-story property; Resale home
- Construction: Block, frame, and manufactured construction; Shingle roof
- Exterior features: Less than one acre lot; Zoned C2
Interior
- Flooring: Carpet; Ceramic tile
- Heating & cooling: Central heating; Central air conditioning; Ceiling fans
- Interior features: Carpet and ceramic tile flooring
Neighborhood map
What this means for you Summary
Snapshot
- This is a 2-bed/1.0-bath multifamily listed at $1.27M.
Deal economics
- At list price, monthly cash flow is $6k ($74k/yr) — positive.
- The deal already cash-flows at list — no discount required.
- Meets the 1% rule at list price ($18k rent vs $1.27M).
- Recommended offer: $1.24M (3.0% below list) — sets the bar for market timing.
- Cap rate 12.1% vs local median 4.1% in Zephyrhills South — top-decile yield for the area; either an underpriced asset or a hidden risk that comps aren't pricing in. Stress-test before assuming the spread holds.
Location & tenants
- Location reads 58/100 on livability (#836 in FL) — a working-class tenant base; expect higher turnover. Strengths: cost of living A+; Watch: employment D, schools F, amenities F.
- Pasco (suburban): math 50% / reading 52% proficiency, ranked #32 of 73 in FL (top 44%) — acceptable for families but not a draw, mixed tenant base, ~2y average lease.
- Market conditions: 1 active listings in the ZIP; 6,765 units permitted in Pasco County in 2024 (1,250 in 5+ unit buildings).
Forward outlook
- In year one you build about $47k of equity ($9k loan paydown + $38k appreciation (3.0% local appreciation)).
- Pasco County population projected at +29% by 2050 — long-run rental-demand tailwind backs the buy-and-hold thesis.
- At projected returns (3.0% appreciation + 3.0% rent growth), your $357k cash investment doubles in ~3 years — after that, you're playing with house money.
- By year 2, paydown + projected appreciation supports a ~$77k cash-out refi (75% LTV) — recoverable capital for the next deal without selling this one.
Negotiation context
- It's been on market 48 days — a 3% lower offer ($1.24M) is reasonable based on typical stale-listing flexibility.
- 2 sale attempts since 3y ago with the ask held roughly flat each time — persistent listings suggest the price (not the market) is what's stuck; bring a comps-based counter.
- Current owner paid $125k; list at $1.27M implies a 920% gain — meaningful room to come down on a strong offer.
Risks & watch-outs
- Climate carrying-cost: severe wind risk, 99% chance of damaging wind over 30y; extreme-heat days projected 7→24/yr by 2055 (HVAC capex compounding) — expect insurance premiums to compound above CPI over the hold.
Questions for the listing agent
- It's been on market 48 days. Have you received any prior offers? Is the seller open to a 3% concession, seller financing, or rate buy-down credit?
- Is there a deadline driving the sale (1031 exchange, divorce, estate, relocation)? That informs how much negotiation room exists.
- Schools are F-rated, which usually means shorter tenancies and higher turnover. Who's the typical renter profile here, and what's been the actual vacancy rate?
- What's the average days-on-market for RENTAL listings here right now (not sales)? A rising rental-DOM trend means longer vacancies and softer asking-rent achievability than the comps imply.
- What's the recent tenant-quality profile in this submarket — average credit score on applications, eviction rate, late-payment / NSF rate, and stable-employment percentage? A property-management company in the area should have these aggregated.
- How much new apartment / multifamily construction is in the pipeline within 1–3 miles? Heavy new supply (>2% of stock underway) typically softens rents 12–24 months out; light construction supports rent growth.
Investment metrics
- 1% rule
- 1.37% ✓
- Cap rate
- 12.08%
- Cash-on-cash
- 20.68%
- DSCR
- 1.92
- GRM
- 6.1
CMA / ARV
No comps found within radius.
Projected returns pro-forma
3.0% appreciation · 3.0% rent growth · sell at horizon
- IRR
- 26.9%
- Equity multiple
- 2.53×
- Total profit
- $544,995
- Equity at exit
- $573,295
- IRR
- 27.5%
- Equity multiple
- 4.90×
- Total profit
- $1,390,609
- Equity at exit
- $883,516
Cash invested: $357,000 (down + closing). Projections, not guarantees.
Landlord ↔ Tenant lean methodology
- Overall (STATE)
- 87 Strongly Landlord-Friendly
- State Florida
- 87 Strongly Landlord-Friendly · R+3
- County
- — inherits STATE
- City
- — inherits STATE
ZIP-level market 33452
- Active inventory
- 1
- Price-to-rent
- 84.9×
Monthly cashflow live
- Estimated rent
- $17,518 high interval (Pro) →
- Mortgage (P&I)
- −$6,686
- Tax from tax record
- −$470 /mo · $5,636/yr
- Insurance
- −$531
- HOA
- −$0
- Vacancy / Maint / Mgmt
- −$3,679
- Net cashflow
- $6,152
Break-even live
14-unit breakdown (identical units grouped — click to expand)
| Units | Beds | Baths | Est. rent |
|---|---|---|---|
| 14× units | 1 | 1 | $17,514 |
| #1 | 1 | 1 | $1,251 |
| #2 | 1 | 1 | $1,251 |
| #3 | 1 | 1 | $1,251 |
| #4 | 1 | 1 | $1,251 |
| #5 | 1 | 1 | $1,251 |
| #6 | 1 | 1 | $1,251 |
| #7 | 1 | 1 | $1,251 |
| #8 | 1 | 1 | $1,251 |
| #9 | 1 | 1 | $1,251 |
| #10 | 1 | 1 | $1,251 |
| #11 | 1 | 1 | $1,251 |
| #12 | 1 | 1 | $1,251 |
| #13 | 1 | 1 | $1,251 |
| #14 | 1 | 1 | $1,251 |
| Total (14 units) | $17,518 | ||
UW: 25.0% down · 7.5% · 30yr · 1.5% tax · 5.0% vac · 8.0% maint · 8.0% mgmt
Financing live
Cash to close
- Down payment
- $318,750
- Closing costs
- $38,250
- Reserves months
- —
- Total cash needed
- —
Loan-product check · same deal, 3 products live
Conventional
25% down · 7.5% · 30yr
- Down + closing
- —
- Monthly P&I
- —
- Monthly cashflow
- —
- DSCR
- —
- Eligible?
- —
Personal DTI + credit; lowest rate.
DSCR
20% down · 8.5% · 30yr
- Down + closing
- —
- Monthly P&I
- —
- Monthly cashflow
- —
- DSCR
- —
- Eligible?
- —
No personal income docs; deal must DSCR.
Hard money
10% down · 12.0% · 12mo
- Down + closing
- —
- Monthly P&I
- —
- Monthly cashflow
- —
- DSCR
- —
- Eligible?
- —
Short-term bridge; refi at stabilization.
Listing history 8 events
-
2026-04-08$1,275,000 Active
-
2023-11-18historical $1,000
-
2023-11-01$1,000
-
2022-03-31price $250
-
2010-09-01soldstatus $125,000
-
2009-10-09soldstatus $100
-
2005-11-04soldstatus $450,000
-
2001-01-10soldstatus $74,400
ⓘ Source: listings_history table (triggers on properties + properties_extension) + one-shot
backfill from property_details.listing_events for pre-trigger history.
Tax reassessment forecast FL · Resets to sale price
- Current annual tax
- $5,636 · $470/mo
- Projected year-2 tax
- $10,582 · $882/mo
- Expected delta
- +$4,947/yr (+$412/mo · 87.8%)
ⓘ Screening estimate from a state-policy table — verify with the county assessor before closing.
Climate risk First Street
- Flood 1/10 Low FEMA zone X (unshaded) · 0% chance over 30 yrs
- Wildfire 4/10 Moderate
- Heat 9/10 Extreme 7 d/yr ≥108°F today · 24 d/yr by 30 yrs out
- Wind 9/10 Extreme 99% chance of damaging wind over 30 yrs
- Air quality 2/10 Low 1 unhealthy d/yr today · 2 by 30 yrs out
Nearby sold comps map
Loading sold comps map…
Walkable amenities ~0.75 mi
Loading nearby amenities…
Taxation est. · year 1
- Rental income
- $210,216
- − Mortgage interest
- −$71,420
- − Property taxes
- −$5,636
- − Insurance
- −$6,375
- − Repairs & maintenance
- −$16,817
- − Management
- −$16,817
- − Depreciation
- −$37,091
- Taxable income
- $56,060
- Est. tax owed @ 24.0%
- −$13,454
- After-tax cash flow
- $60,370/yr
For passive investors: Depreciation is non-cash, so a rental often shows a tax loss while cash-flowing — sheltering income. Rental losses are passive: they offset passive income freely, and up to $25,000/yr can offset ordinary (W-2) income if you actively participate and your MAGI is under $100k (phasing out to $0 by $150k); unused losses carry forward. On sale, claimed depreciation is recaptured at up to 25%, and gains may owe capital-gains tax (a 1031 exchange can defer both). Figures are a year-1 estimate at your 24.0% rate — not tax advice; consult a CPA.
Schools (NCES district)
- District
- Pasco
- NCES district ID
- 1201530
- Math proficiency
- 50% ▼ -10.00%
- Reading proficiency
- 52% ▼ -5.00%
- Median HH income
- $45,039
- Composite
- 43.14/100
- National rank
- #3074
- State rank
- #32 of 73 in FL
Livability — Zephyrhills South
- Score
- 58/100
- State rank
- #836
- US rank
- #20702
Category grades
Schools grade is shown separately in the Schools card above.
Census & demographics
- Census place
- Zephyrhills South, FL
Population outlook (Pasco County) Hauer SSP2
- Today (2025)
- 570,045 people
- By 2030
- 605,844 · +6.3%
- By 2040
- 674,806 · +18.4%
- By 2050
- 736,022 · +29.1%
- By 2075
- 862,900 · +51.4%
- By 2100
- 906,364 · +59.0%
Not yet ingested
- Political lean
- —
- Race & ethnicity
- —
- Common origin
- —
- Civics
- —
Market trends
- HPI YoY
- —
- Current HPI
- —
- Rent YoY
- —
- Metro
- —
- State GDP YoY
- ▲ 3.28%
- F500 in state
- 36
Industry mix (Fortune 500 HQ in FL)
| Industry | F500 HQs | Revenue |
|---|---|---|
| Industrial Technology | 2 | $29B |
|
||
| Insurance | 2 | $17B |
|
||
| Retail | 1 | $60B |
|
||
| Technology Distribution | 1 | $58B |
|
||
| Homebuilding | 1 | $35B |
|
||
| Technology Manufacturing | 1 | $35B |
|
||
Price history
+1613.7% since first listed8 events — show timeline
- 2026-04-08 Listed $1,275,000 MARMLS
- 2023-11-18 Rental Removed $1,000 APPFOLIO
- 2023-11-01 Listed for Rent $1,000 APPFOLIO
- 2022-03-31 Price Changed $250 APPFOLIO
- 2010-09-01 Sold (Public Records) $125,000 Public Records
- 2009-10-09 Sold (Public Records) $100 Public Records
- 2005-11-04 Sold (Public Records) $450,000 Public Records
- 2001-01-10 Sold (Public Records) $74,400 Public Records
Property tax history
+13.3%/yrLatest (2025): $5,636 · -0.8% YoY. Source: county tax records.
Cash-flow waterfall
monthlySold comps — $/sqft
last 12 mo · ≤1 miLoading sold comps…