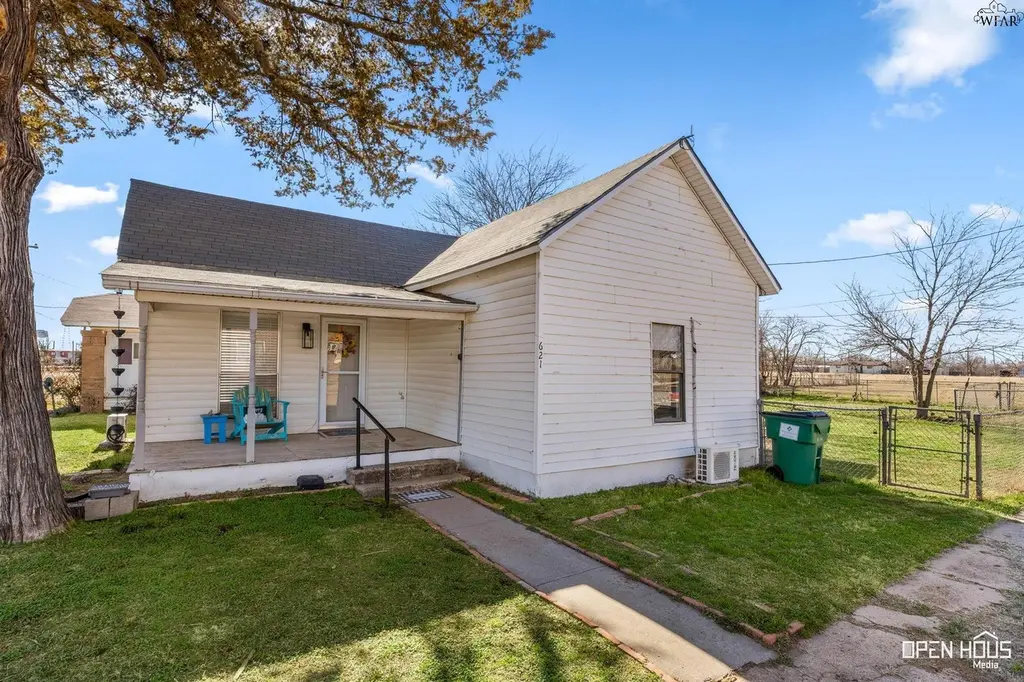
621 N Main St · Electra, TX
Flood risk 1/10 · Minimal
- FEMA flood zone
- X (unshaded)
- Chance of flooding over 30 yrs
- 0.0%
- Est. flood insurance / yr
- $507 – $1,088
Fire risk 8/10 · Major
- Est. fire insurance / yr
- $1,222 – $2,270
Heat risk 7/10 · Major
- Hot days now (above 109°F)
- 7 days/yr
- Hot days in 30 yrs
- 19 days/yr
Wind risk 3/10 · Minor
- Chance of severe wind over 30 yrs
- 7.0%
Air-quality risk 1/10 · Minimal
- Unhealthy air days now
- 0 days/yr
- Unhealthy air days in 30 yrs
- 0 days/yr
Risk factors via First Street. Map © Google.
Why this score? — see what drove the C- grade
The composite is a weighted blend of 9 inputs, each scored 0–100. Each bar is that input's sub-score; the figure is the points it added to the 100-point composite (weight × sub-score).
- Cash flow +16.6/30.0
- ARV discount +7.5/15.0
- Appreciation +5.6/10.0
- DSCR +5.2/10.0
- 1% rule +4.7/10.0
- Livability +3.3/5.0
- Schools +3.1/10.0
- Rent growth +2.5/5.0
- Condition / age +2.5/5.0
$89,940
🖨 Deal sheet (PDF) 📄 Offer letter ✓ Due diligence
Listing remarks MLS
Incredible investment opportunity in the heart of Electra! This 2-bedroom, 1-bath home has a proven track record as both a successful Airbnb and long-term rental, welcoming guests traveling through the area and to nearby Wichita Falls. Offering immediate income potential for savvy investors, it features an inviting layout and charming character. From the cozy feel to the flexible use options, it’s perfect for investors looking to add to their portfolio or buyers seeking small-town living with opportunity!
Key facts
- Built 1930
- Listed 117 days
Neighborhood map
What this means for you Summary
Snapshot
- This is a 2-bed/1.0-bath single-family listed at $90k.
Deal economics
- At list price, monthly cash flow is $55 ($661/yr) — positive.
- The deal already cash-flows at list — no discount required.
- To meet the 1% rule (rent ≥ 1% of price), the offer needs to be $87k (2.8% below list).
- Recommended offer: $82k (9.0% below list) — sets the bar for market timing.
Location & tenants
- Location reads 66/100 on livability (#647 in TX) — a middle-class / working-renter tenant base. Strengths: cost of living A+, housing A+, crime B; Watch: health & safety C-, amenities F, commute F.
- Electra ISD (town): math 35% / reading 39% proficiency, ranked #494 of 826 in TX (top 60%) — families likely to look elsewhere, expect single-tenant / working-renter base with shorter leases.
- Zoned schools: Electra El (math 37% / reading 37%, grade F, #1,769 of 4,322 statewide, top 44%, 277 students, 72% FRL); Electra Junior/Senior High (math 32% / reading 47%, grade F, #821 of 1,632 statewide, top 53%, 179 students, 68% FRL).
- Market conditions: 48 active listings in the ZIP; 231 units permitted in Wichita County in 2024 (10 in 5+ unit buildings).
Forward outlook
- In year one you build about $2k of equity ($622 loan paydown + $1k appreciation (1.1% local appreciation)).
- Wichita County population projected to shrink 7% by 2050 — rents likely to lag national; underwrite the cash flow, not the appreciation.
- At projected returns (1.1% appreciation + 3.0% rent growth), your $25k cash investment doubles in ~8 years — after that, you're playing with house money.
Negotiation context
- It's been on market 117 days — a 9% lower offer ($82k) is reasonable based on typical stale-listing flexibility.
- 3 sale attempts since 3y ago with the ask held roughly flat each time — persistent listings suggest the price (not the market) is what's stuck; bring a comps-based counter.
Risks & watch-outs
- Watch-outs: built in 1930 — expect roof / HVAC / electrical / plumbing capex.
- Climate carrying-cost: severe wildfire risk; extreme-heat days projected 7→19/yr by 2055 (HVAC capex compounding) — expect insurance premiums to compound above CPI over the hold.
Questions for the listing agent
- It's been on market 117 days. Have you received any prior offers? Is the seller open to a 9% concession, seller financing, or rate buy-down credit?
- Built in 1930 — when were the roof, HVAC, electrical panel, plumbing, and water heater last replaced?
- Why hasn't it sold? Are there any deal-killer items the seller is aware of (foundation, flood, title, zoning, code violations)?
- Is there a deadline driving the sale (1031 exchange, divorce, estate, relocation)? That informs how much negotiation room exists.
- Schools are D-rated, which usually means shorter tenancies and higher turnover. Who's the typical renter profile here, and what's been the actual vacancy rate?
- What's the average days-on-market for RENTAL listings here right now (not sales)? A rising rental-DOM trend means longer vacancies and softer asking-rent achievability than the comps imply.
- What's the recent tenant-quality profile in this submarket — average credit score on applications, eviction rate, late-payment / NSF rate, and stable-employment percentage? A property-management company in the area should have these aggregated.
- How much new for-sale + rental construction is in the pipeline within 1–3 miles? Heavy new supply typically softens prices + rents 12–24 months out; constrained supply supports both.
Investment metrics
- 1% rule
- 0.97% ✗
- Cap rate
- 7.03%
- Cash-on-cash
- 2.62%
- DSCR
- 1.12
- GRM
- 8.6
CMA / ARV
- ARV (median comp)
- $29,169
- List price
- $89,940
- Delta
- 208.34%
- Verdict
- OVERPRICED
- Comps
- 5 within 1.0 mi
Show comp detail 1 sale within ~0.75 mi
| Address | Dist | Beds/Ba | Sqft | Sold | Price | $/sf | Match |
|---|---|---|---|---|---|---|---|
| 307 E Summit Ave | 0.74mi | 2/1.0 | 704 (-5%) | 13mo | $37,049 | $53 | 47 |
Match score weights: distance 35% · size 25% · config 20% · recency 20%. Top-matched comps best support the ARV.
Projected returns pro-forma
1.14% appreciation · 3.0% rent growth · sell at horizon
- IRR
- 4.5%
- Equity multiple
- 1.23×
- Total profit
- $5,828
- Equity at exit
- $31,360
- IRR
- 8.8%
- Equity multiple
- 2.09×
- Total profit
- $27,334
- Equity at exit
- $42,186
Cash invested: $25,183 (down + closing). Projections, not guarantees.
Landlord ↔ Tenant lean methodology
- Overall (STATE)
- 87 Strongly Landlord-Friendly
- State Texas
- 87 Strongly Landlord-Friendly · R+5
- County
- — inherits STATE
- City
- — inherits STATE
ZIP-level market 76360
- Home prices YoY
- 1.1%
- Active inventory
- 48
- Price-to-rent
- 8.6×
Monthly cashflow live
- Estimated rent
- $874 medium interval (Pro) →
- Mortgage (P&I)
- −$472
- Tax from tax record
- −$126 /mo · $1,516/yr
- Insurance
- −$37
- HOA
- −$0
- Vacancy / Maint / Mgmt
- −$184
- Net cashflow
- $55
Break-even live
Sensitivity live
| Price | -10% $106 | -5% $81 | +0% $55 | +5% $30 | +10% $4 |
|---|---|---|---|---|---|
| Rent | -10% $-14 | -5% $21 | +0% $55 | +5% $90 | +10% $124 |
| Rate | -1.0pp $100 | -0.5pp $78 | base $55 | +0.5pp $32 | +1.0pp $8 |
UW: 25.0% down · 7.5% · 30yr · 1.5% tax · 5.0% vac · 8.0% maint · 8.0% mgmt
Financing live
Cash to close
- Down payment
- $22,485
- Closing costs
- $2,698
- Reserves months
- —
- Total cash needed
- —
Loan-product check · same deal, 3 products live
Conventional
25% down · 7.5% · 30yr
- Down + closing
- —
- Monthly P&I
- —
- Monthly cashflow
- —
- DSCR
- —
- Eligible?
- —
Personal DTI + credit; lowest rate.
DSCR
20% down · 8.5% · 30yr
- Down + closing
- —
- Monthly P&I
- —
- Monthly cashflow
- —
- DSCR
- —
- Eligible?
- —
No personal income docs; deal must DSCR.
Hard money
10% down · 12.0% · 12mo
- Down + closing
- —
- Monthly P&I
- —
- Monthly cashflow
- —
- DSCR
- —
- Eligible?
- —
Short-term bridge; refi at stabilization.
Listing history 23 events
-
2026-06-21days on market $89,940 Active 117 DOM
-
2026-06-21days on market $89,940 Active 116 DOM
-
2026-06-18days on market $89,940 Active 114 DOM
-
2026-06-17days on market $89,940 Active 113 DOM
-
2026-06-16days on market $89,940 Active 112 DOM
-
2026-06-15days on market $89,940 Active 111 DOM
-
2026-06-13days on market $89,940 Active 109 DOM
-
2026-06-12days on market $89,940 Active 108 DOM
-
2026-06-09days on market $89,940 Active 105 DOM
-
2026-06-08days on market $89,940 Active 104 DOM
-
2026-06-08days on market $89,940 Active 103 DOM
-
2026-06-07days on market $89,940 Active 102 DOM
-
2026-06-03days on market $89,940 Active 99 DOM
-
2026-06-02days on market $89,940 Active 98 DOM
-
2026-06-01days on market $89,940 Active 97 DOM
-
2026-05-31days on market $89,940 Active 96 DOM
-
2026-02-24$89,940 Active 516-char remark
Show marketing remark (516 chars)
Incredible investment opportunity in the heart of Electra! This 2-bedroom, 1-bath home has a proven track record as both a successful Airbnb and long-term rental, welcoming guests traveling through the area and to nearby Wichita Falls. Offering immediate income potential for savvy investors, it features an inviting layout and charming character. From the cozy feel to the flexible use options, it’s perfect for investors looking to add to their portfolio or buyers seeking small-town living with opportunity!
-
2024-06-07soldstatus Closed 99-char remark
Show marketing remark (99 chars)
Currently fully furnished and being used as an Airbnb. The lot behind property will convey as well.
-
2024-06-05historical 99-char remark
Show marketing remark (99 chars)
Currently fully furnished and being used as an Airbnb. The lot behind property will convey as well.
-
2024-01-26$99,940 Active 99-char remark
Show marketing remark (99 chars)
Currently fully furnished and being used as an Airbnb. The lot behind property will convey as well.
-
2023-06-20soldstatus Closed
-
2023-06-11$69,940 Active
-
2006-06-05soldstatus
ⓘ Source: listings_history table (triggers on properties + properties_extension) + one-shot
backfill from property_details.listing_events for pre-trigger history.
Tax reassessment forecast TX · Resets to sale price
- Current annual tax
- $1,516 · $126/mo
- Projected year-2 tax
- $1,646 · $137/mo
- Expected delta
- +$130/yr (+$11/mo · 8.6%)
ⓘ Screening estimate from a state-policy table — verify with the county assessor before closing.
Climate risk First Street
- Flood 1/10 Low FEMA zone X (unshaded) · 0% chance over 30 yrs
- Wildfire 8/10 Severe
- Heat 7/10 Severe 7 d/yr ≥109°F today · 19 d/yr by 30 yrs out
- Wind 3/10 Moderate 7% chance of damaging wind over 30 yrs
- Air quality 1/10 Low 0 unhealthy d/yr today · 0 by 30 yrs out
Nearby sold comps map
Loading sold comps map…
Walkable amenities ~0.75 mi
Loading nearby amenities…
Taxation est. · year 1
- Rental income
- $10,489
- − Mortgage interest
- −$5,038
- − Property taxes
- −$1,516
- − Insurance
- −$450
- − Repairs & maintenance
- −$839
- − Management
- −$839
- − Depreciation
- −$2,616
- Taxable loss
- −$809
- Est. tax savings @ 24.0%
- +$194
- After-tax cash flow
- $855/yr
For passive investors: Depreciation is non-cash, so a rental often shows a tax loss while cash-flowing — sheltering income. Rental losses are passive: they offset passive income freely, and up to $25,000/yr can offset ordinary (W-2) income if you actively participate and your MAGI is under $100k (phasing out to $0 by $150k); unused losses carry forward. On sale, claimed depreciation is recaptured at up to 25%, and gains may owe capital-gains tax (a 1031 exchange can defer both). Figures are a year-1 estimate at your 24.0% rate — not tax advice; consult a CPA.
Schools (NCES district)
- District
- Electra ISD
- NCES district ID
- 4818330
- Math proficiency
- 35% ▼ -5.00%
- Reading proficiency
- 39% ▼ -1.00%
- Median HH income
- $39,107
- Composite
- 30.95/100
- National rank
- #6109
- State rank
- #494 of 826 in TX
Livability — Electra
- Score
- 66/100
- State rank
- #647
- US rank
- #12245
Category grades
Schools grade is shown separately in the Schools card above.
Census & demographics
- Census place
- Electra, TX
- Population (ZIP)
- 2,692
Population outlook (Wichita County) Hauer SSP2
- Today (2025)
- 129,638 people
- By 2030
- 128,366 · -1.0%
- By 2040
- 124,466 · -4.0%
- By 2050
- 120,499 · -7.0%
- By 2075
- 113,884 · -12.2%
- By 2100
- 101,818 · -21.5%
Race, ethnicity, and origin ACS 2023
- Neighborhood character
- Predominantly White (73%)
- Race & ethnicity
- White 73% Hispanic / Latino 18% Two or more races 9% Black 4%
- Hispanic origin (detail)
- Mexican 17%
- Common ancestry
- Slovak 3% Italian 2% Iranian 1%
- Foreign-born
- 1% · Canada
- Languages at home
- 93% English-only · Spanish 6%
Political lean MEDSL · Wichita
- 2024 margin
- Solid R (+44.0) · D 27.5% · R 71.5%
- 2008→2024 swing
- -5.2pp toward R · 2008: -38.9pp · 2024: -44.0pp
- All cycles
- 2024: R+44.0 2020: R+41.1 2016: R+49.7 2012: R+47.1 2008: R+38.9
Not yet ingested
- Civics
- —
Market trends
- HPI YoY
- ▲ 1.14%
- Current HPI
- 106.7145
- Rent YoY
- —
- Metro
- —
- State GDP YoY
- ▲ 3.95%
- F500 in state
- 110
Industry mix (Fortune 500 HQ in TX)
| Industry | F500 HQs | Revenue |
|---|---|---|
| Energy | 16 | $1,198B |
|
||
| Technology | 5 | $198B |
|
||
| Engineering / Construction | 4 | $72B |
|
||
| Energy Services | 3 | $60B |
|
||
| Utilities | 3 | $41B |
|
||
| Healthcare | 2 | $330B |
|
||
Price history
+28.6% since first listed7 events — show timeline
- 2026-02-24 Listed $89,940 WFAOR
- 2024-06-07 Sold (MLS) — WFAOR
- 2024-06-05 Delisted — WFAOR
- 2024-01-26 Listed $99,940 WFAOR
- 2023-06-20 Sold (MLS) — WFAOR
- 2023-06-11 Listed $69,940 WFAOR
- 2006-06-05 Sold (Public Records) — Public Records
Property tax history
+13.5%/yrLatest (2025): $1,516 · -1.5% YoY. Source: county tax records.
Cash-flow waterfall
monthlySold comps — $/sqft
last 12 mo · ≤1 miLoading sold comps…