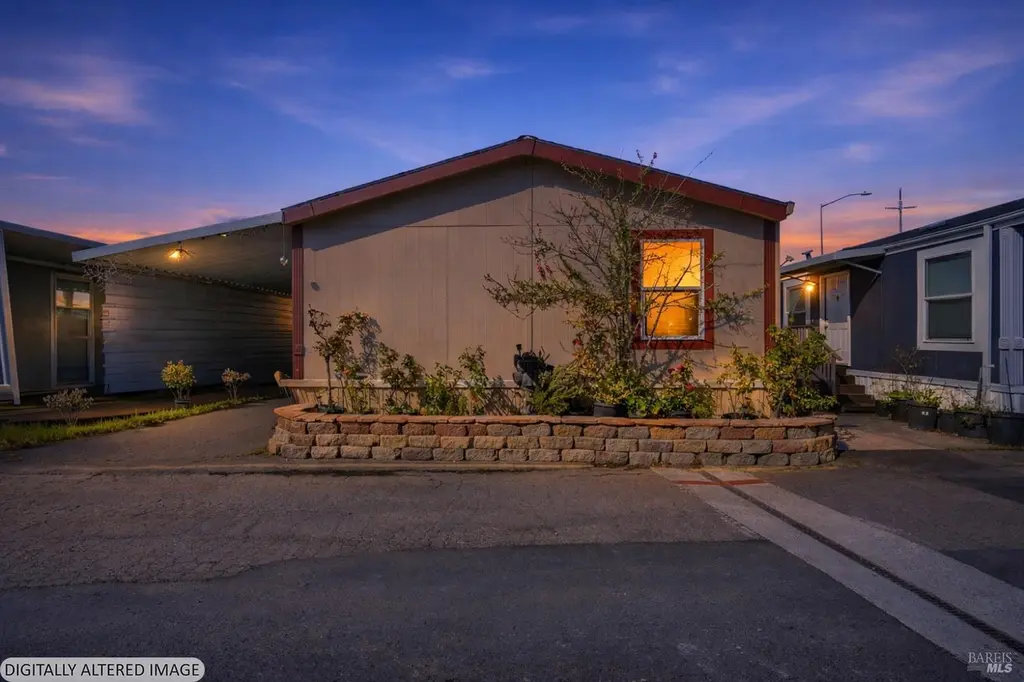
2963 Santa Rosa Ave Unit B-2 · Santa Rosa, CA
Flood risk 3/10 · Minor
- FEMA flood zone
- X (unshaded)
- Chance of flooding over 30 yrs
- 0.2%
- Est. flood insurance / yr
- $507 – $1,088
Fire risk 6/10 · Moderate
- Est. fire insurance / yr
- $659 – $1,223
Heat risk 4/10 · Minor
- Hot days now (above 92°F)
- 7 days/yr
- Hot days in 30 yrs
- 16 days/yr
Wind risk 1/10 · Minimal
- Chance of severe wind over 30 yrs
- —
Air-quality risk 8/10 · Major
- Unhealthy air days now
- 15 days/yr
- Unhealthy air days in 30 yrs
- 17 days/yr
Risk factors via First Street. Map © Google.
Why this score? — see what drove the B grade
The composite is a weighted blend of 9 inputs, each scored 0–100. Each bar is that input's sub-score; the figure is the points it added to the 100-point composite (weight × sub-score).
- Cash flow +30.0/30.0
- 1% rule +10.0/10.0
- DSCR +10.0/10.0
- ARV discount +8.2/15.0
- Livability +3.8/5.0
- Schools +3.7/10.0
- Rent growth +3.2/5.0
- Condition / age +2.5/5.0
- Appreciation +0.0/10.0
$155,000
🖨 Deal sheet (PDF) 📄 Offer letter ✓ Due diligence
Listing remarks MLS
Clean 3 bedroom close to shopping, freeway and transportation. Bedrooms are split, master on one end and 2 bedrooms and bath on the other. Central kitchen with attached laundry room, spacious living room. Move in condition!!!
Key facts
- Covered carport
- Easy freeway access
- 2 parking spots
Tags
Property features AI
Finance
- Financial info: Land lease amount $1,100
- HOA & community: No homeowners association; Not a senior community; Located in Sunset Mobile Home Park
Exterior
- Parking: 2 parking spaces
- Utilities: Natural gas connected; Public sewer; 220 volts in laundry
- Home design: Manufactured home (double wide) located in a mobile home park
- Construction: Composition roof; Aluminum skirting; Manufactured by Fleetwood
- Exterior features: Carport awning; Covered parking; Guest parking available
Interior
- Kitchen: Free standing gas oven; Free standing refrigerator; Hood over range
- Bedrooms: 3 bedrooms
- Bathrooms: 2 full bathrooms with shower stalls
- Heating & cooling: Central heating; Ceiling fans
- Interior features: Skylights in dining area and kitchen; Storage area; Smoke detector
- Laundry & utility: Washer/dryer hookups inside (220 volts in laundry); Gas water heater
Neighborhood map
What this means for you Summary
Snapshot
- This is a 3-bed/2.0-bath manufactured listed at $155k.
Deal economics
- At list price, monthly cash flow is $1k ($15k/yr) — positive.
- The deal already cash-flows at list — no discount required.
- Meets the 1% rule at list price ($3k rent vs $155k).
- Recommended offer: $141k (9.0% below list) — sets the bar for market timing.
- Cap rate 16.0% vs local median 2.5% in Santa Rosa — top-decile yield for the area; either an underpriced asset or a hidden risk that comps aren't pricing in. Stress-test before assuming the spread holds.
Location & tenants
- Location reads 75/100 on livability (#112 in CA, #3,940 nationally) — a middle-class / working-renter tenant base. Strengths: amenities A+, commute A+, employment A+; Watch: schools C-, cost of living F.
- Santa Rosa High (urban): math 31% / reading 47% proficiency, ranked #703 of 1,400 in CA (top 50%) — families likely to look elsewhere, expect single-tenant / working-renter base with shorter leases.
- Market conditions: Rents rising (+2.9%/yr); 120 active listings in the ZIP; 13 comparable units currently listed for rent nearby; rentals at typical pace (median 14d on market — plan ~3-4 weeks tenant-placement turnaround); solid renter incomes; 1,039 units permitted in Sonoma County in 2024 (185 in 5+ unit buildings).
- This rent runs 40% of the median local income ($83k/yr) — at the standard rent-burdened threshold; future hikes will face affordability resistance.
Forward outlook
- Local home prices are declining (-3.0%/yr); year-one equity from $1k of loan paydown is wiped out by about $5k of value loss. Plan a longer hold.
- Sonoma County population projected at +8% by 2050 — modest demand growth; plan on rents tracking national, not racing it.
- At projected returns (-3.0% appreciation + 2.9% rent growth), your $43k cash investment doubles in ~4 years — after that, you're playing with house money.
Negotiation context
- It's been on market 94 days — a 9% lower offer ($141k) is reasonable based on typical stale-listing flexibility.
- 3 sale attempts since 15y ago; this cycle's ask has dropped $10k (6%) from the opening price — seller is motivated, your offer sets the floor, not the list.
- Current owner paid $44k; list at $155k implies a 252% gain — meaningful room to come down on a strong offer.
Risks & watch-outs
- Climate carrying-cost: major wildfire risk — expect insurance premiums to compound above CPI over the hold.
Questions for the listing agent
- It's been on market 94 days. Have you received any prior offers? Is the seller open to a 9% concession, seller financing, or rate buy-down credit?
- Why hasn't it sold? Are there any deal-killer items the seller is aware of (foundation, flood, title, zoning, code violations)?
- Is there a deadline driving the sale (1031 exchange, divorce, estate, relocation)? That informs how much negotiation room exists.
- What's the average days-on-market for RENTAL listings here right now (not sales)? A rising rental-DOM trend means longer vacancies and softer asking-rent achievability than the comps imply.
- What's the recent tenant-quality profile in this submarket — average credit score on applications, eviction rate, late-payment / NSF rate, and stable-employment percentage? A property-management company in the area should have these aggregated.
- How much new for-sale + rental construction is in the pipeline within 1–3 miles? Heavy new supply typically softens prices + rents 12–24 months out; constrained supply supports both.
Investment metrics
- 1% rule
- 1.77% ✓
- Cap rate
- 15.98%
- Cash-on-cash
- 34.61%
- DSCR
- 2.54
- GRM
- 4.7
CMA / ARV
- ARV (on-the-fly)
- $157,440
- Comps found
- 11
Show comp detail 11 sales within ~0.75 mi
| Address | Dist | Beds/Ba | Sqft | Sold | Price | $/sf | Match |
|---|---|---|---|---|---|---|---|
| 146 N Star Dr | 0.51mi | 3/2.0 | 960 (0%) | 11mo | $157,000 | $164 | 68 |
| 3050 El Toro Way | 0.28mi | 2/2.0 (-1) | 1,000 (+4%) | 18mo | $188,500 | $189 | 60 |
| 220 Ricardo Ave | 0.26mi | 2/2.0 (-1) | 1,100 (+15%) | 1mo | $179,000 | $163 | 58 |
| 305 Aileen Ave | 0.28mi | 2/2.0 (-1) | 1,100 (+15%) | 0mo | $105,000 | $95 | 57 |
| 205 Pear Ln | 0.25mi | 3/2.0 | 1,104 (+15%) | 8mo | $160,000 | $145 | 57 |
| 273 Aileen Ave | 0.27mi | 2/1.0 (-1) | 900 (-6%) | 17mo | $120,000 | $133 | 54 |
| 319 Apple Ln | 0.33mi | 3/2.0 | 850 (-12%) | 17mo | $111,000 | $131 | 52 |
| 324 Aileen Ave | 0.27mi | 2/2.0 (-1) | 1,060 (+10%) | 21mo | $173,500 | $164 | 48 |
| 227 Ricardo Ave #227 | 0.28mi | 2/2.0 (-1) | 1,056 (+10%) | 22mo | $227,000 | $215 | 47 |
| 144 El Crystal Dr | 0.57mi | 3/2.0 | 1,056 (+10%) | 15mo | $259,000 | $245 | 45 |
| 38 Wayside Dr | 0.73mi | 2/2.0 (-1) | 1,040 (+8%) | 9mo | $205,000 | $197 | 40 |
Match score weights: distance 35% · size 25% · config 20% · recency 20%. Top-matched comps best support the ARV.
Projected returns pro-forma
-3.0% appreciation · 2.93% rent growth · sell at horizon
- IRR
- 30.0%
- Equity multiple
- 2.25×
- Total profit
- $54,370
- Equity at exit
- $23,111
- IRR
- 37.2%
- Equity multiple
- 4.43×
- Total profit
- $149,005
- Equity at exit
- $13,402
Cash invested: $43,400 (down + closing). Projections, not guarantees.
Landlord ↔ Tenant lean methodology
- Overall (STATE)
- 18 Strongly Tenant-Friendly
- State California
- 18 Strongly Tenant-Friendly · D+13
- County
- — inherits STATE
- City
- — inherits STATE
ZIP-level market 95407
- Rents YoY
- 2.9%
- Active inventory
- 120
- Price-to-rent
- 4.7×
Monthly cashflow live
- Estimated rent
- $2,745 high interval (Pro) →
- Mortgage (P&I)
- −$813
- Tax from tax record
- −$39 /mo · $470/yr
- Insurance
- −$65
- HOA
- −$0
- Vacancy / Maint / Mgmt
- −$576
- Net cashflow
- $1,252
Break-even live
Sensitivity live
| Price | -10% $1,340 | -5% $1,296 | +0% $1,252 | +5% $1,208 | +10% $1,164 |
|---|---|---|---|---|---|
| Rent | -10% $1,035 | -5% $1,143 | +0% $1,252 | +5% $1,360 | +10% $1,469 |
| Rate | -1.0pp $1,330 | -0.5pp $1,291 | base $1,252 | +0.5pp $1,212 | +1.0pp $1,171 |
UW: 25.0% down · 7.5% · 30yr · 1.5% tax · 5.0% vac · 8.0% maint · 8.0% mgmt
Financing live
Cash to close
- Down payment
- $38,750
- Closing costs
- $4,650
- Reserves months
- —
- Total cash needed
- —
Loan-product check · same deal, 3 products live
Conventional
25% down · 7.5% · 30yr
- Down + closing
- —
- Monthly P&I
- —
- Monthly cashflow
- —
- DSCR
- —
- Eligible?
- —
Personal DTI + credit; lowest rate.
DSCR
20% down · 8.5% · 30yr
- Down + closing
- —
- Monthly P&I
- —
- Monthly cashflow
- —
- DSCR
- —
- Eligible?
- —
No personal income docs; deal must DSCR.
Hard money
10% down · 12.0% · 12mo
- Down + closing
- —
- Monthly P&I
- —
- Monthly cashflow
- —
- DSCR
- —
- Eligible?
- —
Short-term bridge; refi at stabilization.
Rent comps 13 comps
| Address | Beds | Baths | Sqft | Rent | $/sqft | DOM | Units | Dist |
|---|---|---|---|---|---|---|---|---|
| 1018 Bellevue Ave Santa Rosa, CA | 1.0–4.0 | 1.0–2.0 | 1010 | $2,145 | $2.12 | 14d | 1 | 0.29mi |
| 240 Burt St Santa Rosa, CA | 1.0–2.0 | 1.0–2.0 | 742 | $2,563 | $3.45 | 14d | 10 | 0.43mi |
| 2327 Summercreek Dr Santa Rosa, CA | 1.0–2.0 | 1.0–2.0 | 1083 | $2,920 | $2.69 | 14d | 6 | 0.47mi |
| 325 Yolanda Ave Santa Rosa, CA | 1.0–3.0 | 1.0–2.0 | 1144 | $3,526 | $3.08 | 14d | 15 | 0.61mi |
| 2585 Kenton Ct Unit B Santa Rosa, CA | 2.0 | 1.0 | 789 | $2,150 | $2.72 | 14d | 1 | 0.74mi |
| 2350 Corby Ave Santa Rosa, CA | 2.0 | 1.0 | 903 | $2,185 | $2.42 | 14d | 1 | 0.86mi |
| 1501 Patty Pl Unit 1555 Santa Rosa, CA | 2.0 | 2.0 | 747 | $1,995 | $2.67 | 14d | 1 | 0.86mi |
| 1501 Patty Pl Unit 1591 Santa Rosa, CA | 2.0 | 2.0 | 747 | $2,500 | $3.35 | 14d | 1 | 0.86mi |
| 1501 Patty Pl Unit 3075 Santa Rosa, CA | 3.0 | 2.0 | 1047 | $2,850 | $2.72 | 14d | 1 | 0.86mi |
| 1020 Kawana Springs Rd Santa Rosa, CA | 1.0–3.0 | 1.0–2.0 | 890 | $3,549 | $3.99 | 14d | 27 | 0.95mi |
| 2146 Bedford St Unit 2130-101 Santa Rosa, CA | 2.0 | 2.0 | 920 | $2,450 | $2.66 | 14d | 1 | 0.95mi |
| 2111 Kawana Springs Rd Santa Rosa, CA | 1.0–3.0 | 1.0–2.0 | 936 | $3,465 | $3.70 | 13d | 8 | 1.03mi |
| 147 Colgan Ave Santa Rosa, CA | 1.0–2.0 | 1.0 | 623 | $1,941 | $3.12 | 14d | 3 | 1.20mi |
Listing history 24 events
-
2026-06-18days on market $155,000 Active 94 DOM
-
2026-06-17days on market $155,000 Active 93 DOM
-
2026-06-16days on market $155,000 Active 92 DOM
-
2026-06-15days on market $155,000 Active 91 DOM
-
2026-06-14days on market $155,000 Active 89 DOM
-
2026-06-13days on market $155,000 Active 88 DOM
-
2026-06-10days on market $155,000 Active 86 DOM
-
2026-06-09days on market $155,000 Active 85 DOM
-
2026-06-08days on market $155,000 Active 84 DOM
-
2026-06-07days on market $155,000 Active 83 DOM
-
2026-06-05days on market $155,000 Active 80 DOM
-
2026-06-03days on market $155,000 Active 79 DOM
-
2026-06-02days on market $155,000 Active 78 DOM
-
2026-06-01days on market $155,000 Active 77 DOM
-
2026-05-31days on market $155,000 Active 76 DOM
-
2026-05-30days on market $155,000 Active 75 DOM
-
2026-05-11price $155,000
-
2026-04-16price $160,000
-
2026-03-16$165,000 Active
-
2011-12-05soldstatus $44,000 Sold 225-char remark
Show marketing remark (225 chars)
Clean 3 bedroom close to shopping, freeway and transportation. Bedrooms are split, master on one end and 2 bedrooms and bath on the other. Central kitchen with attached laundry room, spacious living room. Move in condition!!!
-
2011-12-02status Contingent (No Show) 225-char remark
Show marketing remark (225 chars)
Clean 3 bedroom close to shopping, freeway and transportation. Bedrooms are split, master on one end and 2 bedrooms and bath on the other. Central kitchen with attached laundry room, spacious living room. Move in condition!!!
-
2011-10-07$49,900 Active 225-char remark
Show marketing remark (225 chars)
Clean 3 bedroom close to shopping, freeway and transportation. Bedrooms are split, master on one end and 2 bedrooms and bath on the other. Central kitchen with attached laundry room, spacious living room. Move in condition!!!
-
2011-09-02historical Withdrawn - Cancel
-
2011-06-30$69,900 Active
ⓘ Source: listings_history table (triggers on properties + properties_extension) + one-shot
backfill from property_details.listing_events for pre-trigger history.
Tax reassessment forecast CA · Resets to sale price
- Current annual tax
- $470 · $39/mo
- Projected year-2 tax
- $1,178 · $98/mo
- Expected delta
- +$708/yr (+$59/mo · 150.6%)
ⓘ Screening estimate from a state-policy table — verify with the county assessor before closing.
Climate risk First Street
- Flood 3/10 Moderate FEMA zone X (unshaded) · 20% chance over 30 yrs
- Wildfire 6/10 Major
- Heat 4/10 Moderate 7 d/yr ≥92°F today · 16 d/yr by 30 yrs out
- Wind 1/10 Low
- Air quality 8/10 Severe 15 unhealthy d/yr today · 17 by 30 yrs out
Nearby sold comps map
Loading sold comps map…
Walkable amenities ~0.75 mi
Loading nearby amenities…
Taxation est. · year 1
- Rental income
- $32,939
- − Mortgage interest
- −$8,682
- − Property taxes
- −$470
- − Insurance
- −$775
- − Repairs & maintenance
- −$2,635
- − Management
- −$2,635
- − Depreciation
- −$4,509
- Taxable income
- $13,232
- Est. tax owed @ 24.0%
- −$3,176
- After-tax cash flow
- $11,847/yr
For passive investors: Depreciation is non-cash, so a rental often shows a tax loss while cash-flowing — sheltering income. Rental losses are passive: they offset passive income freely, and up to $25,000/yr can offset ordinary (W-2) income if you actively participate and your MAGI is under $100k (phasing out to $0 by $150k); unused losses carry forward. On sale, claimed depreciation is recaptured at up to 25%, and gains may owe capital-gains tax (a 1031 exchange can defer both). Figures are a year-1 estimate at your 24.0% rate — not tax advice; consult a CPA.
Schools (NCES district)
- District
- Santa Rosa High
- NCES district ID
- 0635830
- Math proficiency
- 31% —
- Reading proficiency
- 47% —
- Median HH income
- $62,000
- Composite
- 37.25/100
- National rank
- #8972
- State rank
- #703 of 1400 in CA
Livability — Santa Rosa
- Score
- 75/100
- State rank
- #112
- US rank
- #3940
Category grades
Schools grade is shown separately in the Schools card above.
Census & demographics
- Census place
- Santa Rosa, CA
- County
- Sonoma County · 449,805 people
- City population
- 210,074
- Metro
- Santa Rosa-Petaluma, CA
- Population (ZIP)
- 42,036
- Household income
- $82,863
- Rent vs Own
- Severe rent burden
- 1943.0
Population outlook (Sonoma County) Hauer SSP2
- Today (2025)
- 539,935 people
- By 2030
- 554,870 · +2.8%
- By 2040
- 573,262 · +6.2%
- By 2050
- 580,715 · +7.6%
- By 2075
- 579,229 · +7.3%
- By 2100
- 547,835 · +1.5%
Race, ethnicity, and origin ACS 2023
- Neighborhood character
- Diverse neighborhood (Simpson 0.56)
- Race & ethnicity
- Hispanic / Latino 59% White 29% Two or more races 13% Asian 7% Black 2% Native American 1%
- Hispanic origin (detail)
- Mexican 50% Puerto Rican 1%
- Common ancestry
- Lithuanian 1% Romanian 1% Italian 1%
- Foreign-born
- 32% · Canada, Vietnam, China
- Languages at home
- 42% English-only · Spanish 50% Other Indo-European 2% Other Asian/Pacific 1%
Political lean MEDSL · Sonoma
- 2024 margin
- Solid D (+46.2) · D 71.4% · R 25.2% · Other 3.3%
- 2008→2024 swing
- -3.4pp toward R · 2008: 49.6pp · 2024: 46.2pp
- All cycles
- 2024: D+46.2 2020: D+51.5 2016: D+47.9 2012: D+44.9 2008: D+49.6
Not yet ingested
- Civics
- —
Market trends
- HPI YoY
- ▼ -852.74%
- Current HPI
- 256.4307
- Rent YoY
- ▲ 2.93%
- Metro
- Santa Rosa-Petaluma, CA
- State GDP YoY
- ▲ 3.21%
- F500 in state
- 116
Industry mix (Fortune 500 HQ in CA)
| Industry | F500 HQs | Revenue |
|---|---|---|
| Technology | 27 | $1,492B |
|
||
| Financial Services | 3 | $174B |
|
||
| Retail | 3 | $44B |
|
||
| Insurance | 3 | $26B |
|
||
| Media / Entertainment | 2 | $115B |
|
||
| Pharmaceuticals / Biotech | 2 | $62B |
|
||
Price history
+121.7% since first listed8 events — show timeline
- 2026-05-11 Price Changed $155,000 BAREIS
- 2026-04-16 Price Changed $160,000 BAREIS
- 2026-03-16 Listed $165,000 BAREIS
- 2011-12-05 Sold (MLS) $44,000 BAREIS
- 2011-12-02 Pending — BAREIS
- 2011-10-07 Listed $49,900 BAREIS
- 2011-09-02 Delisted — BAREIS
- 2011-06-30 Listed $69,900 BAREIS
Property tax history
-1.4%/yrLatest (2025): $470 · -0.8% YoY. Source: county tax records.
Cash-flow waterfall
monthlySold comps — $/sqft
last 12 mo · ≤1 miLoading sold comps…