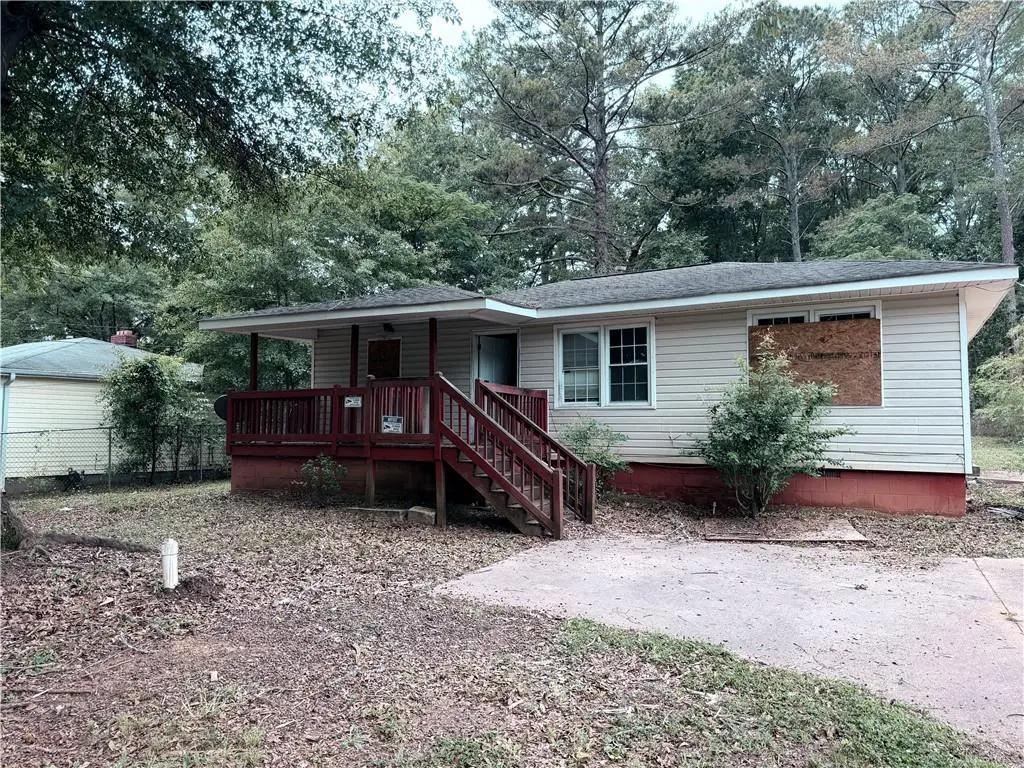
8122 Puckett St · Covington, GA
Flood risk 1/10 · Minimal
- FEMA flood zone
- X (unshaded)
- Chance of flooding over 30 yrs
- 0.0%
- Est. flood insurance / yr
- $507 – $1,088
Fire risk 3/10 · Minor
- Est. fire insurance / yr
- $963 – $1,789
Heat risk 6/10 · Moderate
- Hot days now (above 106°F)
- 7 days/yr
- Hot days in 30 yrs
- 18 days/yr
Wind risk 6/10 · Moderate
- Chance of severe wind over 30 yrs
- 27.0%
Air-quality risk 4/10 · Minor
- Unhealthy air days now
- 5 days/yr
- Unhealthy air days in 30 yrs
- 6 days/yr
Risk factors via First Street. Map © Google.
Why this score? — see what drove the B+ grade
The composite is a weighted blend of 9 inputs, each scored 0–100. Each bar is that input's sub-score; the figure is the points it added to the 100-point composite (weight × sub-score).
- Cash flow +30.0/30.0
- ARV discount +15.0/15.0
- 1% rule +10.0/10.0
- DSCR +10.0/10.0
- Livability +3.0/5.0
- Rent growth +2.6/5.0
- Condition / age +2.5/5.0
- Schools +1.9/10.0
- Appreciation +0.0/10.0
$109,900
🖨 Deal sheet 📄 Offer letter ✓ Due diligence
Listing remarks MLS
This newly renovated hone has 4 bedrooms and 2 full bathroom. This home features a private backyard and laminate flooring. This home sits on 1299 sqft of land and is a perfect starter home for any family. Home is getting a new roof.
Key facts
- 9,583 sq ft lot
- Built 1965
- Listed 15 days
Property features AI
Exterior
- Parking: Driveway; Open parking available
- Utilities: Public water; Public sewer; Electricity (110 volts); Electricity, sewer and water available
- Home design: One-level property
- Construction: Vinyl siding exterior; Composition roof; Block foundation; Built on .22-acre lot
- Exterior features: City street frontage; Asphalt road access
Interior
- Kitchen: Kitchen features: Other; Separate dining room
- Bedrooms: Four main-level bedrooms; Bedroom features: Other
- Flooring: Hardwood flooring; Other flooring
- Bathrooms: One full bathroom (main level)
- Heating & cooling: Central heating; Central air conditioning
- Interior features: No shared/common walls; Crawl space basement; Property in fixer condition
- Laundry & utility: Laundry features: Other
Neighborhood map
What this means for you Summary
Snapshot
- This is a 4-bed/2.0-bath single-family listed at $110k.
Deal economics
- At list price, monthly cash flow is $658 ($8k/yr) — positive.
- The deal already cash-flows at list — no discount required.
- Meets the 1% rule at list price ($2k rent vs $110k).
- Recommended offer: $108k (1.5% below list) — sets the bar for market timing.
- Cap rate 13.5% vs local median 3.8% in Covington — top-decile yield for the area; either an underpriced asset or a hidden risk that comps aren't pricing in. Stress-test before assuming the spread holds.
Location & tenants
- Location reads 59/100 on livability (#396 in GA) — a working-class tenant base; expect higher turnover. Strengths: cost of living A+, housing A+, health & safety B+; Watch: schools F, crime F, amenities F.
- Newton County (suburban): math 17% / reading 26% proficiency, ranked #137 of 174 in GA (top 79%) — low school quality limits family demand, transient renter base, plan for 1-2y turnover.
- Market conditions: Rents flat; 479 active listings in the ZIP; 15 comparable units currently listed for rent nearby; rentals at typical pace (median 18d on market — plan ~3-4 weeks tenant-placement turnaround); 1,480 units permitted in Newton County in 2024 (702 in 5+ unit buildings).
- This rent runs 31% of the median local income ($72k/yr) — at the standard rent-burdened threshold; future hikes will face affordability resistance.
Forward outlook
- Local home prices are declining (-3.0%/yr); year-one equity from $760 of loan paydown is wiped out by about $3k of value loss. Plan a longer hold.
- Newton County population projected at +23% by 2050 — long-run rental-demand tailwind backs the buy-and-hold thesis.
- At projected returns (-3.0% appreciation + 0.5% rent growth), your $31k cash investment doubles in ~6 years — after that, you're playing with house money.
Negotiation context
- It's been on market 15 days — a 2% lower offer ($108k) is reasonable based on typical stale-listing flexibility.
- 10 sale attempts since 10y ago with the ask held roughly flat each time — persistent listings suggest the price (not the market) is what's stuck; bring a comps-based counter.
- Current owner paid $58k; list at $110k implies a 89% gain — meaningful room to come down on a strong offer.
Risks & watch-outs
- Climate carrying-cost: major wind risk, 27% chance of damaging wind over 30y; extreme-heat days projected 7→18/yr by 2055 (HVAC capex compounding) — expect insurance premiums to compound above CPI over the hold.
Questions for the listing agent
- Built in 1965 — when were the roof, HVAC, electrical panel, plumbing, and water heater last replaced?
- Is there a deadline driving the sale (1031 exchange, divorce, estate, relocation)? That informs how much negotiation room exists.
- Schools are F-rated, which usually means shorter tenancies and higher turnover. Who's the typical renter profile here, and what's been the actual vacancy rate?
- Crime grade is F in this area — have there been break-ins, vandalism, or insurance claims at this property in the last 3 years? What carrier currently insures it and at what premium?
- What's the average days-on-market for RENTAL listings here right now (not sales)? A rising rental-DOM trend means longer vacancies and softer asking-rent achievability than the comps imply.
- What's the recent tenant-quality profile in this submarket — average credit score on applications, eviction rate, late-payment / NSF rate, and stable-employment percentage? A property-management company in the area should have these aggregated.
- How much new for-sale + rental construction is in the pipeline within 1–3 miles? Heavy new supply typically softens prices + rents 12–24 months out; constrained supply supports both.
Investment metrics
- 1% rule
- 1.71% ✓
- Cap rate
- 13.48%
- Cash-on-cash
- 25.67%
- DSCR
- 2.14
- GRM
- 4.9
CMA / ARV
- ARV (on-the-fly)
- $185,757
- Comps found
- 12
Show comp detail 12 sales within ~0.75 mi
| Address | Dist | Beds/Ba | Sqft | Sold | Price | $/sf | Match |
|---|---|---|---|---|---|---|---|
| 8151 Puckett St SW | 0.07mi | 3/1.0 (-1) | 1,306 (+0%) | 2mo | $100,000 | $77 | 86 |
| 9176 Carr Cir SW | 0.18mi | 3/1.0 (-1) | 1,236 (-5%) | 6mo | $108,000 | $87 | 69 |
| 9175 Carr Cir | 0.20mi | 3/1.5 (-1) | 1,230 (-5%) | 7mo | $99,900 | $81 | 69 |
| 9188 Jefferson Village Dr SW | 0.40mi | 5/2.0 (+1) | 1,300 (+0%) | 10mo | $233,700 | $180 | 68 |
| 9151 Jefferson Village Dr SW | 0.33mi | 3/2.5 (-1) | 1,308 (+1%) | 11mo | $230,000 | $176 | 67 |
| 9118 Carr Cir SW | 0.09mi | 3/2.0 (-1) | 1,450 (+12%) | 9mo | $165,000 | $114 | 64 |
| 6255 Green Acres Dr SW | 0.37mi | 3/1.0 (-1) | 1,296 (-0%) | 13mo | $190,000 | $147 | 63 |
| 10149 Puckett St SW | 0.45mi | 3/1.5 (-1) | 1,256 (-3%) | 10mo | $180,000 | $143 | 58 |
| 9106 Griffin Ln SW | 0.62mi | 3/2.0 (-1) | 1,350 (+4%) | 4mo | $89,000 | $66 | 56 |
| 6138 Green Acres Dr SW | 0.42mi | 3/2.0 (-1) | 1,438 (+11%) | 2mo | $329,900 | $229 | 56 |
| 10164 Sunny Dr SW | 0.74mi | 4/1.0 | 1,378 (+6%) | 10mo | $200,000 | $145 | 43 |
| 10121 Morris Dr SW | 0.62mi | 3/1.0 (-1) | 1,449 (+12%) | 2mo | $110,000 | $76 | 41 |
Match score weights: distance 35% · size 25% · config 20% · recency 20%. Top-matched comps best support the ARV.
Projected returns pro-forma
-3.0% appreciation · 0.52% rent growth · sell at horizon
- IRR
- 16.3%
- Equity multiple
- 1.64×
- Total profit
- $19,604
- Equity at exit
- $16,386
- IRR
- 23.0%
- Equity multiple
- 2.74×
- Total profit
- $53,463
- Equity at exit
- $9,502
Cash invested: $30,772 (down + closing). Projections, not guarantees.
Landlord ↔ Tenant lean methodology
- Overall (STATE)
- 90 Strongly Landlord-Friendly
- State Georgia
- 90 Strongly Landlord-Friendly · R+3
- County
- — inherits STATE
- City
- — inherits STATE
ZIP-level market 30014
- Home prices YoY
- -19.2%
- Rents YoY
- 0.5%
- Active inventory
- 479
- Price-to-rent
- 4.9×
Monthly cashflow live
- Estimated rent
- $1,879 high interval (Pro) →
- Mortgage (P&I)
- −$576
- Tax from tax record
- −$204 /mo · $2,454/yr
- Insurance
- −$46
- HOA
- −$0
- Vacancy / Maint / Mgmt
- −$395
- Net cashflow
- $658
Break-even live
UW: 25.0% down · 7.5% · 30yr · 1.5% tax · 5.0% vac · 8.0% maint · 8.0% mgmt
Financing live
Cash to close
- Down payment
- $27,475
- Closing costs
- $3,297
- Reserves months
- —
- Total cash needed
- —
Loan-product check · same deal, 3 products live
Conventional
25% down · 7.5% · 30yr
- Down + closing
- —
- Monthly P&I
- —
- Monthly cashflow
- —
- DSCR
- —
- Eligible?
- —
Personal DTI + credit; lowest rate.
DSCR
20% down · 8.5% · 30yr
- Down + closing
- —
- Monthly P&I
- —
- Monthly cashflow
- —
- DSCR
- —
- Eligible?
- —
No personal income docs; deal must DSCR.
Hard money
10% down · 12.0% · 12mo
- Down + closing
- —
- Monthly P&I
- —
- Monthly cashflow
- —
- DSCR
- —
- Eligible?
- —
Short-term bridge; refi at stabilization.
Rent comps 15 comps
| Address | Beds | Baths | Sqft | Rent | $/sqft | DOM | Units | Dist |
|---|---|---|---|---|---|---|---|---|
| 8246 Collier St SW Covington, GA | 3.0 | 1.0 | 1225 | $1,300 | $1.06 | 43d | 1 | 0.25mi |
| 9123 Jefferson Village Dr SW Covington, GA | 3.0 | 2.0 | 1220 | $1,750 | $1.43 | 22d | 1 | 0.27mi |
| 9135 Jefferson Village Dr SW Covington, GA | 3.0 | 2.5 | 1126 | $1,736 | $1.54 | 5d | 1 | 0.29mi |
| 6100 Greenleaf Ct SW Covington, GA | 3.0 | 1.0 | 1000 | $1,400 | $1.40 | 16d | 1 | 0.35mi |
| 6103 Oakwood Cir SW Covington, GA | 3.0 | 2.0 | 1372 | $900 | $0.66 | 17d | 1 | 0.39mi |
| 6154 Green Acres Dr SW Covington, GA | 3.0 | 1.0 | 1040 | $1,900 | $1.83 | 24d | 1 | 0.42mi |
| 9161 Thrash St SW Covington, GA | 4.0 | 2.0 | 1272 | $1,481 | $1.16 | 43d | 1 | 0.64mi |
| 10154 Allen Dr SW Covington, GA | 3.0 | 2.0 | 1056 | $1,800 | $1.70 | 20d | 1 | 0.80mi |
| 10154 Allen Dr SW Covington, GA | 3.0 | 2.0 | 1056 | $1,800 | $1.70 | 5d | 1 | 0.80mi |
| 4112 Dorchester Dr SE Covington, GA | 3.0–5.0 | 2.5–4.0 | 2299 | $3,022 | $1.31 | 1d | 1 | 1.05mi |
| 6126 Avery St SW Covington, GA | 3.0 | 2.5 | 1600 | $1,881 | $1.18 | 24d | 1 | 1.15mi |
| 100 Fleeta Dr Covington, GA | 3.0 | 2.0 | 1379 | $1,550 | $1.12 | 5d | 1 | 1.17mi |
| 7731 Fawn Cir Covington, GA | 3.0 | 2.5 | 1737 | $2,400 | $1.38 | 43d | 1 | 1.19mi |
| 8247 Spillers Dr SW Covington, GA | 3.0 | 1.5 | 1530 | $1,500 | $0.98 | 12d | 1 | 1.45mi |
| 375 Stone Ridge Way Covington, GA | 3.0 | 2.0 | 1478 | $1,870 | $1.27 | 5d | 1 | 1.48mi |
Listing history 12 events
-
2026-06-18status $109,900 Pending 15 DOM
-
2026-06-18days on market $109,900 Active 15 DOM
-
2026-06-17days on market $109,900 Active 14 DOM
-
2026-06-16days on market $109,900 Active 13 DOM
-
2026-06-15days on market $109,900 Active 12 DOM
-
2026-06-13days on market $109,900 Active 10 DOM
-
2026-06-13days on market $109,900 Active 9 DOM
-
2026-06-09days on market $109,900 Active 6 DOM
-
2026-06-08days on market $109,900 Active 5 DOM
-
2026-06-07days on market $109,900 Active 4 DOM
-
2026-06-04remarks 297-char remark
-
2026-06-04$109,900 Active 1 DOM
ⓘ Source: listings_history table (triggers on properties + properties_extension) + one-shot
backfill from property_details.listing_events for pre-trigger history.
Tax reassessment forecast GA · Resets to sale price
- Current annual tax
- $2,454 · $204/mo
- Projected year-2 tax
- $2,454 · $204/mo
- Expected delta
- $0/yr ($0/mo · 0.0%)
ⓘ Screening estimate from a state-policy table — verify with the county assessor before closing.
Climate risk First Street
- Flood 1/10 Low FEMA zone X (unshaded) · 0% chance over 30 yrs
- Wildfire 3/10 Moderate
- Heat 6/10 Major 7 d/yr ≥106°F today · 18 d/yr by 30 yrs out
- Wind 6/10 Major 27% chance of damaging wind over 30 yrs
- Air quality 4/10 Moderate 5 unhealthy d/yr today · 6 by 30 yrs out
Nearby sold comps map
Loading sold comps map…
Walkable amenities ~0.75 mi
Loading nearby amenities…
Taxation est. · year 1
- Rental income
- $22,554
- − Mortgage interest
- −$6,156
- − Property taxes
- −$2,454
- − Insurance
- −$550
- − Repairs & maintenance
- −$1,804
- − Management
- −$1,804
- − Depreciation
- −$3,197
- Taxable income
- $6,589
- Est. tax owed @ 24.0%
- −$1,581
- After-tax cash flow
- $6,317/yr
For passive investors: Depreciation is non-cash, so a rental often shows a tax loss while cash-flowing — sheltering income. Rental losses are passive: they offset passive income freely, and up to $25,000/yr can offset ordinary (W-2) income if you actively participate and your MAGI is under $100k (phasing out to $0 by $150k); unused losses carry forward. On sale, claimed depreciation is recaptured at up to 25%, and gains may owe capital-gains tax (a 1031 exchange can defer both). Figures are a year-1 estimate at your 24.0% rate — not tax advice; consult a CPA.
Schools (NCES district)
- District
- Newton County
- NCES district ID
- 1303930
- Math proficiency
- 17% ▼ -13.00%
- Reading proficiency
- 26% ▼ -8.00%
- Median HH income
- $50,768
- Composite
- 19.2/100
- National rank
- #8816
- State rank
- #137 of 174 in GA
Livability — Covington
- Score
- 59/100
- State rank
- #396
- US rank
- #19602
Category grades
Schools grade is shown separately in the Schools card above.
Census & demographics
- Census place
- Covington, GA
- County
- Newton County · 104,393 people
- City population
- 104,393
- Metro
- Atlanta-Sandy Springs-Alpharetta, GA
- Population (ZIP)
- 41,425
- Household income
- $72,254
- Rent vs Own
- Severe rent burden
- 1934.0
Population outlook (Newton County) Hauer SSP2
- Today (2025)
- 118,372 people
- By 2030
- 124,234 · +5.0%
- By 2040
- 135,550 · +14.5%
- By 2050
- 145,309 · +22.8%
- By 2075
- 166,843 · +40.9%
- By 2100
- 175,800 · +48.5%
Race, ethnicity, and origin ACS 2023
- Neighborhood character
- Diverse neighborhood (Simpson 0.59)
- Race & ethnicity
- White 53% Black 35% Hispanic / Latino 7% Two or more races 6% Asian 2%
- Hispanic origin (detail)
- Mexican 3%
- Common ancestry
- Italian 2% Slovak 2% Serbian 1%
- Foreign-born
- 7% · Canada
- Languages at home
- 93% English-only · Spanish 5% Other Indo-European 1%
Political lean MEDSL · Newton
- 2024 margin
- D (+15.1) · D 57.3% · R 42.2%
- 2008→2024 swing
- +14.0pp toward D · 2008: 1.2pp · 2024: 15.1pp
- All cycles
- 2024: D+15.1 2020: D+10.9 2016: D+2.4 2012: D+2.0 2008: D+1.2
Not yet ingested
- Civics
- —
Market trends
- HPI YoY
- ▼ -64.50%
- Current HPI
- 270.9868
- Rent YoY
- ▲ 0.52%
- Metro
- Atlanta-Sandy Springs-Alpharetta, GA
- State GDP YoY
- ▲ 2.66%
- F500 in state
- 28
Industry mix (Fortune 500 HQ in GA)
| Industry | F500 HQs | Revenue |
|---|---|---|
| Paper / Packaging | 2 | $29B |
|
||
| Retail | 1 | $160B |
|
||
| Transportation / Logistics | 1 | $91B |
|
||
| Airlines | 1 | $62B |
|
||
| Consumer Goods | 1 | $47B |
|
||
| Utilities | 1 | $25B |
|
||
Price history
+449.5% since first listed25 events — show timeline
- 2026-06-03 Listed $109,900 FMLS
- 2026-03-27 Listing Removed — GAMLS
- 2026-03-23 Price Changed $139,000 GAMLS
- 2026-03-20 Relisted — GAMLS
- 2026-03-18 Listing Removed — GAMLS
- 2026-03-11 Listed $145,000 GAMLS
- 2017-04-26 Sold (MLS) $58,000 GAMLS
- 2017-03-29 Pending — GAMLS
- 2017-03-28 Relisted — GAMLS
- 2017-03-28 Pending — GAMLS
- 2017-03-28 Price Changed $58,000 GAMLS
- 2017-03-24 Relisted — GAMLS
- 2017-03-14 Pending — GAMLS
- 2017-03-06 Price Changed $55,900 GAMLS
- 2017-03-06 Relisted — GAMLS
- 2017-02-18 Pending — GAMLS
- 2017-02-08 Listed $59,900 GAMLS
- 2017-02-01 Listing Removed — GAMLS
- 2017-01-29 Relisted — GAMLS
- 2017-01-03 Pending — GAMLS
- 2016-12-20 Relisted — GAMLS
- 2016-11-04 Pending — GAMLS
- 2016-10-20 Listed $59,900 GAMLS
- 2006-05-09 Sold (Public Records) $62,000 Public Records
- 2002-10-25 Sold (Public Records) $20,000 Public Records
Property tax history
+5.1%/yrLatest (2025): $2,454 · +18.0% YoY. Source: county tax records.
Cash-flow waterfall
monthlySold comps — $/sqft
last 12 mo · ≤1 miLoading sold comps…