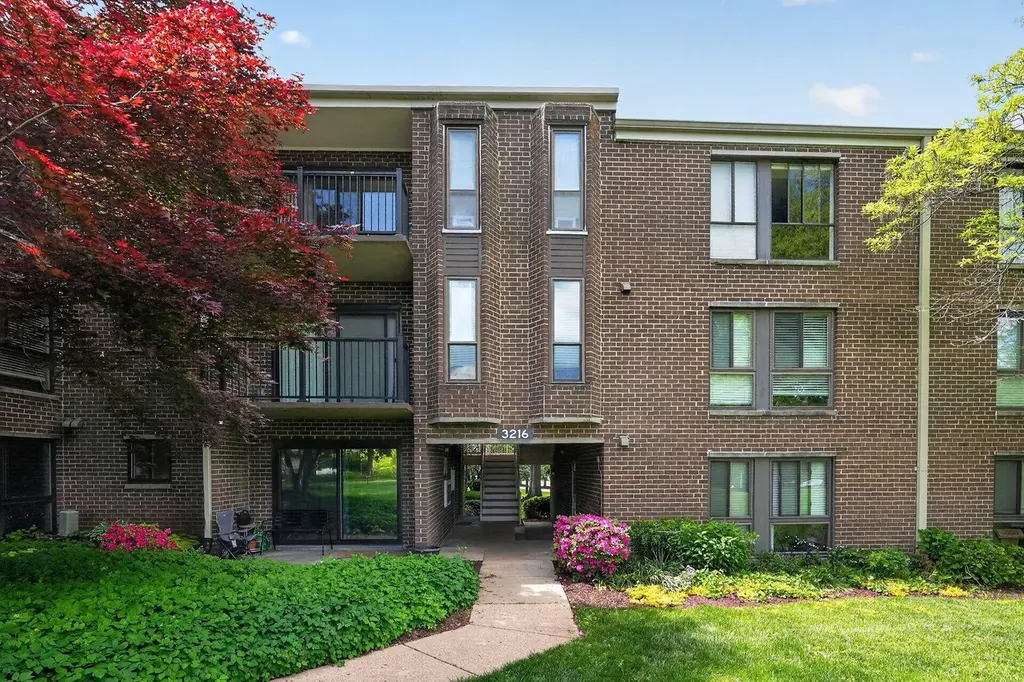
3216 Spartan #40 · Olney, MD
Flood risk 1/10 · Minimal
- FEMA flood zone
- X (unshaded)
- Chance of flooding over 30 yrs
- 0.0%
- Est. flood insurance / yr
- $507 – $1,088
Fire risk 3/10 · Minor
- Est. fire insurance / yr
- $755 – $1,403
Heat risk 6/10 · Moderate
- Hot days now (above 102°F)
- 7 days/yr
- Hot days in 30 yrs
- 15 days/yr
Wind risk 4/10 · Minor
- Chance of severe wind over 30 yrs
- 14.0%
Air-quality risk 3/10 · Minor
- Unhealthy air days now
- 2 days/yr
- Unhealthy air days in 30 yrs
- 3 days/yr
Risk factors via First Street. Map © Google.
Why this score? — see what drove the C- grade
The composite is a weighted blend of 9 inputs, each scored 0–100. Each bar is that input's sub-score; the figure is the points it added to the 100-point composite (weight × sub-score).
- Cash flow +18.5/30.0
- ARV discount +7.5/15.0
- 1% rule +7.4/10.0
- DSCR +5.8/10.0
- Livability +4.0/5.0
- Schools +3.6/10.0
- Rent growth +2.5/5.0
- Condition / age +2.5/5.0
- Appreciation +0.0/10.0
$239,000
🖨 Deal sheet (PDF) 📄 Offer letter ✓ Due diligence
Listing remarks
Renovated Top Floor 3-Bedroom Unit in this desirable location of Olney! Completely renovated in 2020, this unit shows like a brand new home with new LVP floorings in the living room, dining room and hallway areas. Gourmet kitchen features granite countertops, stainless steel appliances and sleek white cabinets. Spacious primary bedroom with large windows, walk-in closet and half bath. Two other bedrooms provide ample room and closet space. Full size bathroom with in-unit Washer and Dryer. Relax at the over-sized balcony overlooking trees and greenery! Condo fees include water and electricity for heating and cooling (excluding plug-in electricity). Convenient location near grocery stores,
Key facts
- $622 HOA
- 2 parking spots
- Community pool
Property features AI
Finance
- HOA & community: Monthly condo fee of $622.24; HOA covers air conditioning, common area maintenance, heat, and water; Community amenities include pool, picnic area, and playground
Exterior
- Parking: Parking lot with 2 spaces (total 2 garage/parking spaces)
- Utilities: Public water; Public sewer; Electric service
- Home design: Condominium unit (Unit/Flat); Garden-style building (1–4 floors); Entry on level 3; Pets allowed with size/weight restrictions
- Construction: Brick construction; Year of major renovation: 2020
- Exterior features: Community outdoor pool; Picnic area; Tot lots/playground; Above-grade other structures
Interior
- Bedrooms: Three bedrooms on the main level
- Bathrooms: One full bathroom; One half bathroom
- Heating & cooling: Forced air heating (electric); Central air conditioning (electric); Electric hot water
- Interior features: No one lives above the unit; No basement
- Laundry & utility: Washer/dryer hookup in the unit
Neighborhood map
What this means for you Summary
Snapshot
- This is a 3-bed/1.5-bath condo listed at $239k.
Deal economics
- At list price, monthly cash flow is $228 ($3k/yr) — positive.
- The deal already cash-flows at list — no discount required.
- Meets the 1% rule at list price ($3k rent vs $239k).
- Cap rate 7.4% vs local median 2.9% in Olney — top-decile yield for the area; either an underpriced asset or a hidden risk that comps aren't pricing in. Stress-test before assuming the spread holds.
Location & tenants
- Location reads 81/100 on livability (#40 in MD, #1,468 nationally) — a professional / high-income tenant draw. Strengths: employment A+, housing A+, health & safety A; Watch: cost of living F.
- Montgomery County Public Schools (suburban): math 27% / reading 45% proficiency, ranked #3 of 24 in MD (top 12%) — families likely to look elsewhere, expect single-tenant / working-renter base with shorter leases.
- Zoned schools: Sherwood Elementary (math 33% / reading 38%, grade F, #136 of 860 statewide, top 16%, 521 students, 27% FRL); William H. Farquhar Middle (math 15% / reading 53%, grade F, #51 of 225 statewide, top 23%, 674 students, 32% FRL); James Hubert Blake High (math 47% / reading 65%, grade C, #83 of 222 statewide, top 38%, 1,784 students, 59% FRL).
- Market conditions: 82 active listings in the ZIP; 2 comparable units currently listed for rent nearby; high-income renter base; 3,880 units permitted in Montgomery County in 2024 (2,054 in 5+ unit buildings).
Forward outlook
- Local home prices are declining (-3.0%/yr); year-one equity from $2k of loan paydown is wiped out by about $7k of value loss. Plan a longer hold.
- Montgomery County population projected at +27% by 2050 — long-run rental-demand tailwind backs the buy-and-hold thesis.
Negotiation context
- Only 6 days on market — expect competitive offers; lowballing is unlikely to land.
- 2 sale attempts since 4y ago with the ask held roughly flat each time — persistent listings suggest the price (not the market) is what's stuck; bring a comps-based counter.
Risks & watch-outs
- Watch-outs: HOA is 21% of rent.
- Climate carrying-cost: extreme-heat days projected 7→15/yr by 2055 (HVAC capex compounding) — expect insurance premiums to compound above CPI over the hold.
Questions for the listing agent
- Built in 1973 — when were the roof, HVAC, electrical panel, plumbing, and water heater last replaced?
- What does the HOA fee cover, when was the last increase, and are there any pending special assessments or reserve-fund shortfalls?
- Any open or pending special assessments — roof, HVAC, plumbing, elevator, façade? What's the per-unit balance and payoff schedule, and is the seller paying it off at close or rolling it to the buyer?
- Is there a deadline driving the sale (1031 exchange, divorce, estate, relocation)? That informs how much negotiation room exists.
- Schools are A-rated — typically a magnet for longer-tenancy family renters. What's the average tenant stay here, and is there a school-zone premium baked into asking?
- What's the average days-on-market for RENTAL listings here right now (not sales)? A rising rental-DOM trend means longer vacancies and softer asking-rent achievability than the comps imply.
- What's the recent tenant-quality profile in this submarket — average credit score on applications, eviction rate, late-payment / NSF rate, and stable-employment percentage? A property-management company in the area should have these aggregated.
- How much new apartment / multifamily construction is in the pipeline within 1–3 miles? Heavy new supply (>2% of stock underway) typically softens rents 12–24 months out; light construction supports rent growth.
Investment metrics
- 1% rule
- 1.24% ✓
- Cap rate
- 7.44%
- Cash-on-cash
- 4.09%
- DSCR
- 1.18
- GRM
- 6.7
CMA / ARV
No comps found within radius.
Projected returns pro-forma
-3.0% appreciation · 3.0% rent growth · sell at horizon
- IRR
- -9.7%
- Equity multiple
- 0.64×
- Total profit
- $-23,875
- Equity at exit
- $35,636
- IRR
- -0.2%
- Equity multiple
- 0.99×
- Total profit
- $-765
- Equity at exit
- $20,664
Cash invested: $66,920 (down + closing). Projections, not guarantees.
Landlord ↔ Tenant lean methodology
- Overall (STATE)
- 27 Tenant-Leaning
- State Maryland
- 27 Tenant-Leaning · D+14
- County
- — inherits STATE
- City
- — inherits STATE
ZIP-level market 20832
- Active inventory
- 82
- Price-to-rent
- 6.7×
Monthly cashflow live
- Estimated rent
- $2,955 medium interval (Pro) →
- Mortgage (P&I)
- −$1,253
- Tax from tax record
- −$132 /mo · $1,581/yr
- Insurance
- −$100
- HOA
- −$622
- Vacancy / Maint / Mgmt
- −$621
- Net cashflow
- $228
Break-even live
Sensitivity live
| Price | -10% $363 | -5% $296 | +0% $228 | +5% $160 | +10% $93 |
|---|---|---|---|---|---|
| Rent | -10% $-5 | -5% $111 | +0% $228 | +5% $345 | +10% $462 |
| Rate | -1.0pp $348 | -0.5pp $289 | base $228 | +0.5pp $166 | +1.0pp $103 |
UW: 25.0% down · 7.5% · 30yr · 1.5% tax · 5.0% vac · 8.0% maint · 8.0% mgmt
Financing live
Cash to close
- Down payment
- $59,750
- Closing costs
- $7,170
- Reserves months
- —
- Total cash needed
- —
Loan-product check · same deal, 3 products live
Conventional
25% down · 7.5% · 30yr
- Down + closing
- —
- Monthly P&I
- —
- Monthly cashflow
- —
- DSCR
- —
- Eligible?
- —
Personal DTI + credit; lowest rate.
DSCR
20% down · 8.5% · 30yr
- Down + closing
- —
- Monthly P&I
- —
- Monthly cashflow
- —
- DSCR
- —
- Eligible?
- —
No personal income docs; deal must DSCR.
Hard money
10% down · 12.0% · 12mo
- Down + closing
- —
- Monthly P&I
- —
- Monthly cashflow
- —
- DSCR
- —
- Eligible?
- —
Short-term bridge; refi at stabilization.
Rent comps 2 comps
| Address | Beds | Baths | Sqft | Rent | $/sqft | DOM | Units | Dist |
|---|---|---|---|---|---|---|---|---|
| 18106 Windsor Hill Dr #102 Olney, MD | 2.0 | 1.5 | 1032 | $2,350 | $2.28 | 4d | 1 | 0.24mi |
| 18101 Marksman Cir Olney, MD | 1.0–3.0 | 1.0–2.0 | 992 | $2,716 | $2.74 | 0d | 8 | 0.34mi |
HOA detail condo
- Monthly dues
- $622 · $7,464/yr
- Likely covers
- waterelectric
- Assessments
- None detected in remarks — confirm with the listing agent.
Listing history 8 events
-
2026-05-06status Pending 850-char remark
-
2026-05-01$239,000 Active 850-char remark
-
2026-04-24historical $239,000 850-char remark
-
2022-08-08historical
-
2022-07-24$225,000 Active
-
2020-07-21soldstatus $181,000
-
1989-11-21soldstatus $85,000
-
1987-06-24soldstatus $57,000
ⓘ Source: listings_history table (triggers on properties + properties_extension) + one-shot
backfill from property_details.listing_events for pre-trigger history.
Tax reassessment forecast MD · Partial reset (capped growth)
- Current annual tax
- $1,581 · $132/mo
- Projected year-2 tax
- $2,093 · $174/mo
- Expected delta
- +$512/yr (+$43/mo · 32.4%)
ⓘ Screening estimate from a state-policy table — verify with the county assessor before closing.
Climate risk First Street
- Flood 1/10 Low FEMA zone X (unshaded) · 0% chance over 30 yrs
- Wildfire 3/10 Moderate
- Heat 6/10 Major 7 d/yr ≥102°F today · 15 d/yr by 30 yrs out
- Wind 4/10 Moderate 14% chance of damaging wind over 30 yrs
- Air quality 3/10 Moderate 2 unhealthy d/yr today · 3 by 30 yrs out
Nearby sold comps map
Loading sold comps map…
Walkable amenities ~0.75 mi
Loading nearby amenities…
Taxation est. · year 1
- Rental income
- $35,465
- − Mortgage interest
- −$13,388
- − Property taxes
- −$1,581
- − Insurance
- −$1,195
- − Repairs & maintenance
- −$2,837
- − Management
- −$2,837
- − HOA
- −$7,464
- − Depreciation
- −$6,953
- Taxable loss
- −$790
- Est. tax savings @ 24.0%
- +$190
- After-tax cash flow
- $2,927/yr
For passive investors: Depreciation is non-cash, so a rental often shows a tax loss while cash-flowing — sheltering income. Rental losses are passive: they offset passive income freely, and up to $25,000/yr can offset ordinary (W-2) income if you actively participate and your MAGI is under $100k (phasing out to $0 by $150k); unused losses carry forward. On sale, claimed depreciation is recaptured at up to 25%, and gains may owe capital-gains tax (a 1031 exchange can defer both). Figures are a year-1 estimate at your 24.0% rate — not tax advice; consult a CPA.
Schools (NCES district)
- District
- Montgomery County Public Schools
- NCES district ID
- 2400480
- Math proficiency
- 27% ▼ -21.00%
- Reading proficiency
- 45% ▼ -10.00%
- Median HH income
- $97,191
- Composite
- 35.62/100
- National rank
- #4889
- State rank
- #3 of 24 in MD
Livability — Olney
- Score
- 81/100
- State rank
- #40
- US rank
- #1468
Category grades
Schools grade is shown separately in the Schools card above.
Census & demographics
- Census place
- Olney, MD
- County
- Montgomery County · 961,106 people
- City population
- 25,553
- Metro
- Washington-Arlington-Alexandria, DC-VA-MD-WV
- Population (ZIP)
- 25,553
- Household income
- $168,524
- Rent vs Own
- Severe rent burden
- 374.0
Population outlook (Montgomery County) Hauer SSP2
- Today (2025)
- 1,173,231 people
- By 2030
- 1,237,402 · +5.5%
- By 2040
- 1,365,115 · +16.4%
- By 2050
- 1,491,592 · +27.1%
- By 2075
- 1,803,893 · +53.8%
- By 2100
- 2,035,619 · +73.5%
Race, ethnicity, and origin ACS 2023
- Neighborhood character
- Diverse neighborhood (Simpson 0.64)
- Race & ethnicity
- White 56% Black 14% Two or more races 12% Hispanic / Latino 12% Asian 12%
- Hispanic origin (detail)
- Common ancestry
- Scotch-Irish 4% Italian 4% Romanian 3%
- Foreign-born
- 22% · Canada, South Korea, China
- Languages at home
- 73% English-only · Spanish 7% Other Indo-European 5% Korean 3%
Political lean MEDSL · Montgomery
- 2024 margin
- Solid D (+53.3) · D 75.2% · R 21.9% · Other 2.9%
- 2008→2024 swing
- +8.7pp toward D · 2008: 44.6pp · 2024: 53.3pp
- All cycles
- 2024: D+53.3 2020: D+59.6 2016: D+55.5 2012: D+43.4 2008: D+44.6
Not yet ingested
- Civics
- —
Market trends
- HPI YoY
- ▼ -359.69%
- Current HPI
- 270.4649
- Rent YoY
- —
- Metro
- Washington-Arlington-Alexandria, DC-VA-MD-WV
- State GDP YoY
- ▲ 2.97%
- F500 in state
- 12
Industry mix (Fortune 500 HQ in MD)
| Industry | F500 HQs | Revenue |
|---|---|---|
| Aerospace / Defense | 1 | $71B |
|
||
| Utilities | 1 | $25B |
|
||
| Hotels | 1 | $24B |
|
||
| Consumer Goods | 1 | $7B |
|
||
| Real Estate | 1 | $6B |
|
||
| Chemicals | 1 | $2B |
|
||
Price history
+320.9% since first listed9 events — show timeline
- 2026-06-03 Sold (MLS) $239,900 BRIGHT MLS
- 2026-05-06 Pending — BRIGHT MLS
- 2026-05-01 Listed $239,000 BRIGHT MLS
- 2026-04-24 Coming Soon $239,000 BRIGHT MLS
- 2022-08-08 Listing Removed — BRIGHT MLS
- 2022-07-24 Listed $225,000 BRIGHT MLS
- 2020-07-21 Sold (Public Records) $181,000 Public Records
- 1989-11-21 Sold (Public Records) $85,000 Public Records
- 1987-06-24 Sold (Public Records) $57,000 Public Records
Property tax history
+3.7%/yrLatest (2025): $1,581 · +11.9% YoY. Source: county tax records.
Cash-flow waterfall
monthlySold comps — $/sqft
last 12 mo · ≤1 miLoading sold comps…