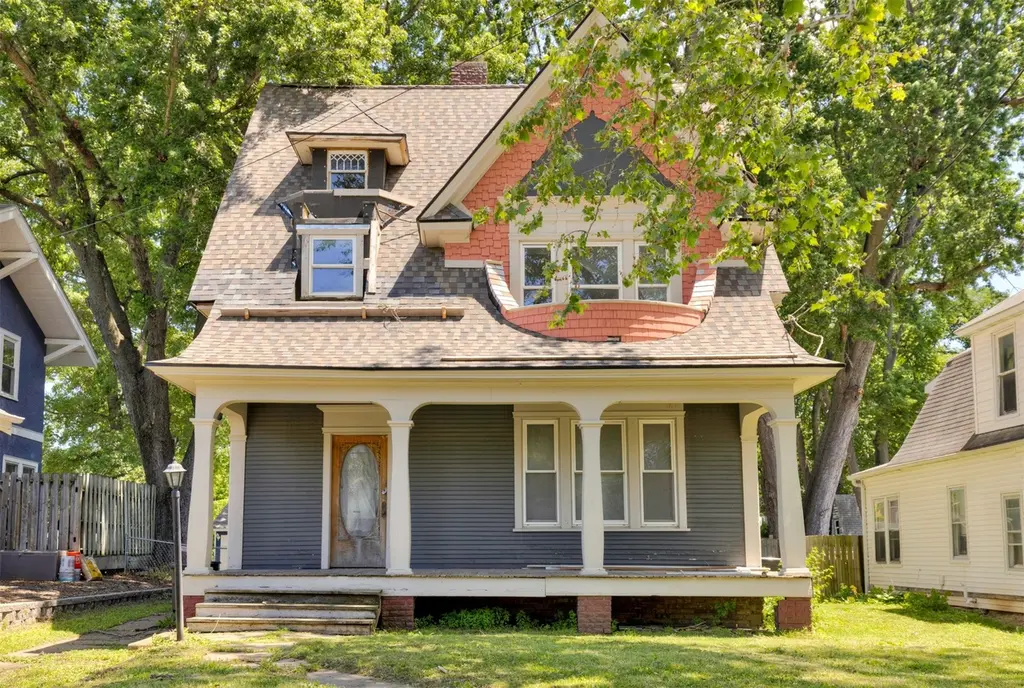
1367 E 9th St · Des Moines, IA
Flood risk 1/10 · Minimal
- FEMA flood zone
- X (unshaded)
- Chance of flooding over 30 yrs
- 0.0%
- Est. flood insurance / yr
- $473 – $860
Fire risk 1/10 · Minimal
- Est. fire insurance / yr
- $902 – $1,676
Heat risk 3/10 · Minor
- Hot days now (above 103°F)
- 7 days/yr
- Hot days in 30 yrs
- 15 days/yr
Wind risk 2/10 · Minimal
- Chance of severe wind over 30 yrs
- —
Air-quality risk 2/10 · Minimal
- Unhealthy air days now
- 1 days/yr
- Unhealthy air days in 30 yrs
- 2 days/yr
Risk factors via First Street. Map © Google.
Why this score? — see what drove the B grade
The composite is a weighted blend of 9 inputs, each scored 0–100. Each bar is that input's sub-score; the figure is the points it added to the 100-point composite (weight × sub-score).
- Cash flow +27.2/30.0
- ARV discount +15.0/15.0
- DSCR +9.4/10.0
- 1% rule +7.7/10.0
- Livability +4.0/5.0
- Schools +3.8/10.0
- Rent growth +2.5/5.0
- Condition / age +2.5/5.0
- Appreciation +0.0/10.0
$135,000
🖨 Deal sheet 📄 Offer letter ✓ Due diligence
Listing remarks
Victorian-era character in Union Park, priced for the buyer who wants to finish it their way. This 2,179 sq ft, 4 bed, 2 bath two-plus story has work underway and real size to work with. Main floor includes large kitchen, living room, entry way, a bedroom and a 3/4 bath with tile shower. Upstairs, the primary suite has a large en suite bath with tile shower, plus two additional guest rooms sharing a second full bath with a nice tile surround around tub area. Flooring partially replaced, tile work started in all baths. Hardwood floors need finishing. The attic is unfinished. Unfinished basement. Two-car detached garage. Priced at $135,000 with condition in mind. Cash or conventional financin
Key facts
- 9,700 sq ft lot
- 2 garage spots
- Built 1900
Property features AI
Exterior
- Parking: Attached two-car garage
- Utilities: Public water; Public sewer
- Home design: Two-story home; Vinyl siding exterior; Brick/mortar foundation; Asphalt shingle roof
- Construction: Built with vinyl siding; Brick/mortar foundation; Asphalt shingle roof
- Exterior features: Concrete road frontage; Lot dimensions approximately 50 x 194
Interior
- Bedrooms: One main-level bedroom
- Flooring: Hardwood floors; Tile floors
- Bathrooms: Two full bathrooms; One three-quarter bathroom
- Heating & cooling: Central air conditioning; Forced air heating (natural gas)
- Interior features: Two fireplaces; Unfinished basement
Neighborhood map
What this means for you Summary
Snapshot
- This is a 4-bed/2.0-bath single-family listed at $135k.
Deal economics
- At list price, monthly cash flow is $385 ($5k/yr) — positive.
- The deal already cash-flows at list — no discount required.
- Meets the 1% rule at list price ($2k rent vs $135k).
- Cap rate 9.7% vs local median 3.1% in Des Moines — top-decile yield for the area; either an underpriced asset or a hidden risk that comps aren't pricing in. Stress-test before assuming the spread holds.
Location & tenants
- Location reads 81/100 on livability (#63 in IA, #1,432 nationally) — a professional / high-income tenant draw. Strengths: commute A+, cost of living A+, housing A+; Watch: employment C-, schools D+, crime F.
- Des Moines Independent Community School District (urban): math 43% / reading 46% proficiency, ranked #289 of 289 in IA (top 100%) — families likely to look elsewhere, expect single-tenant / working-renter base with shorter leases; 63% free/reduced lunch — lower-income household profile, screen leases tightly.
- Market conditions: 105 active listings in the ZIP; 4 comparable units currently listed for rent nearby; rentals at typical pace (median 24d on market — plan ~3-4 weeks tenant-placement turnaround); 2,953 units permitted in Polk County in 2024 (540 in 5+ unit buildings).
Forward outlook
- Local home prices are declining (-3.0%/yr); year-one equity from $933 of loan paydown is wiped out by about $4k of value loss. Plan a longer hold.
- Polk County population projected at +37% by 2050 — long-run rental-demand tailwind backs the buy-and-hold thesis.
- At projected returns (-3.0% appreciation + 3.0% rent growth), your $38k cash investment doubles in ~10 years — after that, you're playing with house money.
Negotiation context
- Only 8 days on market — expect competitive offers; lowballing is unlikely to land.
Risks & watch-outs
- Watch-outs: built in 1900 — expect roof / HVAC / electrical / plumbing capex.
Questions for the listing agent
- Built in 1900 — when were the roof, HVAC, electrical panel, plumbing, and water heater last replaced?
- Is there a deadline driving the sale (1031 exchange, divorce, estate, relocation)? That informs how much negotiation room exists.
- Schools are D-rated, which usually means shorter tenancies and higher turnover. Who's the typical renter profile here, and what's been the actual vacancy rate?
- Crime grade is F in this area — have there been break-ins, vandalism, or insurance claims at this property in the last 3 years? What carrier currently insures it and at what premium?
- What's the average days-on-market for RENTAL listings here right now (not sales)? A rising rental-DOM trend means longer vacancies and softer asking-rent achievability than the comps imply.
- What's the recent tenant-quality profile in this submarket — average credit score on applications, eviction rate, late-payment / NSF rate, and stable-employment percentage? A property-management company in the area should have these aggregated.
- How much new for-sale + rental construction is in the pipeline within 1–3 miles? Heavy new supply typically softens prices + rents 12–24 months out; constrained supply supports both.
Investment metrics
- 1% rule
- 1.27% ✓
- Cap rate
- 9.71%
- Cash-on-cash
- 12.22%
- DSCR
- 1.54
- GRM
- 6.5
CMA / ARV
- ARV (on-the-fly)
- $239,690
- Comps found
- 7
Show comp detail 7 sales within ~0.75 mi
| Address | Dist | Beds/Ba | Sqft | Sold | Price | $/sf | Match |
|---|---|---|---|---|---|---|---|
| 738 E Washington Ave | 0.24mi | 4/2.0 | 2,142 (-2%) | 10mo | $324,900 | $152 | 77 |
| 1336 E 13th St | 0.15mi | 3/2.0 (-1) | 2,088 (-4%) | 18mo | $195,000 | $93 | 66 |
| 911 E 12th St | 0.53mi | 4/1.5 | 1,899 (-13%) | 13mo | $205,000 | $108 | 41 |
| 1010 Pennsylvania Ave | 0.50mi | 3/2.5 (-1) | 1,969 (-10%) | 16mo | $217,000 | $110 | 41 |
| 2122 E 12th St | 0.65mi | 5/2.0 (+1) | 1,986 (-9%) | 11mo | $182,500 | $92 | 40 |
| 1646 E 14th St | 0.43mi | 5/2.0 (+1) | 1,860 (-15%) | 22mo | $248,000 | $133 | 33 |
| 1918 E 13th St | 0.53mi | 4/1.0 | 1,895 (-13%) | 21mo | $211,209 | $111 | 32 |
Match score weights: distance 35% · size 25% · config 20% · recency 20%. Top-matched comps best support the ARV.
Projected returns pro-forma
-3.0% appreciation · 3.0% rent growth · sell at horizon
- IRR
- 1.9%
- Equity multiple
- 1.07×
- Total profit
- $2,690
- Equity at exit
- $20,129
- IRR
- 11.5%
- Equity multiple
- 1.90×
- Total profit
- $34,115
- Equity at exit
- $11,672
Cash invested: $37,800 (down + closing). Projections, not guarantees.
Landlord ↔ Tenant lean methodology
- Overall (STATE)
- 83 Strongly Landlord-Friendly
- State Iowa
- 83 Strongly Landlord-Friendly · R+6
- County
- — inherits STATE
- City
- — inherits STATE
ZIP-level market 50316
- Home prices YoY
- -29.5%
- Active inventory
- 105
- Price-to-rent
- 6.5×
Monthly cashflow live
- Estimated rent
- $1,718 medium interval (Pro) →
- Mortgage (P&I)
- −$708
- Tax from tax record
- −$208 /mo · $2,500/yr
- Insurance
- −$56
- HOA
- −$0
- Vacancy / Maint / Mgmt
- −$361
- Net cashflow
- $385
Break-even live
UW: 25.0% down · 7.5% · 30yr · 1.5% tax · 5.0% vac · 8.0% maint · 8.0% mgmt
Financing live
Cash to close
- Down payment
- $33,750
- Closing costs
- $4,050
- Reserves months
- —
- Total cash needed
- —
Loan-product check · same deal, 3 products live
Conventional
25% down · 7.5% · 30yr
- Down + closing
- —
- Monthly P&I
- —
- Monthly cashflow
- —
- DSCR
- —
- Eligible?
- —
Personal DTI + credit; lowest rate.
DSCR
20% down · 8.5% · 30yr
- Down + closing
- —
- Monthly P&I
- —
- Monthly cashflow
- —
- DSCR
- —
- Eligible?
- —
No personal income docs; deal must DSCR.
Hard money
10% down · 12.0% · 12mo
- Down + closing
- —
- Monthly P&I
- —
- Monthly cashflow
- —
- DSCR
- —
- Eligible?
- —
Short-term bridge; refi at stabilization.
Rent comps 4 comps
| Address | Beds | Baths | Sqft | Rent | $/sqft | DOM | Units | Dist |
|---|---|---|---|---|---|---|---|---|
| 915 E Washington Ave Des Moines, IA | 3.0 | 1.0 | 1457 | $1,450 | $1.00 | 23d | 1 | 0.18mi |
| 1530 E 14th St Des Moines, IA | 3.0 | 2.0 | 1428 | $1,900 | $1.33 | 14d | 1 | 0.31mi |
| 220 Maple St Des Moines, IA | 1.0–3.0 | 1.0–3.0 | 1158 | $2,673 | $2.31 | 14d | 9 | 0.87mi |
| 1513 Dean Ave Des Moines, IA | 4.0 | 1.0 | 1472 | $1,795 | $1.22 | 43d | 1 | 1.15mi |
Listing history 8 events
-
2026-06-10status $135,000 Pending 8 DOM
-
2026-06-09days on market $135,000 Active 8 DOM
-
2026-06-08days on market $135,000 Active 7 DOM
-
2026-06-07days on market $135,000 Active 6 DOM
-
2026-06-05days on market $135,000 Active 3 DOM
-
2026-06-03days on market $135,000 Active 2 DOM
-
2026-06-02remarks 699-char remark
-
2026-06-02$135,000 Active 1 DOM
ⓘ Source: listings_history table (triggers on properties + properties_extension) + one-shot
backfill from property_details.listing_events for pre-trigger history.
Tax reassessment forecast IA · Partial reset (capped growth)
- Current annual tax
- $2,500 · $208/mo
- Projected year-2 tax
- $2,500 · $208/mo
- Expected delta
- $0/yr ($0/mo · 0.0%)
ⓘ Screening estimate from a state-policy table — verify with the county assessor before closing.
Climate risk First Street
- Flood 1/10 Low FEMA zone X (unshaded) · 0% chance over 30 yrs
- Wildfire 1/10 Low
- Heat 3/10 Moderate 7 d/yr ≥103°F today · 15 d/yr by 30 yrs out
- Wind 2/10 Low
- Air quality 2/10 Low 1 unhealthy d/yr today · 2 by 30 yrs out
Nearby sold comps map
Loading sold comps map…
Walkable amenities ~0.75 mi
Loading nearby amenities…
Taxation est. · year 1
- Rental income
- $20,620
- − Mortgage interest
- −$7,562
- − Property taxes
- −$2,500
- − Insurance
- −$675
- − Repairs & maintenance
- −$1,650
- − Management
- −$1,650
- − Depreciation
- −$3,927
- Taxable income
- $2,656
- Est. tax owed @ 24.0%
- −$637
- After-tax cash flow
- $3,982/yr
For passive investors: Depreciation is non-cash, so a rental often shows a tax loss while cash-flowing — sheltering income. Rental losses are passive: they offset passive income freely, and up to $25,000/yr can offset ordinary (W-2) income if you actively participate and your MAGI is under $100k (phasing out to $0 by $150k); unused losses carry forward. On sale, claimed depreciation is recaptured at up to 25%, and gains may owe capital-gains tax (a 1031 exchange can defer both). Figures are a year-1 estimate at your 24.0% rate — not tax advice; consult a CPA.
Schools (NCES district)
- District
- Des Moines Independent Community School District
- NCES district ID
- 1908970
- Math proficiency
- 43% ▼ -6.00%
- Reading proficiency
- 46% ▼ -1.00%
- Median HH income
- $45,905
- Composite
- 37.83/100
- National rank
- #4331
- State rank
- #289 of 289 in IA
Livability — Des Moines
- Score
- 81/100
- State rank
- #63
- US rank
- #1432
Category grades
Schools grade is shown separately in the Schools card above.
Census & demographics
- Census place
- Des Moines, IA
- City population
- 203,612
- Population (ZIP)
- 16,188
Population outlook (Polk County) Hauer SSP2
- Today (2025)
- 548,042 people
- By 2030
- 588,557 · +7.4%
- By 2040
- 670,629 · +22.4%
- By 2050
- 752,830 · +37.4%
- By 2075
- 955,069 · +74.3%
- By 2100
- 1,115,436 · +103.5%
Race, ethnicity, and origin ACS 2023
- Neighborhood character
- Diverse neighborhood (Simpson 0.68)
- Race & ethnicity
- White 48% Hispanic / Latino 27% Black 12% Two or more races 12% Asian 7% Native American 1%
- Hispanic origin (detail)
- Mexican 21% Puerto Rican 1%
- Common ancestry
- Portuguese 2% Slovak 1% Iranian 1%
- Foreign-born
- 16% · Canada, Vietnam, Philippines
- Languages at home
- 69% English-only · Spanish 20% Other Asian/Pacific 3% Vietnamese 2%
Political lean MEDSL · Polk
- 2024 margin
- D (+10.9) · D 54.8% · R 43.9% · Other 1.3%
- 2008→2024 swing
- -3.7pp toward R · 2008: 14.6pp · 2024: 10.9pp
- All cycles
- 2024: D+10.9 2020: D+15.2 2016: D+11.5 2012: D+14.2 2008: D+14.6
Not yet ingested
- Civics
- —
Market trends
- HPI YoY
- ▼ -121.34%
- Current HPI
- 290.3838
- Rent YoY
- —
- Metro
- —
- State GDP YoY
- ▲ 2.48%
- F500 in state
- 4
Industry mix (Fortune 500 HQ in IA)
| Industry | F500 HQs | Revenue |
|---|---|---|
| Financial Services | 1 | $16B |
|
||
| Retail / Convenience | 1 | $15B |
|
||
Price history
1 event — show timeline
- 2026-06-01 Listed $135,000 DMMLS
Property tax history
+1.3%/yrLatest (2025): $2,500 · +182.8% YoY. Source: county tax records.
Cash-flow waterfall
monthlySold comps — $/sqft
last 12 mo · ≤1 miLoading sold comps…