18707 County Road 5736 · Castroville, TX
Flood risk 1/10 · Minimal
- FEMA flood zone
- X (unshaded)
- Chance of flooding over 30 yrs
- 0.0%
- Est. flood insurance / yr
- $507 – $1,088
Fire risk 5/10 · Moderate
- Est. fire insurance / yr
- $1,222 – $2,270
Heat risk 8/10 · Major
- Hot days now (above 109°F)
- 7 days/yr
- Hot days in 30 yrs
- 22 days/yr
Wind risk 6/10 · Moderate
- Chance of severe wind over 30 yrs
- 76.0%
Air-quality risk 1/10 · Minimal
- Unhealthy air days now
- 0 days/yr
- Unhealthy air days in 30 yrs
- 0 days/yr
Risk factors via First Street. Map © Google.
Why this score? — see what drove the C- grade
The composite is a weighted blend of 9 inputs, each scored 0–100. Each bar is that input's sub-score; the figure is the points it added to the 100-point composite (weight × sub-score).
- Cash flow +15.5/30.0
- ARV discount +15.0/15.0
- DSCR +4.8/10.0
- 1% rule +4.4/10.0
- Schools +4.4/10.0
- Livability +3.7/5.0
- Rent growth +2.5/5.0
- Condition / age +2.5/5.0
- Appreciation +0.0/10.0
$175,000
🖨 Deal sheet 📄 Offer letter ✓ Due diligence
Listing remarks MLS
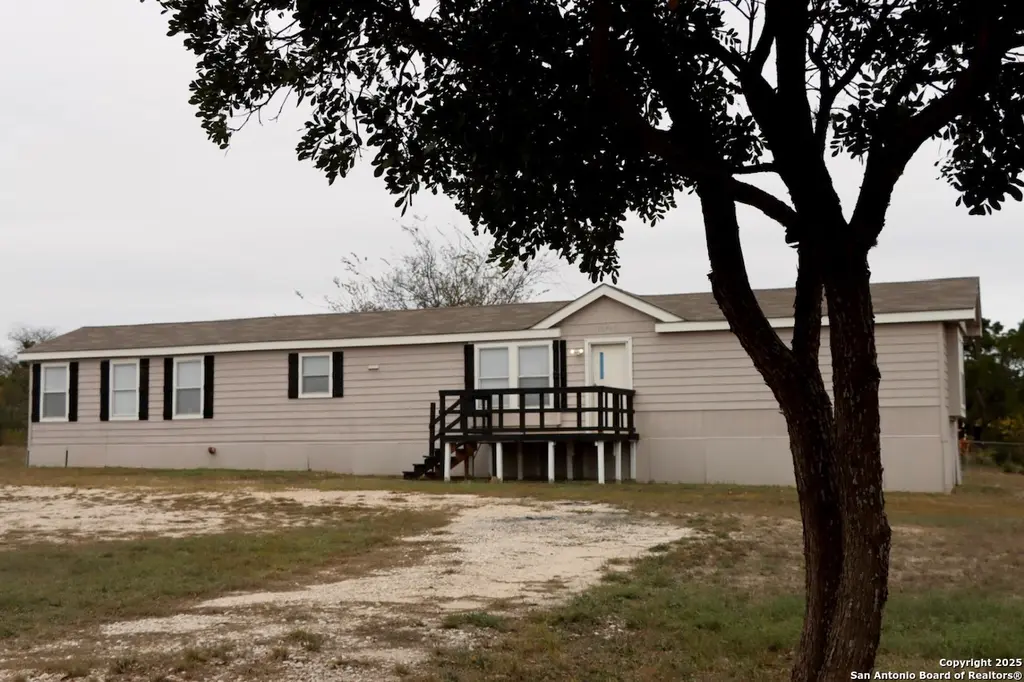
This is a 3 bedroom, 2-bath Palm Harbor manufactured home that has been recently updated. TDHCA records show that the home has only been moved once since 2008. The interior walls have been freshly painted. New blinds have been installed throughout the home. Carpets have been cleaned and the flooring in the kitchen and baths have been replaced. The primary bath was completely updated with the installation of a separate tub, shower and dual vanities including fixtures. The home offers an open, split floor plan with spacious rooms and closets. The washer and dryer will remain with the home. Mature trees, including Mountain Laurels can be found on this .70-acre level lot with space available for entertaining and gardening.
Key facts
- Separate tub
- Recently updated
- Dual vanities
Tags
Neighborhood map
What this means for you Summary
Snapshot
- This is a 3-bed/2.0-bath manufactured listed at $175k.
Deal economics
- At list price, monthly cash flow is $70 ($843/yr) — positive.
- The deal already cash-flows at list — no discount required.
- To meet the 1% rule (rent ≥ 1% of price), the offer needs to be $165k (5.6% below list).
- Recommended offer: $154k (12.0% below list) — sets the bar for market timing.
- Cap rate 6.8% vs local median 2.7% in Castroville — top-decile yield for the area; either an underpriced asset or a hidden risk that comps aren't pricing in. Stress-test before assuming the spread holds.
Location & tenants
- Location reads 73/100 on livability (#212 in TX) — a middle-class / working-renter tenant base. Strengths: cost of living A+, housing A+, crime B; Watch: health & safety D+, amenities F, commute F.
- Medina Valley ISD (rural): math 48% / reading 53% proficiency, ranked #148 of 826 in TX (top 18%) — acceptable for families but not a draw, mixed tenant base, ~2y average lease.
- Market conditions: 441 active listings in the ZIP; 102 units permitted in Medina County in 2024 (0 in 5+ unit buildings).
Forward outlook
- Local home prices are declining (-3.0%/yr); year-one equity from $1k of loan paydown is wiped out by about $5k of value loss. Plan a longer hold.
- Medina County population projected at +24% by 2050 — long-run rental-demand tailwind backs the buy-and-hold thesis.
Negotiation context
- It's been on market 189 days — a 12% lower offer ($154k) is reasonable based on typical stale-listing flexibility.
- 5 sale attempts since 8y ago; this cycle's ask has dropped $20k (10%) from the opening price — seller is motivated, your offer sets the floor, not the list.
Risks & watch-outs
- Climate carrying-cost: major wind risk, 76% chance of damaging wind over 30y; moderate wildfire risk; extreme-heat days projected 7→22/yr by 2055 (HVAC capex compounding) — expect insurance premiums to compound above CPI over the hold.
Questions for the listing agent
- It's been on market 189 days. Have you received any prior offers? Is the seller open to a 12% concession, seller financing, or rate buy-down credit?
- What does the HOA fee cover, when was the last increase, and are there any pending special assessments or reserve-fund shortfalls?
- Why hasn't it sold? Are there any deal-killer items the seller is aware of (foundation, flood, title, zoning, code violations)?
- Is there a deadline driving the sale (1031 exchange, divorce, estate, relocation)? That informs how much negotiation room exists.
- What's the average days-on-market for RENTAL listings here right now (not sales)? A rising rental-DOM trend means longer vacancies and softer asking-rent achievability than the comps imply.
- What's the recent tenant-quality profile in this submarket — average credit score on applications, eviction rate, late-payment / NSF rate, and stable-employment percentage? A property-management company in the area should have these aggregated.
- How much new for-sale + rental construction is in the pipeline within 1–3 miles? Heavy new supply typically softens prices + rents 12–24 months out; constrained supply supports both.
Investment metrics
- 1% rule
- 0.94% ✗
- Cap rate
- 6.77%
- Cash-on-cash
- 1.72%
- DSCR
- 1.08
- GRM
- 8.8
CMA / ARV
- ARV (median comp)
- $228,600
- List price
- $175,000
- Delta
- -23.45%
- Verdict
- UNDERPRICED
- Comps
- 15 within 1.0 mi
Show comp detail 1 sale within ~0.75 mi
| Address | Dist | Beds/Ba | Sqft | Sold | Price | $/sf | Match |
|---|---|---|---|---|---|---|---|
| 226 County Road 575 | 0.51mi | 3/2.0 | 1,216 (-5%) | 3mo | $125,000 | $103 | 65 |
Match score weights: distance 35% · size 25% · config 20% · recency 20%. Top-matched comps best support the ARV.
Projected returns pro-forma
-3.0% appreciation · 3.0% rent growth · sell at horizon
- IRR
- -13.5%
- Equity multiple
- 0.51×
- Total profit
- $-23,843
- Equity at exit
- $26,093
- IRR
- -4.6%
- Equity multiple
- 0.70×
- Total profit
- $-14,836
- Equity at exit
- $15,131
Cash invested: $49,000 (down + closing). Projections, not guarantees.
Landlord ↔ Tenant lean methodology
- Overall (STATE)
- 87 Strongly Landlord-Friendly
- State Texas
- 87 Strongly Landlord-Friendly · R+5
- County
- — inherits STATE
- City
- — inherits STATE
ZIP-level market 78009
- Home prices YoY
- -21.1%
- Active inventory
- 441
- Price-to-rent
- 8.8×
Monthly cashflow live
- Estimated rent
- $1,652 medium interval (Pro) →
- Mortgage (P&I)
- −$918
- Tax from tax record
- −$231 /mo · $2,772/yr
- Insurance
- −$73
- HOA
- −$13
- Vacancy / Maint / Mgmt
- −$347
- Net cashflow
- $70
Break-even live
UW: 25.0% down · 7.5% · 30yr · 1.5% tax · 5.0% vac · 8.0% maint · 8.0% mgmt
Financing live
Cash to close
- Down payment
- $43,750
- Closing costs
- $5,250
- Reserves months
- —
- Total cash needed
- —
Loan-product check · same deal, 3 products live
Conventional
25% down · 7.5% · 30yr
- Down + closing
- —
- Monthly P&I
- —
- Monthly cashflow
- —
- DSCR
- —
- Eligible?
- —
Personal DTI + credit; lowest rate.
DSCR
20% down · 8.5% · 30yr
- Down + closing
- —
- Monthly P&I
- —
- Monthly cashflow
- —
- DSCR
- —
- Eligible?
- —
No personal income docs; deal must DSCR.
Hard money
10% down · 12.0% · 12mo
- Down + closing
- —
- Monthly P&I
- —
- Monthly cashflow
- —
- DSCR
- —
- Eligible?
- —
Short-term bridge; refi at stabilization.
HOA detail
- Monthly dues
- $13 · $156/yr
Listing history 32 events
-
2026-06-18days on market $175,000 Active 189 DOM
-
2026-06-17days on market $175,000 Active 188 DOM
-
2026-06-16days on market $175,000 Active 187 DOM
-
2026-06-15days on market $175,000 Active 186 DOM
-
2026-06-13days on market $175,000 Active 184 DOM
-
2026-06-09days on market $175,000 Active 180 DOM
-
2026-06-08days on market $175,000 Active 179 DOM
-
2026-06-07days on market $175,000 Active 178 DOM
-
2026-06-04days on market $175,000 Active 175 DOM
-
2026-06-03days on market $175,000 Active 174 DOM
-
2026-06-02days on market $175,000 Active 173 DOM
-
2026-06-02statusdays on market $175,000 Active 172 DOM
-
2026-05-31days on market $175,000 Price Change 171 DOM
-
2026-04-16price $185,000 729-char remark
Show marketing remark (729 chars)
This is a 3 bedroom, 2-bath Palm Harbor manufactured home that has been recently updated. TDHCA records show that the home has only been moved once since 2008. The interior walls have been freshly painted. New blinds have been installed throughout the home. Carpets have been cleaned and the flooring in the kitchen and baths have been replaced. The primary bath was completely updated with the installation of a separate tub, shower and dual vanities including fixtures. The home offers an open, split floor plan with spacious rooms and closets. The washer and dryer will remain with the home. Mature trees, including Mountain Laurels can be found on this .70-acre level lot with space available for entertaining and gardening.
-
2025-12-11$195,000 New 729-char remark
Show marketing remark (729 chars)
This is a 3 bedroom, 2-bath Palm Harbor manufactured home that has been recently updated. TDHCA records show that the home has only been moved once since 2008. The interior walls have been freshly painted. New blinds have been installed throughout the home. Carpets have been cleaned and the flooring in the kitchen and baths have been replaced. The primary bath was completely updated with the installation of a separate tub, shower and dual vanities including fixtures. The home offers an open, split floor plan with spacious rooms and closets. The washer and dryer will remain with the home. Mature trees, including Mountain Laurels can be found on this .70-acre level lot with space available for entertaining and gardening.
-
2025-12-10historical
-
2025-09-06price $168,500
-
2025-08-09$170,000 New
-
2021-12-03soldstatus
-
2021-12-02soldstatus Sold
-
2021-11-10status Pending
-
2021-11-01historical Active Option
-
2021-10-26status Back on Market
-
2021-10-21historical Active Option
-
2021-10-15$129,500 New
-
2021-07-23soldstatus
-
2018-09-12soldstatus
-
2018-09-11soldstatus Sold
-
2018-07-18status Pending
-
2018-07-11historical Active Option
-
2018-06-28$95,000 New
-
2008-06-02soldstatus
ⓘ Source: listings_history table (triggers on properties + properties_extension) + one-shot
backfill from property_details.listing_events for pre-trigger history.
Tax reassessment forecast TX · Resets to sale price
- Current annual tax
- $2,772 · $231/mo
- Projected year-2 tax
- $3,202 · $267/mo
- Expected delta
- +$431/yr (+$36/mo · 15.5%)
ⓘ Screening estimate from a state-policy table — verify with the county assessor before closing.
Climate risk First Street
- Flood 1/10 Low FEMA zone X (unshaded) · 0% chance over 30 yrs
- Wildfire 5/10 Major
- Heat 8/10 Severe 7 d/yr ≥109°F today · 22 d/yr by 30 yrs out
- Wind 6/10 Major 76% chance of damaging wind over 30 yrs
- Air quality 1/10 Low 0 unhealthy d/yr today · 0 by 30 yrs out
Nearby sold comps map
Loading sold comps map…
Walkable amenities ~0.75 mi
Loading nearby amenities…
Taxation est. · year 1
- Rental income
- $19,821
- − Mortgage interest
- −$9,803
- − Property taxes
- −$2,772
- − Insurance
- −$875
- − Repairs & maintenance
- −$1,586
- − Management
- −$1,586
- − HOA
- −$156
- − Depreciation
- −$5,091
- Taxable loss
- −$2,047
- Est. tax savings @ 24.0%
- +$491
- After-tax cash flow
- $1,334/yr
For passive investors: Depreciation is non-cash, so a rental often shows a tax loss while cash-flowing — sheltering income. Rental losses are passive: they offset passive income freely, and up to $25,000/yr can offset ordinary (W-2) income if you actively participate and your MAGI is under $100k (phasing out to $0 by $150k); unused losses carry forward. On sale, claimed depreciation is recaptured at up to 25%, and gains may owe capital-gains tax (a 1031 exchange can defer both). Figures are a year-1 estimate at your 24.0% rate — not tax advice; consult a CPA.
Schools (NCES district)
- District
- Medina Valley ISD
- NCES district ID
- 4830060
- Math proficiency
- 48% ▼ -9.00%
- Reading proficiency
- 53% ▼ -2.00%
- Median HH income
- $60,596
- Composite
- 44.2/100
- National rank
- #2851
- State rank
- #148 of 826 in TX
Livability — Castroville
- Score
- 73/100
- State rank
- #212
- US rank
- #5267
Category grades
Schools grade is shown separately in the Schools card above.
Census & demographics
- Population (ZIP)
- 9,494
Population outlook (Medina County) Hauer SSP2
- Today (2025)
- 54,332 people
- By 2030
- 57,250 · +5.4%
- By 2040
- 62,563 · +15.1%
- By 2050
- 67,386 · +24.0%
- By 2075
- 79,538 · +46.4%
- By 2100
- 84,624 · +55.8%
Race, ethnicity, and origin ACS 2023
- Neighborhood character
- Diverse neighborhood (Simpson 0.60)
- Race & ethnicity
- Hispanic / Latino 52% White 37% Two or more races 29% Black 4% Asian 3% Native American 1%
- Hispanic origin (detail)
- Mexican 41% Puerto Rican 3%
- Common ancestry
- Albanian 6% Lithuanian 5% Slovak 2%
- Foreign-born
- 9% · Canada
- Languages at home
- 74% English-only · Spanish 24% Other Indo-European 1%
Political lean MEDSL · Medina
- 2024 margin
- Solid R (+42.8) · D 28.2% · R 71.0%
- 2008→2024 swing
- -8.9pp toward R · 2008: -33.9pp · 2024: -42.8pp
- All cycles
- 2024: R+42.8 2020: R+39.2 2016: R+43.2 2012: R+39.2 2008: R+33.9
Not yet ingested
- Civics
- —
Market trends
- HPI YoY
- ▼ -56.81%
- Current HPI
- 212.1813
- Rent YoY
- —
- Metro
- —
- State GDP YoY
- ▲ 3.95%
- F500 in state
- 110
Industry mix (Fortune 500 HQ in TX)
| Industry | F500 HQs | Revenue |
|---|---|---|
| Energy | 16 | $1,198B |
|
||
| Technology | 5 | $198B |
|
||
| Engineering / Construction | 4 | $72B |
|
||
| Energy Services | 3 | $60B |
|
||
| Utilities | 3 | $41B |
|
||
| Healthcare | 2 | $330B |
|
||
Price history
+94.7% since first listed19 events — show timeline
- 2026-04-16 Price Changed $185,000 LERA
- 2025-12-11 Listed $195,000 LERA
- 2025-12-10 Listing Removed — LERA
- 2025-09-06 Price Changed $168,500 LERA
- 2025-08-09 Listed $170,000 LERA
- 2021-12-03 Sold (Public Records) — Public Records
- 2021-12-02 Sold (MLS) — LERA
- 2021-11-10 Pending — LERA
- 2021-11-01 Contingent — LERA
- 2021-10-26 Relisted — LERA
- 2021-10-21 Contingent — LERA
- 2021-10-15 Listed $129,500 LERA
- 2021-07-23 Sold (Public Records) — Public Records
- 2018-09-12 Sold (Public Records) — Public Records
- 2018-09-11 Sold (MLS) — LERA
- 2018-07-18 Pending — LERA
- 2018-07-11 Contingent — LERA
- 2018-06-28 Listed $95,000 LERA
- 2008-06-02 Sold (Public Records) — Public Records
Property tax history
+6.1%/yrLatest (2025): $2,772 · -1.2% YoY. Source: county tax records.
Cash-flow waterfall
monthlySold comps — $/sqft
last 12 mo · ≤1 miLoading sold comps…