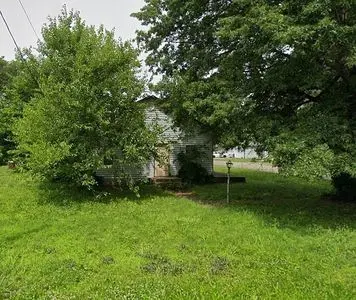
2305 Cleveland Ave · Baxter Springs, KS
Flood risk 1/10 · Minimal
- FEMA flood zone
- X (unshaded)
- Chance of flooding over 30 yrs
- 0.0%
- Est. flood insurance / yr
- $507 – $1,088
Fire risk 6/10 · Moderate
- Est. fire insurance / yr
- $1,154 – $2,142
Heat risk 5/10 · Moderate
- Hot days now (above 108°F)
- 7 days/yr
- Hot days in 30 yrs
- 20 days/yr
Wind risk 2/10 · Minimal
- Chance of severe wind over 30 yrs
- 2.0%
Air-quality risk 2/10 · Minimal
- Unhealthy air days now
- 1 days/yr
- Unhealthy air days in 30 yrs
- 1 days/yr
Risk factors via First Street. Map © Google.
Why this score? — see what drove the D grade
The composite is a weighted blend of 9 inputs, each scored 0–100. Each bar is that input's sub-score; the figure is the points it added to the 100-point composite (weight × sub-score).
- Cash flow +15.0/30.0
- ARV discount +7.5/15.0
- 1% rule +5.0/10.0
- DSCR +5.0/10.0
- Livability +3.8/5.0
- Schools +2.9/10.0
- Rent growth +2.5/5.0
- Condition / age +2.5/5.0
- Appreciation +0.0/10.0
$19,900
🖨 Deal sheet 📄 Offer letter ✓ Due diligence
Listing remarks MLS
Calling all Investors! Large home on corner lot in need of repair. Loaded with so much potential. Newer vinyl windows and had some other updates. It recently was a family home with a one bedroom apartment in front. Due to property needing a clean out, room measurements are not provided at this time.
Key facts
- Built 2001
- Listed 12 days
Property features AI
Exterior
- Home design: Single-family house
- Exterior features: Lot of approximately 21,344 sq ft
Neighborhood map
What this means for you Summary
Snapshot
- This is a 4-bed/3.0-bath single-family listed at $20k.
Deal economics
- At list price, monthly cash flow is $953 ($11k/yr) — positive.
- The deal already cash-flows at list — no discount required.
- Meets the 1% rule at list price ($1k rent vs $20k).
Location & tenants
- Location reads 75/100 on livability (#63 in KS, #3,952 nationally) — a middle-class / working-renter tenant base. Strengths: cost of living A+, housing A+, health & safety A+; Watch: employment D, schools F, amenities F.
- Baxter Springs (town): math 31% / reading 39% proficiency, ranked #64 of 169 in KS (top 38%) — families likely to look elsewhere, expect single-tenant / working-renter base with shorter leases.
- Market conditions: 54 active listings in the ZIP; 17 units permitted in Cherokee County in 2024 (0 in 5+ unit buildings).
Forward outlook
- Local home prices are declining (-3.0%/yr); year-one equity from $138 of loan paydown is wiped out by about $597 of value loss. Plan a longer hold.
- Cherokee County population projected at -26% by 2050 — secular population decline; favor cash flow + early exit over multi-decade hold.
- At projected returns (-3.0% appreciation + 3.0% rent growth), your $6k cash investment doubles in ~1 year — after that, you're playing with house money.
Negotiation context
- Only 13 days on market — expect competitive offers; lowballing is unlikely to land.
- 16 sale attempts since 4y ago; this cycle's ask has dropped $5k (20%) from the opening price — seller is motivated, your offer sets the floor, not the list.
Risks & watch-outs
- Climate carrying-cost: major wildfire risk; extreme-heat days projected 7→20/yr by 2055 (HVAC capex compounding) — expect insurance premiums to compound above CPI over the hold.
Questions for the listing agent
- Is there a deadline driving the sale (1031 exchange, divorce, estate, relocation)? That informs how much negotiation room exists.
- Schools are F-rated, which usually means shorter tenancies and higher turnover. Who's the typical renter profile here, and what's been the actual vacancy rate?
- The area grade is low — what's the realistic commute time and amenity access for the typical tenant pool here? Any planned neighborhood developments (good or bad) we should know about?
- What's the average days-on-market for RENTAL listings here right now (not sales)? A rising rental-DOM trend means longer vacancies and softer asking-rent achievability than the comps imply.
- What's the recent tenant-quality profile in this submarket — average credit score on applications, eviction rate, late-payment / NSF rate, and stable-employment percentage? A property-management company in the area should have these aggregated.
- How much new for-sale + rental construction is in the pipeline within 1–3 miles? Heavy new supply typically softens prices + rents 12–24 months out; constrained supply supports both.
Investment metrics
- 1% rule
- 6.85% ✓
- Cap rate
- 63.77%
- Cash-on-cash
- 205.26%
- DSCR
- 10.13
- GRM
- 1.2
CMA / ARV
No comps found within radius.
Projected returns pro-forma
-3.0% appreciation · 3.0% rent growth · sell at horizon
- IRR
- —
- Equity multiple
- 11.32×
- Total profit
- $57,491
- Equity at exit
- $2,967
- IRR
- —
- Equity multiple
- 24.02×
- Total profit
- $128,276
- Equity at exit
- $1,721
Cash invested: $5,572 (down + closing). Projections, not guarantees.
Landlord ↔ Tenant lean methodology
- Overall (STATE)
- 83 Strongly Landlord-Friendly
- State Kansas
- 83 Strongly Landlord-Friendly · R+10
- County
- — inherits STATE
- City
- — inherits STATE
ZIP-level market 66713
- Home prices YoY
- -17.7%
- Active inventory
- 54
- Price-to-rent
- 1.2×
Monthly cashflow live
- Estimated rent
- $1,362 medium interval (Pro) →
- Mortgage (P&I)
- −$104
- Tax from tax record
- −$10 /mo · $124/yr
- Insurance
- −$8
- HOA
- −$0
- Vacancy / Maint / Mgmt
- −$286
- Net cashflow
- $953
Break-even live
UW: 25.0% down · 7.5% · 30yr · 1.5% tax · 5.0% vac · 8.0% maint · 8.0% mgmt
Financing live
Cash to close
- Down payment
- $4,975
- Closing costs
- $597
- Reserves months
- —
- Total cash needed
- —
Loan-product check · same deal, 3 products live
Conventional
25% down · 7.5% · 30yr
- Down + closing
- —
- Monthly P&I
- —
- Monthly cashflow
- —
- DSCR
- —
- Eligible?
- —
Personal DTI + credit; lowest rate.
DSCR
20% down · 8.5% · 30yr
- Down + closing
- —
- Monthly P&I
- —
- Monthly cashflow
- —
- DSCR
- —
- Eligible?
- —
No personal income docs; deal must DSCR.
Hard money
10% down · 12.0% · 12mo
- Down + closing
- —
- Monthly P&I
- —
- Monthly cashflow
- —
- DSCR
- —
- Eligible?
- —
Short-term bridge; refi at stabilization.
Listing history 47 events
-
2026-06-18days on market $19,900 Active 13 DOM
-
2026-06-17days on market $19,900 Active 12 DOM
-
2026-06-16days on market $19,900 Active 11 DOM
-
2026-06-15days on market $19,900 Active 10 DOM
-
2026-06-13days on market $19,900 Active 8 DOM
-
2026-06-12days on market $19,900 Active 7 DOM
-
2026-06-09days on market $19,900 Active 4 DOM
-
2026-06-08days on market $19,900 Active 3 DOM
-
2026-06-07pricedays on market $19,900 Active 2 DOM
-
2026-06-05days on market $25,000 Active 210 DOM
-
2026-06-04days on market $25,000 Active 208 DOM
-
2026-06-02days on market $25,000 Active 207 DOM
-
2026-06-01days on market $25,000 Active 206 DOM
-
2026-05-31days on market $25,000 Active 205 DOM
-
2026-05-31days on market $25,000 Active 204 DOM
-
2025-11-07$25,000 Active
-
2025-05-18historical $859
-
2025-05-01$859
-
2024-08-28historical $859
-
2024-08-07$859
-
2024-06-20historical $859
-
2024-05-15historical $859
-
2024-04-23$859
-
2024-04-10historical $859
-
2024-03-15$859
-
2024-03-15historical $859
-
2024-03-14$859
-
2024-03-14historical $859
-
2024-02-13$859
-
2024-02-09historical $859
-
2024-01-25$859
-
2024-01-18historical $859
-
2024-01-18$859
-
2024-01-06
-
2023-12-03historical
-
2023-12-03
-
2023-11-07historical
-
2023-11-05
-
2023-10-15historical
-
2023-10-09
-
2023-09-13historical
-
2023-09-11
-
2023-08-23historical
-
2023-07-12
-
2023-02-24soldstatus 300-char remark
Show marketing remark (300 chars)
Calling all Investors! Large home on corner lot in need of repair. Loaded with so much potential. Newer vinyl windows and had some other updates. It recently was a family home with a one bedroom apartment in front. Due to property needing a clean out, room measurements are not provided at this time.
-
2022-09-27$41,000 300-char remark
Show marketing remark (300 chars)
Calling all Investors! Large home on corner lot in need of repair. Loaded with so much potential. Newer vinyl windows and had some other updates. It recently was a family home with a one bedroom apartment in front. Due to property needing a clean out, room measurements are not provided at this time.
-
1994-02-01soldstatus $26,000
ⓘ Source: listings_history table (triggers on properties + properties_extension) + one-shot
backfill from property_details.listing_events for pre-trigger history.
Tax reassessment forecast KS · Resets to sale price
- Current annual tax
- $124 · $10/mo
- Projected year-2 tax
- $281 · $23/mo
- Expected delta
- +$156/yr (+$13/mo · 125.8%)
ⓘ Screening estimate from a state-policy table — verify with the county assessor before closing.
Climate risk First Street
- Flood 1/10 Low FEMA zone X (unshaded) · 0% chance over 30 yrs
- Wildfire 6/10 Major
- Heat 5/10 Major 7 d/yr ≥108°F today · 20 d/yr by 30 yrs out
- Wind 2/10 Low 2% chance of damaging wind over 30 yrs
- Air quality 2/10 Low 1 unhealthy d/yr today · 1 by 30 yrs out
Nearby sold comps map
Loading sold comps map…
Walkable amenities ~0.75 mi
Loading nearby amenities…
Taxation est. · year 1
- Rental income
- $16,346
- − Mortgage interest
- −$1,115
- − Property taxes
- −$124
- − Insurance
- −$100
- − Repairs & maintenance
- −$1,308
- − Management
- −$1,308
- − Depreciation
- −$579
- Taxable income
- $11,813
- Est. tax owed @ 24.0%
- −$2,835
- After-tax cash flow
- $8,602/yr
For passive investors: Depreciation is non-cash, so a rental often shows a tax loss while cash-flowing — sheltering income. Rental losses are passive: they offset passive income freely, and up to $25,000/yr can offset ordinary (W-2) income if you actively participate and your MAGI is under $100k (phasing out to $0 by $150k); unused losses carry forward. On sale, claimed depreciation is recaptured at up to 25%, and gains may owe capital-gains tax (a 1031 exchange can defer both). Figures are a year-1 estimate at your 24.0% rate — not tax advice; consult a CPA.
Schools (NCES district)
- District
- Baxter Springs
- NCES district ID
- 2003810
- Math proficiency
- 31% ▼ -1.00%
- Reading proficiency
- 39% ▲ 2.00%
- Median HH income
- $40,038
- Composite
- 29.37/100
- National rank
- #6529
- State rank
- #64 of 169 in KS
Livability — Baxter Springs
- Score
- 75/100
- State rank
- #63
- US rank
- #3952
Category grades
Schools grade is shown separately in the Schools card above.
Census & demographics
- Census place
- Baxter Springs, KS
- Population (ZIP)
- 5,560
Population outlook (Cherokee County) Hauer SSP2
- Today (2025)
- 18,848 people
- By 2030
- 17,862 · -5.2%
- By 2040
- 15,850 · -15.9%
- By 2050
- 13,915 · -26.2%
- By 2075
- 10,102 · -46.4%
- By 2100
- 6,977 · -63.0%
Race, ethnicity, and origin ACS 2023
- Neighborhood character
- Predominantly White (85%)
- Race & ethnicity
- White 85% Hispanic / Latino 6% Two or more races 4% Native American 3%
- Hispanic origin (detail)
- Mexican 4%
- Common ancestry
- Scotch-Irish 6% Slovak 3% Italian 3%
- Foreign-born
- 2% · Canada
- Languages at home
- 98% English-only · Other Indo-European 1% Spanish 1%
Political lean MEDSL · Cherokee
- 2024 margin
- Solid R (+52.9) · D 22.6% · R 75.5% · Other 1.9%
- 2008→2024 swing
- -29.2pp toward R · 2008: -23.7pp · 2024: -52.9pp
- All cycles
- 2024: R+52.9 2020: R+49.9 2016: R+48.4 2012: R+29.5 2008: R+23.7
Not yet ingested
- Civics
- —
Market trends
- HPI YoY
- ▼ -37.71%
- Current HPI
- 175.5431
- Rent YoY
- —
- Metro
- —
- State GDP YoY
- —
- F500 in state
- 0
Price history
-3.8% since first listed32 events — show timeline
- 2025-11-07 Listed $25,000 ForSaleByOwner.com
- 2025-05-18 Rental Removed $859 Hemlane
- 2025-05-01 Listed for Rent $859 Hemlane
- 2024-08-28 Rental Removed $859 Avail
- 2024-08-07 Listed for Rent $859 Avail
- 2024-06-20 Rental Removed $859 RENT.
- 2024-05-15 Rental Removed $859 Avail
- 2024-04-23 Listed for Rent $859 Avail
- 2024-04-10 Rental Removed $859 APPFOLIO
- 2024-03-15 Listed for Rent $859 APPFOLIO
- 2024-03-15 Rental Removed $859 Avail
- 2024-03-14 Listed for Rent $859 Avail
- 2024-03-14 Rental Removed $859 APPFOLIO
- 2024-02-13 Listed for Rent $859 RENT.
- 2024-02-09 Rental Removed $859 RENT.
- 2024-01-25 Listed for Rent $859 RENT.
- 2024-01-18 Rental Removed $859 Avail
- 2024-01-18 Listed for Rent $859 APPFOLIO
- 2024-01-06 Listed for Rent — Avail
- 2023-12-03 Rental Removed — Avail
- 2023-12-03 Listed for Rent — Avail
- 2023-11-07 Rental Removed — Avail
- 2023-11-05 Listed for Rent — Avail
- 2023-10-15 Rental Removed — Avail
- 2023-10-09 Listed for Rent — Avail
- 2023-09-13 Rental Removed — Avail
- 2023-09-11 Listed for Rent — Avail
- 2023-08-23 Rental Removed — Avail
- 2023-07-12 Listed for Rent — Avail
- 2023-02-24 Sold (MLS) — OGAR
- 2022-09-27 Listed $41,000 OGAR
- 1994-02-01 Sold (Public Records) $26,000 Public Records
Property tax history
-15.9%/yrLatest (2025): $124 · -58.0% YoY. Source: county tax records.
Cash-flow waterfall
monthlySold comps — $/sqft
last 12 mo · ≤1 miLoading sold comps…