17340 Sargent Rd SW #15 · Rochester, WA
Flood risk 5/10 · Moderate
- FEMA flood zone
- X (unshaded)
- Chance of flooding over 30 yrs
- 0.53%
- Est. flood insurance / yr
- $507 – $1,088
Fire risk 4/10 · Minor
- Est. fire insurance / yr
- $604 – $1,122
Heat risk 2/10 · Minimal
- Hot days now (above 89°F)
- 7 days/yr
- Hot days in 30 yrs
- 14 days/yr
Wind risk 1/10 · Minimal
- Chance of severe wind over 30 yrs
- —
Air-quality risk 6/10 · Moderate
- Unhealthy air days now
- 8 days/yr
- Unhealthy air days in 30 yrs
- 8 days/yr
Risk factors via First Street. Map © Google.
Why this score? — see what drove the B grade
The composite is a weighted blend of 9 inputs, each scored 0–100. Each bar is that input's sub-score; the figure is the points it added to the 100-point composite (weight × sub-score).
- Cash flow +30.0/30.0
- 1% rule +10.0/10.0
- DSCR +10.0/10.0
- ARV discount +7.5/15.0
- Schools +4.9/10.0
- Livability +3.3/5.0
- Rent growth +2.5/5.0
- Condition / age +2.5/5.0
- Appreciation +0.0/10.0
$70,000
🖨 Deal sheet 📄 Offer letter ✓ Due diligence
Listing remarks
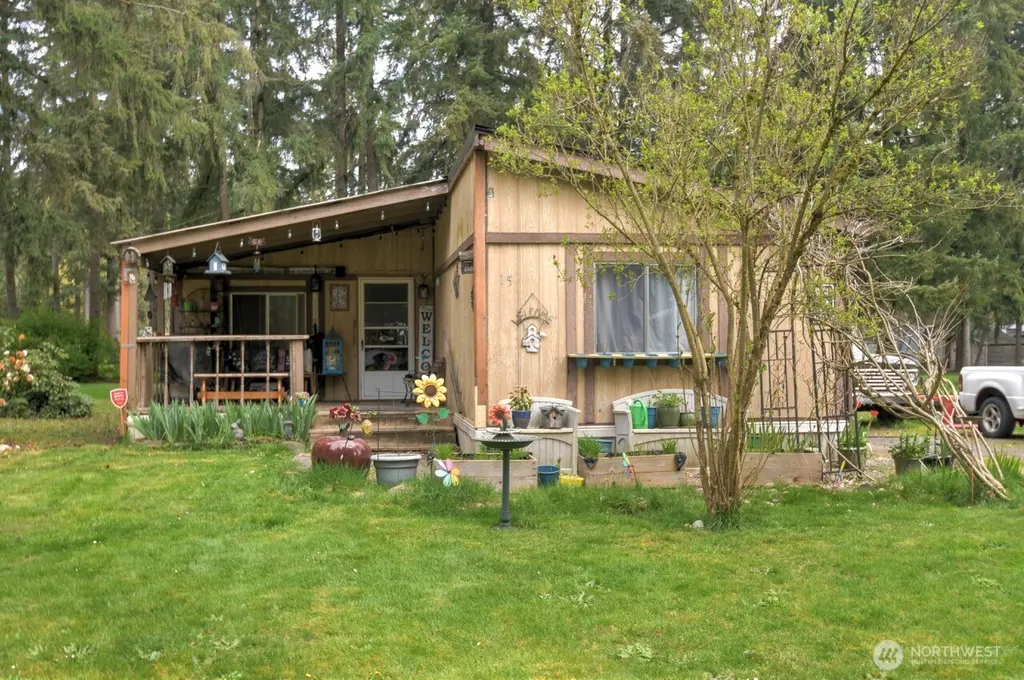
Welcome to Whispering Woods! This 3 bedroom, 1.75 bath home offers comfortable living with its spacious living room, cozy wood-burning stove, and a versatile bonus room to suit your needs, perfect for a home office, hobby space, or guest area. The functional layout provides a welcoming atmosphere with plenty of room to relax and entertain. Enjoy both the expansive covered front and back porches, ideal for a quiet cup of coffee in the morning or unwinding in the evening while taking in the peaceful natural surroundings. Whether you're enjoying the fresh air or hosting small gatherings, these outdoor spaces add to the home’s charm and livability. This property also features a 10x12 stor
Key facts
- Covered front porch
- Heat pump
- Bonus room
Tags
Property features AI
Finance
- Other: Taxes paid annually
- Financial info: Listing terms: Cash, Conventional
- HOA & community: Whispering Woods park (approximately 70 homes); Park approved for sale; Common area in park; Land lease: $698
Exterior
- Parking: Uncovered parking
- Utilities: Community water; Septic sewer; Electric and wood energy sources; Power by PSE; Cable: Comcast; Internet: Comcast
- Home design: Manufactured double-wide home; One story; Has a view; Mobile home remains; Condition: Fair
- Construction: Wood construction; Composition roof; Manufactured house
- Exterior features: Wood exterior; Patio/porch/deck; Paved lot
Interior
- Kitchen: Dishwasher; Stove/Range
- Bedrooms: 3 bedrooms
- Flooring: Laminate; Vinyl; Carpet
- Bathrooms: 1 full bath; 1 three-quarter bath; 1 bathtub; 2 showers
- Heating & cooling: Forced air heating; Ductless heating; Cooling
- Interior features: Fireplace (wood burning); Water heater
- Laundry & utility: Electric water heater
Neighborhood map
What this means for you Summary
Snapshot
- This is a 3-bed/2.0-bath manufactured listed at $70k.
Deal economics
- At list price, monthly cash flow is $1k ($14k/yr) — positive.
- The deal already cash-flows at list — no discount required.
- Meets the 1% rule at list price ($2k rent vs $70k).
- Recommended offer: $66k (6.0% below list) — sets the bar for market timing.
- Cap rate 25.9% vs local median 2.1% in Rochester — top-decile yield for the area; either an underpriced asset or a hidden risk that comps aren't pricing in. Stress-test before assuming the spread holds.
Location & tenants
- Location reads 66/100 on livability (#327 in WA) — a middle-class / working-renter tenant base. Strengths: employment A+, housing A+, crime B; Watch: health & safety C-, amenities F, commute F.
- Rochester School District (rural): math 53% / reading 57% proficiency, ranked #97 of 291 in WA (top 33%) — acceptable for families but not a draw, mixed tenant base, ~2y average lease.
- Zoned schools: Grand Mound Elementary (499 students, 66% FRL); Rochester High School (600 students, 51% FRL).
- Market conditions: 107 active listings in the ZIP; 1,222 units permitted in Thurston County in 2024 (508 in 5+ unit buildings).
Forward outlook
- Local home prices are declining (-3.0%/yr); year-one equity from $484 of loan paydown is wiped out by about $2k of value loss. Plan a longer hold.
- Thurston County population projected at +27% by 2050 — long-run rental-demand tailwind backs the buy-and-hold thesis.
- At projected returns (-3.0% appreciation + 3.0% rent growth), your $20k cash investment doubles in ~2 years — after that, you're playing with house money.
Negotiation context
- It's been on market 62 days — a 6% lower offer ($66k) is reasonable based on typical stale-listing flexibility.
Risks & watch-outs
- Climate carrying-cost: moderate flood risk — expect insurance premiums to compound above CPI over the hold.
Questions for the listing agent
- It's been on market 62 days. Have you received any prior offers? Is the seller open to a 6% concession, seller financing, or rate buy-down credit?
- Why hasn't it sold? Are there any deal-killer items the seller is aware of (foundation, flood, title, zoning, code violations)?
- Is there a deadline driving the sale (1031 exchange, divorce, estate, relocation)? That informs how much negotiation room exists.
- What's the average days-on-market for RENTAL listings here right now (not sales)? A rising rental-DOM trend means longer vacancies and softer asking-rent achievability than the comps imply.
- What's the recent tenant-quality profile in this submarket — average credit score on applications, eviction rate, late-payment / NSF rate, and stable-employment percentage? A property-management company in the area should have these aggregated.
- How much new for-sale + rental construction is in the pipeline within 1–3 miles? Heavy new supply typically softens prices + rents 12–24 months out; constrained supply supports both.
Investment metrics
- 1% rule
- 2.83% ✓
- Cap rate
- 25.89%
- Cash-on-cash
- 69.98%
- DSCR
- 4.11
- GRM
- 2.9
CMA / ARV
- ARV (on-the-fly)
- $156,606
- Comps found
- 7
Show comp detail 7 sales within ~0.75 mi
| Address | Dist | Beds/Ba | Sqft | Sold | Price | $/sf | Match |
|---|---|---|---|---|---|---|---|
| 17340 Sargent Rd #17 | 0.01mi | 3/2.0 | 1,120 (-8%) | 3mo | $144,000 | $129 | 84 |
| 17340 Sargent Rd SW #61 | 0.08mi | 3/2.0 | 1,344 (+11%) | 4mo | $148,500 | $110 | 75 |
| 17340 SW Sargent Rd #24 | 0.06mi | 3/2.0 | 1,296 (+7%) | 22mo | $190,000 | $147 | 68 |
| 17340 Sargent Rd SW #23 | 0.05mi | 3/2.0 | 1,344 (+11%) | 15mo | $157,000 | $117 | 67 |
| 17340 Sargent Rd SW #39 | 0.16mi | 3/2.0 | 1,334 (+10%) | 13mo | $249,900 | $187 | 65 |
| 18042 Sargent Rd SW #1 | 0.66mi | 3/2.0 | 1,388 (+14%) | 1mo | $173,000 | $125 | 44 |
| 16831 Sargent Rd SW | 0.54mi | 2/2.0 (-1) | 1,344 (+11%) | 22mo | $405,000 | $301 | 33 |
Match score weights: distance 35% · size 25% · config 20% · recency 20%. Top-matched comps best support the ARV.
Projected returns pro-forma
-3.0% appreciation · 3.0% rent growth · sell at horizon
- IRR
- 69.5%
- Equity multiple
- 4.13×
- Total profit
- $61,445
- Equity at exit
- $10,437
- IRR
- 73.5%
- Equity multiple
- 8.51×
- Total profit
- $147,210
- Equity at exit
- $6,052
Cash invested: $19,600 (down + closing). Projections, not guarantees.
Landlord ↔ Tenant lean methodology
- Overall (STATE)
- 28 Tenant-Leaning
- State Washington
- 28 Tenant-Leaning · D+8
- County
- — inherits STATE
- City
- — inherits STATE
ZIP-level market 98579
- Home prices YoY
- -34.1%
- Active inventory
- 107
- Price-to-rent
- 2.9×
Monthly cashflow live
- Estimated rent
- $1,981 medium interval (Pro) →
- Mortgage (P&I)
- −$367
- Tax from tax record
- −$26 /mo · $310/yr
- Insurance
- −$29
- HOA
- −$0
- Vacancy / Maint / Mgmt
- −$416
- Net cashflow
- $1,143
Break-even live
UW: 25.0% down · 7.5% · 30yr · 1.5% tax · 5.0% vac · 8.0% maint · 8.0% mgmt
Financing live
Cash to close
- Down payment
- $17,500
- Closing costs
- $2,100
- Reserves months
- —
- Total cash needed
- —
Loan-product check · same deal, 3 products live
Conventional
25% down · 7.5% · 30yr
- Down + closing
- —
- Monthly P&I
- —
- Monthly cashflow
- —
- DSCR
- —
- Eligible?
- —
Personal DTI + credit; lowest rate.
DSCR
20% down · 8.5% · 30yr
- Down + closing
- —
- Monthly P&I
- —
- Monthly cashflow
- —
- DSCR
- —
- Eligible?
- —
No personal income docs; deal must DSCR.
Hard money
10% down · 12.0% · 12mo
- Down + closing
- —
- Monthly P&I
- —
- Monthly cashflow
- —
- DSCR
- —
- Eligible?
- —
Short-term bridge; refi at stabilization.
Listing history 17 events
-
2026-06-18days on market $70,000 Active 62 DOM
-
2026-06-17days on market $70,000 Active 61 DOM
-
2026-06-16days on market $70,000 Active 60 DOM
-
2026-06-15days on market $70,000 Active 59 DOM
-
2026-06-14days on market $70,000 Active 57 DOM
-
2026-06-13days on market $70,000 Active 56 DOM
-
2026-06-10days on market $70,000 Active 54 DOM
-
2026-06-09days on market $70,000 Active 53 DOM
-
2026-06-09price $70,000 Active 52 DOM
-
2026-06-08days on market $80,000 Active 52 DOM
-
2026-06-07days on market $80,000 Active 51 DOM
-
2026-06-05days on market $80,000 Active 48 DOM
-
2026-06-02days on market $80,000 Active 46 DOM
-
2026-06-01days on market $80,000 Active 45 DOM
-
2026-05-31days on market $80,000 Active 44 DOM
-
2026-05-30days on market $80,000 Active 43 DOM
-
2026-04-17$80,000 Active
ⓘ Source: listings_history table (triggers on properties + properties_extension) + one-shot
backfill from property_details.listing_events for pre-trigger history.
Tax reassessment forecast WA · Resets to sale price
- Current annual tax
- $310 · $26/mo
- Projected year-2 tax
- $686 · $57/mo
- Expected delta
- +$376/yr (+$31/mo · 121.3%)
ⓘ Screening estimate from a state-policy table — verify with the county assessor before closing.
Climate risk First Street
- Flood 5/10 Major FEMA zone X (unshaded) · 53% chance over 30 yrs
- Wildfire 4/10 Moderate
- Heat 2/10 Low 7 d/yr ≥89°F today · 14 d/yr by 30 yrs out
- Wind 1/10 Low
- Air quality 6/10 Major 8 unhealthy d/yr today · 8 by 30 yrs out
Nearby sold comps map
Loading sold comps map…
Walkable amenities ~0.75 mi
Loading nearby amenities…
Taxation est. · year 1
- Rental income
- $23,773
- − Mortgage interest
- −$3,921
- − Property taxes
- −$310
- − Insurance
- −$350
- − Repairs & maintenance
- −$1,902
- − Management
- −$1,902
- − Depreciation
- −$2,036
- Taxable income
- $13,352
- Est. tax owed @ 24.0%
- −$3,204
- After-tax cash flow
- $10,511/yr
For passive investors: Depreciation is non-cash, so a rental often shows a tax loss while cash-flowing — sheltering income. Rental losses are passive: they offset passive income freely, and up to $25,000/yr can offset ordinary (W-2) income if you actively participate and your MAGI is under $100k (phasing out to $0 by $150k); unused losses carry forward. On sale, claimed depreciation is recaptured at up to 25%, and gains may owe capital-gains tax (a 1031 exchange can defer both). Figures are a year-1 estimate at your 24.0% rate — not tax advice; consult a CPA.
Schools (NCES district)
- District
- Rochester School District
- NCES district ID
- 5307470
- Math proficiency
- 53% ▲ 5.00%
- Reading proficiency
- 57% ▲ 1.00%
- Median HH income
- $56,231
- Composite
- 49.33/100
- National rank
- #4348
- State rank
- #97 of 291 in WA
Livability — Rochester
- Score
- 66/100
- State rank
- #327
- US rank
- #12271
Category grades
Schools grade is shown separately in the Schools card above.
Census & demographics
- Population (ZIP)
- 13,907
Population outlook (Thurston County) Hauer SSP2
- Today (2025)
- 308,239 people
- By 2030
- 326,483 · +5.9%
- By 2040
- 359,890 · +16.8%
- By 2050
- 391,800 · +27.1%
- By 2075
- 468,024 · +51.8%
- By 2100
- 519,890 · +68.7%
Race, ethnicity, and origin ACS 2023
- Neighborhood character
- Predominantly White (81%)
- Race & ethnicity
- White 81% Hispanic / Latino 10% Two or more races 10% Native American 1%
- Hispanic origin (detail)
- Mexican 9%
- Common ancestry
- Portuguese 4% Slovak 4% Italian 3%
- Foreign-born
- 5% · Canada
- Languages at home
- 93% English-only · Spanish 7%
Political lean MEDSL · Thurston
- 2024 margin
- Strong D (+20.4) · D 58.5% · R 38.1% · Other 3.5%
- 2008→2024 swing
- -1.3pp toward R · 2008: 21.7pp · 2024: 20.4pp
- All cycles
- 2024: D+20.4 2020: D+18.6 2016: D+15.4 2012: D+19.0 2008: D+21.7
Not yet ingested
- Civics
- —
Market trends
- HPI YoY
- ▼ -197.25%
- Current HPI
- 381.8969
- Rent YoY
- —
- Metro
- —
- State GDP YoY
- ▲ 4.65%
- F500 in state
- 22
Industry mix (Fortune 500 HQ in WA)
| Industry | F500 HQs | Revenue |
|---|---|---|
| Retail | 2 | $269B |
|
||
| Technology / Retail | 1 | $638B |
|
||
| Technology | 1 | $245B |
|
||
| Telecommunications | 1 | $38B |
|
||
| Food / Beverage | 1 | $36B |
|
||
| Automotive / Trucks | 1 | $34B |
|
||
Price history
1 event — show timeline
- 2026-04-17 Listed $80,000 NWMLS as Distributed by MLS Grid
Property tax history
+1.5%/yrLatest (2026): $310 · -5.6% YoY. Source: county tax records.
Cash-flow waterfall
monthlySold comps — $/sqft
last 12 mo · ≤1 miLoading sold comps…