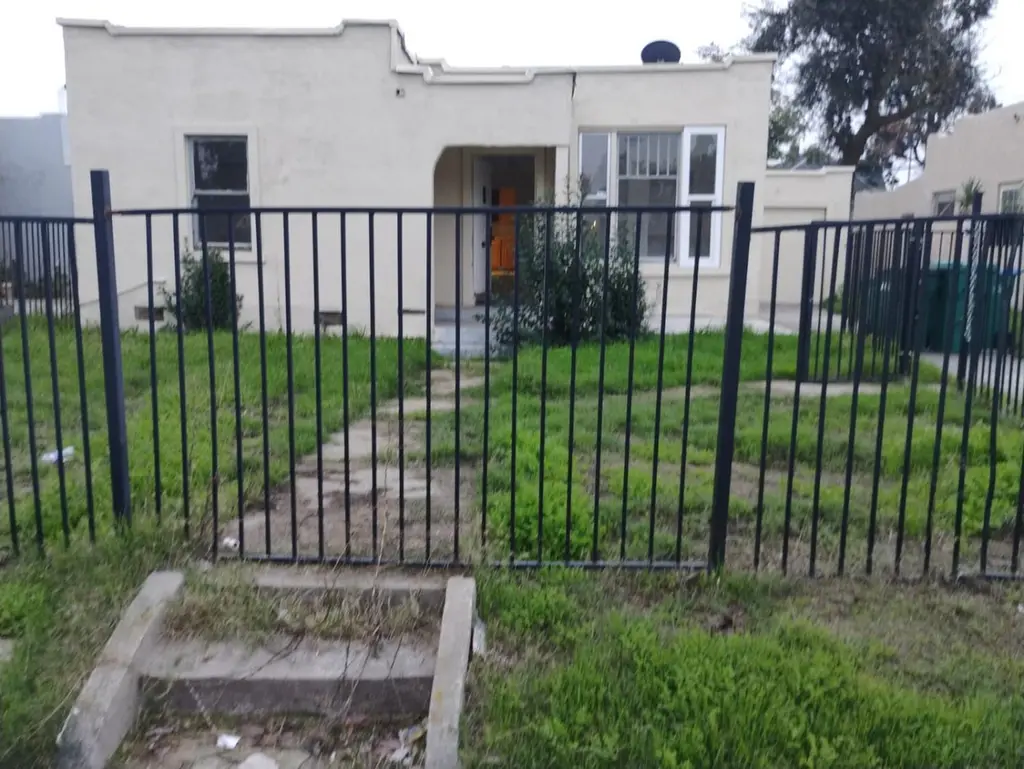
1806 E Poplar St · Stockton, CA
Flood risk 4/10 · Minor
- FEMA flood zone
- X
- Chance of flooding over 30 yrs
- 0.23%
- Est. flood insurance / yr
- $507 – $1,088
Fire risk 1/10 · Minimal
- Est. fire insurance / yr
- $659 – $1,223
Heat risk 7/10 · Major
- Hot days now (above 103°F)
- 7 days/yr
- Hot days in 30 yrs
- 15 days/yr
Wind risk 1/10 · Minimal
- Chance of severe wind over 30 yrs
- —
Air-quality risk 10/10 · Severe
- Unhealthy air days now
- 30 days/yr
- Unhealthy air days in 30 yrs
- 30 days/yr
Risk factors via First Street. Map © Google.
Why this score? — see what drove the D grade
The composite is a weighted blend of 9 inputs, each scored 0–100. Each bar is that input's sub-score; the figure is the points it added to the 100-point composite (weight × sub-score).
- ARV discount +15.0/15.0
- Cash flow +11.1/30.0
- DSCR +3.2/10.0
- Schools +2.9/10.0
- Livability +2.9/5.0
- Rent growth +2.5/5.0
- Condition / age +2.5/5.0
- 1% rule +1.9/10.0
- Appreciation +0.0/10.0
$270,000
🖨 Deal sheet (PDF) 📄 Offer letter ✓ Due diligence
Listing remarks
Inside - outside just painted, remodeled bathroom, new granite kitchen counter, new pex waterline, new drain-line, house has partial basement
Key facts
- New drain-line
- Remodeled bathroom
- Partial basement
Tags
Neighborhood map
What this means for you Summary
Snapshot
- This is a 2-bed/1.0-bath single-family listed at $270k.
Deal economics
- At list price, monthly cash flow is $-109 ($-1k/yr) — negative.
- To cash-flow at today's rent, offer at most $251k (7.2% below list).
- To meet the 1% rule (rent ≥ 1% of price), the offer needs to be $187k (30.7% below list).
- Recommended offer: $187k (30.7% below list) — sets the bar for 1% rule.
- Cap rate 5.8% vs local median 3.6% in Stockton — top-decile yield for the area; either an underpriced asset or a hidden risk that comps aren't pricing in. Stress-test before assuming the spread holds.
Location & tenants
- Location reads 57/100 on livability (#734 in CA) — a working-class tenant base; expect higher turnover. Strengths: housing A+, health & safety A, amenities A-; Watch: employment C-, crime F, commute F.
- Stockton Unified (urban): math 23% / reading 46% proficiency, ranked #295 of 517 in CA (top 57%) — families likely to look elsewhere, expect single-tenant / working-renter base with shorter leases; 78% free/reduced lunch — lower-income household profile, screen leases tightly.
- Zoned schools: King Elementary (987 students, 84% FRL); Stagg Senior High (math 12% / reading 32%, grade F, #950 of 1,170 statewide, top 82%, 1,773 students, 71% FRL) — zoned schools at 78% FRL track the district average.
- Zoned-school proficiency averages 22% at this address vs 34% district-wide (-12 pts) — the specific schools serving this property underperform the Stockton Unified average; the district grade overstates school quality for this exact location.
- Market conditions: 87 active listings in the ZIP; 9 comparable units currently listed for rent nearby; rentals at typical pace (median 25d on market — plan ~3-4 weeks tenant-placement turnaround); 3,779 units permitted in San Joaquin County in 2024 (0 in 5+ unit buildings).
- This rent runs 37% of the median local income ($60k/yr) — at the standard rent-burdened threshold; future hikes will face affordability resistance.
Forward outlook
- Local home prices are declining (-3.0%/yr); year-one equity from $2k of loan paydown is wiped out by about $8k of value loss. Plan a longer hold.
- San Joaquin County population projected at +17% by 2050 — long-run rental-demand tailwind backs the buy-and-hold thesis.
Negotiation context
- It's been on market 37 days — a 3% lower offer ($262k) is reasonable based on typical stale-listing flexibility.
- Current owner paid $65k; list at $270k implies a 315% gain — meaningful room to come down on a strong offer.
Risks & watch-outs
- Watch-outs: built in 1937 — expect roof / HVAC / electrical / plumbing capex.
- Climate carrying-cost: extreme-heat days projected 7→15/yr by 2055 (HVAC capex compounding) — expect insurance premiums to compound above CPI over the hold.
Questions for the listing agent
- What do current leases actually rent for vs. the listed asking? Can we see a recent rent roll and the last 12 months of T-12 income?
- It's been on market 37 days. Have you received any prior offers? Is the seller open to a 31% concession, seller financing, or rate buy-down credit?
- Built in 1937 — when were the roof, HVAC, electrical panel, plumbing, and water heater last replaced?
- Is there a deadline driving the sale (1031 exchange, divorce, estate, relocation)? That informs how much negotiation room exists.
- Schools are D-rated, which usually means shorter tenancies and higher turnover. Who's the typical renter profile here, and what's been the actual vacancy rate?
- Crime grade is F in this area — have there been break-ins, vandalism, or insurance claims at this property in the last 3 years? What carrier currently insures it and at what premium?
- The area grade is low — what's the realistic commute time and amenity access for the typical tenant pool here? Any planned neighborhood developments (good or bad) we should know about?
- What's the average days-on-market for RENTAL listings here right now (not sales)? A rising rental-DOM trend means longer vacancies and softer asking-rent achievability than the comps imply.
- What's the recent tenant-quality profile in this submarket — average credit score on applications, eviction rate, late-payment / NSF rate, and stable-employment percentage? A property-management company in the area should have these aggregated.
- How much new for-sale + rental construction is in the pipeline within 1–3 miles? Heavy new supply typically softens prices + rents 12–24 months out; constrained supply supports both.
Investment metrics
- 1% rule
- 0.69% ✗
- Cap rate
- 5.81%
- Cash-on-cash
- -1.74%
- DSCR
- 0.92
- GRM
- 12.0
CMA / ARV
- ARV (median comp)
- $359,179
- List price
- $270,000
- Delta
- -24.83%
- Verdict
- UNDERPRICED
- Comps
- 20 within 1.0 mi
Show comp detail 12 sales within ~0.75 mi
| Address | Dist | Beds/Ba | Sqft | Sold | Price | $/sf | Match |
|---|---|---|---|---|---|---|---|
| 1845 E Poplar St | 0.04mi | 2/1.5 | 1,133 (-7%) | 6mo | $275,000 | $243 | 80 |
| 1815 E Robertson St | 0.07mi | 3/1.0 (+1) | 1,140 (-6%) | 8mo | $360,000 | $316 | 74 |
| 1620 E Harding Way | 0.43mi | 3/1.0 (+1) | 1,242 (+2%) | 2mo | $359,000 | $289 | 70 |
| 1224 Pinchot | 0.52mi | 3/2.0 (+1) | 1,214 (-0%) | 9mo | $360,000 | $297 | 59 |
| 1135 N Pilgrim St | 0.52mi | 2/2.0 | 1,140 (-6%) | 8mo | $377,000 | $331 | 55 |
| 2343 Finland Ave | 0.60mi | 3/1.0 (+1) | 1,199 (-2%) | 13mo | $392,500 | $327 | 54 |
| 2421 Hackberry | 0.62mi | 3/2.0 (+1) | 1,260 (+4%) | 4mo | $410,000 | $325 | 53 |
| 2303 E Acacia St | 0.43mi | 2/1.0 | 1,092 (-10%) | 12mo | $195,000 | $179 | 52 |
| 2327 E Acacia St | 0.49mi | 2/1.0 | 1,055 (-13%) | 5mo | $330,000 | $313 | 51 |
| 2355 E Fremont St | 0.58mi | 2/1.0 | 1,088 (-11%) | 10mo | $275,000 | $253 | 47 |
| 1621 E Regal St | 0.57mi | 3/1.0 (+1) | 1,065 (-12%) | 2mo | $339,000 | $318 | 46 |
| 1621 N Stanford Ave | 0.73mi | 2/2.0 | 1,121 (-8%) | 10mo | $360,000 | $321 | 40 |
Match score weights: distance 35% · size 25% · config 20% · recency 20%. Top-matched comps best support the ARV.
Projected returns pro-forma
-3.0% appreciation · 3.0% rent growth · sell at horizon
- IRR
- -19.2%
- Equity multiple
- 0.33×
- Total profit
- $-50,860
- Equity at exit
- $40,258
- IRR
- -12.0%
- Equity multiple
- 0.29×
- Total profit
- $-53,837
- Equity at exit
- $23,345
Cash invested: $75,600 (down + closing). Projections, not guarantees.
Landlord ↔ Tenant lean methodology
- Overall (STATE)
- 18 Strongly Tenant-Friendly
- State California
- 18 Strongly Tenant-Friendly · D+13
- County
- — inherits STATE
- City
- — inherits STATE
ZIP-level market 95205
- Active inventory
- 87
- Price-to-rent
- 12.0×
Monthly cashflow live
- Estimated rent
- $1,871 high interval (Pro) →
- Mortgage (P&I)
- −$1,416
- Tax from tax record
- −$59 /mo · $707/yr
- Insurance
- −$112
- HOA
- −$0
- Vacancy / Maint / Mgmt
- −$393
- Net cashflow
- $-109
Break-even live
Sensitivity live
| Price | -10% $43 | -5% $-33 | +0% $-109 | +5% $-186 | +10% $-262 |
|---|---|---|---|---|---|
| Rent | -10% $-257 | -5% $-183 | +0% $-109 | +5% $-35 | +10% $38 |
| Rate | -1.0pp $27 | -0.5pp $-41 | base $-109 | +0.5pp $-179 | +1.0pp $-250 |
UW: 25.0% down · 7.5% · 30yr · 1.5% tax · 5.0% vac · 8.0% maint · 8.0% mgmt
Financing live
Cash to close
- Down payment
- $67,500
- Closing costs
- $8,100
- Reserves months
- —
- Total cash needed
- —
Loan-product check · same deal, 3 products live
Conventional
25% down · 7.5% · 30yr
- Down + closing
- —
- Monthly P&I
- —
- Monthly cashflow
- —
- DSCR
- —
- Eligible?
- —
Personal DTI + credit; lowest rate.
DSCR
20% down · 8.5% · 30yr
- Down + closing
- —
- Monthly P&I
- —
- Monthly cashflow
- —
- DSCR
- —
- Eligible?
- —
No personal income docs; deal must DSCR.
Hard money
10% down · 12.0% · 12mo
- Down + closing
- —
- Monthly P&I
- —
- Monthly cashflow
- —
- DSCR
- —
- Eligible?
- —
Short-term bridge; refi at stabilization.
Rent comps 9 comps
| Address | Beds | Baths | Sqft | Rent | $/sqft | DOM | Units | Dist |
|---|---|---|---|---|---|---|---|---|
| 1526 N Sierra Nevada St Stockton, CA | 3.0 | 2.0 | 1024 | $2,600 | $2.54 | 25d | 1 | 0.55mi |
| 610 E Oak St Stockton, CA | 2.0 | 1.0 | 930 | $1,550 | $1.67 | 25d | 1 | 0.87mi |
| 2271 E Church St Stockton, CA | 3.0 | 1.5 | 1285 | $2,245 | $1.75 | 25d | 1 | 1.04mi |
| 945 N El Dorado St Stockton, CA | 1.0 | 1.0 | 635 | $1,450 | $2.28 | 25d | 6 | 1.25mi |
| 44 E Alder St Stockton, CA | 1.0 | 2.0 | 829 | $1,300 | $1.57 | 25d | 1 | 1.40mi |
| 521 S Sutter St Stockton, CA | 2.0 | 1.0 | 810 | $1,195 | $1.48 | 45d | 1 | 1.43mi |
| 32 E Wyandotte St Apt D Stockton, CA | 2.0 | 1.0 | 900 | $1,500 | $1.67 | 45d | 1 | 1.47mi |
| 3232 Sanguinetti Ln Unit A Stockton, CA | 3.0 | 3.0 | 1378 | $2,200 | $1.60 | 25d | 1 | 1.50mi |
| 3232 Sanguinetti Ln Unit B Stockton, CA | 2.0 | 2.0 | 1378 | $2,200 | $1.60 | 25d | 1 | 1.50mi |
Listing history 7 events
-
2026-06-21days on market $270,000 Active 37 DOM
-
2026-06-18days on market $270,000 Active 34 DOM
-
2026-06-17days on market $270,000 Active 33 DOM
-
2026-06-16days on market $270,000 Active 32 DOM
-
2026-06-15days on market $270,000 Active 31 DOM
-
2026-06-14statusdays on market $270,000 Active 29 DOM
-
1999-08-25soldstatus $65,000
ⓘ Source: listings_history table (triggers on properties + properties_extension) + one-shot
backfill from property_details.listing_events for pre-trigger history.
Tax reassessment forecast CA · Resets to sale price
- Current annual tax
- $707 · $59/mo
- Projected year-2 tax
- $2,052 · $171/mo
- Expected delta
- +$1,345/yr (+$112/mo · 190.1%)
ⓘ Screening estimate from a state-policy table — verify with the county assessor before closing.
Climate risk First Street
- Flood 4/10 Moderate FEMA zone X · 23% chance over 30 yrs
- Wildfire 1/10 Low
- Heat 7/10 Severe 7 d/yr ≥103°F today · 15 d/yr by 30 yrs out
- Wind 1/10 Low
- Air quality 10/10 Extreme 30 unhealthy d/yr today · 30 by 30 yrs out
Nearby sold comps map
Loading sold comps map…
Walkable amenities ~0.75 mi
Loading nearby amenities…
Taxation est. · year 1
- Rental income
- $22,451
- − Mortgage interest
- −$15,124
- − Property taxes
- −$707
- − Insurance
- −$1,350
- − Repairs & maintenance
- −$1,796
- − Management
- −$1,796
- − Depreciation
- −$7,855
- Taxable loss
- −$6,178
- Est. tax savings @ 24.0%
- +$1,483
- After-tax cash flow
- $170/yr
For passive investors: Depreciation is non-cash, so a rental often shows a tax loss while cash-flowing — sheltering income. Rental losses are passive: they offset passive income freely, and up to $25,000/yr can offset ordinary (W-2) income if you actively participate and your MAGI is under $100k (phasing out to $0 by $150k); unused losses carry forward. On sale, claimed depreciation is recaptured at up to 25%, and gains may owe capital-gains tax (a 1031 exchange can defer both). Figures are a year-1 estimate at your 24.0% rate — not tax advice; consult a CPA.
Schools (NCES district)
- District
- Stockton Unified
- NCES district ID
- 0638010
- Math proficiency
- 23% ▲ 2.00%
- Reading proficiency
- 46% ▲ 16.00%
- Median HH income
- $37,563
- Composite
- 28.65/100
- National rank
- #6701
- State rank
- #295 of 517 in CA
Livability — Stockton
- Score
- 57/100
- State rank
- #734
- US rank
- #21638
Category grades
Schools grade is shown separately in the Schools card above.
Census & demographics
- Census place
- Stockton, CA
- County
- San Joaquin County · 729,570 people
- City population
- 332,006
- Metro
- Stockton, CA
- Population (ZIP)
- 39,608
- Household income
- $60,325
- Rent vs Own
- Severe rent burden
- 1712.0
Population outlook (San Joaquin County) Hauer SSP2
- Today (2025)
- 796,965 people
- By 2030
- 828,849 · +4.0%
- By 2040
- 885,611 · +11.1%
- By 2050
- 929,798 · +16.7%
- By 2075
- 994,578 · +24.8%
- By 2100
- 971,291 · +21.9%
Race, ethnicity, and origin ACS 2023
- Neighborhood character
- Predominantly Hispanic (77%)
- Race & ethnicity
- Hispanic / Latino 77% Two or more races 21% White 9% Asian 6% Black 6% Native American 2%
- Hispanic origin (detail)
- Mexican 72%
- Foreign-born
- 33% · Canada
- Languages at home
- 36% English-only · Spanish 58% Tagalog/Filipino 2% Other Indo-European 2%
Political lean MEDSL · San Joaquin
- 2024 margin
- Toss-up / Even · D 48.0% · R 48.9% · Other 3.0%
- 2008→2024 swing
- -11.6pp toward R · 2008: 10.7pp · 2024: -0.9pp
- All cycles
- 2024: R+0.9 2020: D+13.9 2016: D+12.9 2012: D+8.9 2008: D+10.7
Not yet ingested
- Civics
- —
Market trends
- HPI YoY
- ▼ -298.45%
- Current HPI
- 502.8934
- Rent YoY
- —
- Metro
- Stockton, CA
- State GDP YoY
- ▲ 3.21%
- F500 in state
- 116
Industry mix (Fortune 500 HQ in CA)
| Industry | F500 HQs | Revenue |
|---|---|---|
| Technology | 27 | $1,492B |
|
||
| Financial Services | 3 | $174B |
|
||
| Retail | 3 | $44B |
|
||
| Insurance | 3 | $26B |
|
||
| Media / Entertainment | 2 | $115B |
|
||
| Pharmaceuticals / Biotech | 2 | $62B |
|
||
Price history
1 event — show timeline
- 1999-08-25 Sold (Public Records) $65,000 Public Records
Property tax history
-4.6%/yrLatest (2025): $707 · +1.5% YoY. Source: county tax records.
Cash-flow waterfall
monthlySold comps — $/sqft
last 12 mo · ≤1 miLoading sold comps…