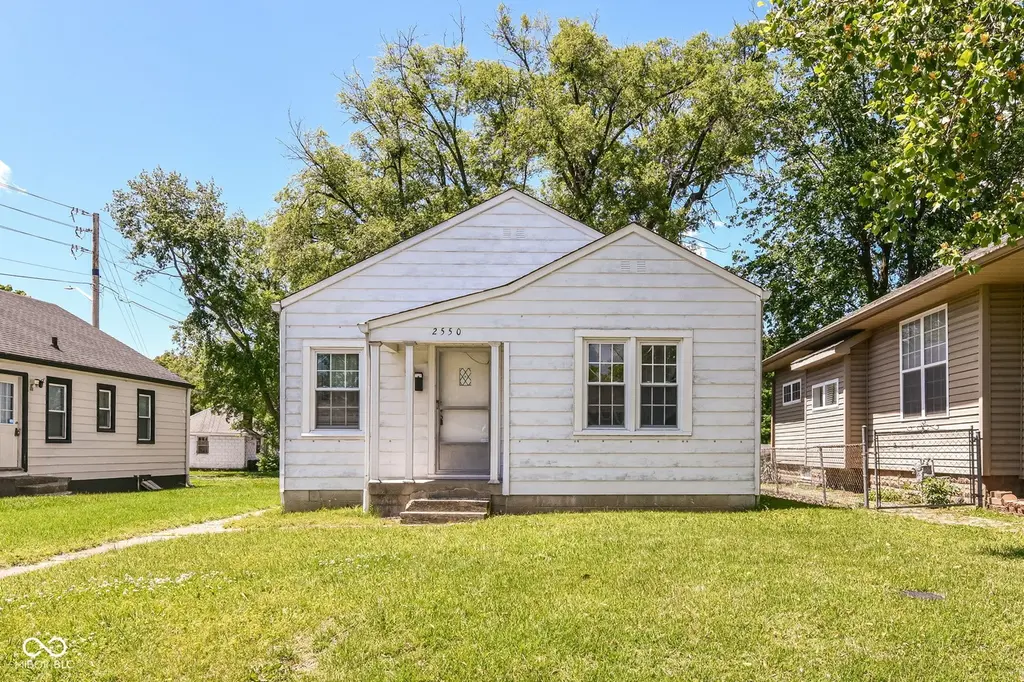
2550 S Pennsylvania St · Indianapolis city (balance), IN
Flood risk 1/10 · Minimal
- FEMA flood zone
- X (unshaded)
- Chance of flooding over 30 yrs
- 0.0%
- Est. flood insurance / yr
- $507 – $1,088
Fire risk 1/10 · Minimal
- Est. fire insurance / yr
- $717 – $1,331
Heat risk 4/10 · Minor
- Hot days now (above 101°F)
- 7 days/yr
- Hot days in 30 yrs
- 18 days/yr
Wind risk 2/10 · Minimal
- Chance of severe wind over 30 yrs
- 0.0%
Air-quality risk 3/10 · Minor
- Unhealthy air days now
- 2 days/yr
- Unhealthy air days in 30 yrs
- 3 days/yr
Risk factors via First Street. Map © Google.
Why this score? — see what drove the B- grade
The composite is a weighted blend of 9 inputs, each scored 0–100. Each bar is that input's sub-score; the figure is the points it added to the 100-point composite (weight × sub-score).
- Cash flow +24.9/30.0
- ARV discount +15.0/15.0
- DSCR +8.1/10.0
- 1% rule +5.7/10.0
- Rent growth +5.0/5.0
- Livability +2.5/5.0
- Condition / age +2.5/5.0
- Schools +1.4/10.0
- Appreciation +0.0/10.0
$110,000
🖨 Deal sheet 📄 Offer letter ✓ Due diligence
Listing remarks
If these walls could talk. .. " they would tell the story of a home that has been deeply loved and exceptionally cared for since 1974. The same owner made a lifetime of memories here, and it shows in every detail of this well-maintained 3 bedroom, 1 bath home. From the moment you step inside, you'll appreciate the character and craftsmanship that are hard to find in today's new construction. The gleaming hardwood flooring in the entry has been protected beneath carpet for years and is now ready to shine once again. The eat-in kitchen offers an abundance of cabinet space and comes complete with all appliances. Vinyl replacement windows have updated the home while maintaining its charm,
Key facts
- Eat-in kitchen
- 4,617 sq ft lot
- Built 1946
Tags
Property features AI
Finance
- HOA & community: Not a low-maintenance lifestyle community
Exterior
- Parking: On-street parking
- Utilities: Public water; Municipal sewer connected; Electricity connected; Natural gas connected; Cable available; Solid waste service available; Renewable fuel source
- Home design: Single-family residence; One-story
- Construction: Aluminum siding, brick, and block construction; Block foundation
- Exterior features: Covered, glass-enclosed porch/patio; Mini barn on property; City lot with sidewalks and mature trees; Less than 1/4 acre lot
Interior
- Kitchen: Gas oven; Range hood; Microwave; Refrigerator; Eat-in kitchen
- Bedrooms: 3 bedrooms on the main level (bedroom split layout)
- Flooring: Hardwood floors
- Bathrooms: 1 full bathroom with tub and shower
- Heating & cooling: Natural gas heat; Whole-house fan; Window air conditioning units
- Interior features: Hardwood floors; Eat-in kitchen; Covered, glass-enclosed porch/patio; Mini barn
- Laundry & utility: Washer and dryer included; Laundry room on the main level; Laundry in unit
Neighborhood map
What this means for you Summary
Snapshot
- This is a 2-bed/1.0-bath single-family listed at $110k.
Deal economics
- At list price, monthly cash flow is $237 ($3k/yr) — positive.
- The deal already cash-flows at list — no discount required.
- Meets the 1% rule at list price ($1k rent vs $110k).
- Cap rate 8.9% vs local median 4.4% in Indianapolis city (balance) — top-decile yield for the area; either an underpriced asset or a hidden risk that comps aren't pricing in. Stress-test before assuming the spread holds.
Location & tenants
- Location reads: area grade B — affects rentability + tenant quality, not the cash-flow math above.
- Indianapolis Public Schools (urban): math 14% / reading 20% proficiency, ranked #286 of 301 in IN (top 95%) — low school quality limits family demand, transient renter base, plan for 1-2y turnover; 77% free/reduced lunch — lower-income household profile, screen leases tightly.
- Zoned schools: George Washington High School (math 2% / reading 17%, grade F, #366 of 369 statewide, top 99%, 753 students, 68% FRL).
- Market conditions: Rents rising fast (+11.0%/yr); 129 active listings in the ZIP; 40 comparable units currently listed for rent nearby; rentals at typical pace (median 24d on market — plan ~3-4 weeks tenant-placement turnaround); 1,906 units permitted in Marion County in 2024 (621 in 5+ unit buildings).
Forward outlook
- Local home prices are declining (-3.0%/yr); year-one equity from $761 of loan paydown is wiped out by about $3k of value loss. Plan a longer hold.
- Marion County population projected at +18% by 2050 — long-run rental-demand tailwind backs the buy-and-hold thesis.
- At projected returns (-3.0% appreciation + 8.0% rent growth), your $31k cash investment doubles in ~8 years — after that, you're playing with house money.
Negotiation context
- Only 1 days on market — expect competitive offers; lowballing is unlikely to land.
Risks & watch-outs
- Watch-outs: built in 1946 — expect roof / HVAC / electrical / plumbing capex.
Questions for the listing agent
- Built in 1946 — when were the roof, HVAC, electrical panel, plumbing, and water heater last replaced?
- Is there a deadline driving the sale (1031 exchange, divorce, estate, relocation)? That informs how much negotiation room exists.
- What's the average days-on-market for RENTAL listings here right now (not sales)? A rising rental-DOM trend means longer vacancies and softer asking-rent achievability than the comps imply.
- What's the recent tenant-quality profile in this submarket — average credit score on applications, eviction rate, late-payment / NSF rate, and stable-employment percentage? A property-management company in the area should have these aggregated.
- How much new for-sale + rental construction is in the pipeline within 1–3 miles? Heavy new supply typically softens prices + rents 12–24 months out; constrained supply supports both.
Investment metrics
- 1% rule
- 1.07% ✓
- Cap rate
- 8.88%
- Cash-on-cash
- 9.25%
- DSCR
- 1.41
- GRM
- 7.8
CMA / ARV
- ARV (on-the-fly)
- $176,016
- Comps found
- 6
Show comp detail 6 sales within ~0.75 mi
| Address | Dist | Beds/Ba | Sqft | Sold | Price | $/sf | Match |
|---|---|---|---|---|---|---|---|
| 2550 S Pennsylvania St | 0.00mi | 3/1.0 (+1) | 912 (0%) | 1mo | $110,000 | $121 | 94 |
| 113 W Gimber St | 0.35mi | 2/1.0 | 1,008 (+10%) | 10mo | $170,000 | $169 | 58 |
| 121 W Gimber St | 0.36mi | 3/1.5 (+1) | 1,008 (+10%) | 5mo | $193,000 | $191 | 54 |
| 2825 S Delaware St | 0.36mi | 3/1.0 (+1) | 1,035 (+14%) | 6mo | $200,000 | $193 | 51 |
| 806 Cameron St | 0.66mi | 2/1.0 | 1,034 (+13%) | 1mo | $210,000 | $203 | 46 |
| 806 E Gimber St | 0.63mi | 3/1.0 (+1) | 1,008 (+10%) | 21mo | $208,450 | $207 | 31 |
Match score weights: distance 35% · size 25% · config 20% · recency 20%. Top-matched comps best support the ARV.
Projected returns pro-forma
-3.0% appreciation · 8.0% rent growth · sell at horizon
- IRR
- 2.8%
- Equity multiple
- 1.11×
- Total profit
- $3,469
- Equity at exit
- $16,401
- IRR
- 16.4%
- Equity multiple
- 2.64×
- Total profit
- $50,616
- Equity at exit
- $9,511
Cash invested: $30,800 (down + closing). Projections, not guarantees.
Landlord ↔ Tenant lean methodology
- Overall (STATE)
- 90 Strongly Landlord-Friendly
- State Indiana
- 90 Strongly Landlord-Friendly · R+11
- County
- — inherits STATE
- City
- — inherits STATE
ZIP-level market 46225
- Home prices YoY
- -8.2%
- Rents YoY
- 11.0%
- Active inventory
- 129
- Price-to-rent
- 7.8×
Monthly cashflow live
- Estimated rent
- $1,174 high interval (Pro) →
- Mortgage (P&I)
- −$577
- Tax from tax record
- −$67 /mo · $808/yr
- Insurance
- −$46
- HOA
- −$0
- Vacancy / Maint / Mgmt
- −$247
- Net cashflow
- $237
Break-even live
UW: 25.0% down · 7.5% · 30yr · 1.5% tax · 5.0% vac · 8.0% maint · 8.0% mgmt
Financing live
Cash to close
- Down payment
- $27,500
- Closing costs
- $3,300
- Reserves months
- —
- Total cash needed
- —
Loan-product check · same deal, 3 products live
Conventional
25% down · 7.5% · 30yr
- Down + closing
- —
- Monthly P&I
- —
- Monthly cashflow
- —
- DSCR
- —
- Eligible?
- —
Personal DTI + credit; lowest rate.
DSCR
20% down · 8.5% · 30yr
- Down + closing
- —
- Monthly P&I
- —
- Monthly cashflow
- —
- DSCR
- —
- Eligible?
- —
No personal income docs; deal must DSCR.
Hard money
10% down · 12.0% · 12mo
- Down + closing
- —
- Monthly P&I
- —
- Monthly cashflow
- —
- DSCR
- —
- Eligible?
- —
Short-term bridge; refi at stabilization.
Rent comps 40 comps
| Address | Beds | Baths | Sqft | Rent | $/sqft | DOM | Units | Dist |
|---|---|---|---|---|---|---|---|---|
| 265 E Southern Ave Indianapolis, IN | 1.0–2.0 | 1.0 | 800 | $1,150 | $1.44 | 2d | 2 | 0.28mi |
| 272 Hoefgen St Unit 1336809P Indianapolis, IN | 2.0 | 1.0 | 592 | $2,055 | $3.47 | 1d | 1 | 0.30mi |
| 2314 Union St Indianapolis, IN | 3.0 | 2.0 | 892 | $1,295 | $1.45 | 43d | 1 | 0.31mi |
| 2859 S Meridian St Indianapolis, IN | 1.0–2.0 | 1.0 | 771 | $906 | $1.17 | 23d | 2 | 0.33mi |
| 2859 S Meridian St Indianapolis, IN | 1.0–2.0 | 1.0 | 771 | $906 | $1.17 | 43d | 2 | 0.33mi |
| 2904 S Pennsylvania St Indianapolis, IN | 1.0 | 1.0 | 750 | $725 | $0.97 | 23d | 2 | 0.43mi |
| 2760 S East St Indianapolis, IN | 2.0–3.0 | 2.0 | 1072 | $895 | $0.83 | 3d | 3 | 0.46mi |
| 2236 Ransdell St Indianapolis, IN | 2.0 | 1.0 | 850 | $1,150 | $1.35 | 43d | 1 | 0.48mi |
| 2830 S East St Indianapolis, IN | 2.0 | 1.0 | 656 | $1,200 | $1.83 | 43d | 1 | 0.51mi |
| 2209 Ransdell St Indianapolis, IN | 2.0 | 1.0 | 710 | $900 | $1.27 | 43d | 1 | 0.55mi |
| 215 W Troy Ave Indianapolis, IN | 2.0 | 1.0 | 600 | $1,095 | $1.82 | 21d | 1 | 0.62mi |
| 360 Sandra Ln Indianapolis, IN | 1.0–2.0 | 1.0 | 562 | $1,494 | $2.66 | 11d | 9 | 0.66mi |
| 360 Sandra Ln Unit 110-062 Indianapolis, IN | 2.0 | 1.0 | 621 | $949 | $1.53 | 7d | 1 | 0.66mi |
| 360 Sandra Ln Unit 314-D59 Indianapolis, IN | 2.0 | 1.0 | 621 | $1,011 | $1.63 | 3d | 1 | 0.66mi |
| 360 Sandra Ln Unit 319-D126 Indianapolis, IN | 2.0 | 1.0 | 621 | $960 | $1.55 | 2d | 1 | 0.66mi |
| 360 Sandra Ln Unit 110-064 Indianapolis, IN | 2.0 | 1.0 | 621 | $961 | $1.55 | 2d | 1 | 0.66mi |
| 360 Sandra Ln Unit 115-044 Indianapolis, IN | 2.0 | 1.0 | 621 | $999 | $1.61 | 3d | 1 | 0.66mi |
| 360 Sandra Ln Unit 109-013 Indianapolis, IN | 2.0 | 1.0 | 621 | $1,029 | $1.66 | 4d | 1 | 0.66mi |
| 114 Adler St Indianapolis, IN | 2.0 | 1.0 | 688 | $795 | $1.16 | 43d | 1 | 0.86mi |
| 1819 Union St Unit 1817 Indianapolis, IN | 3.0 | 2.0 | 1020 | $1,199 | $1.18 | 43d | 1 | 0.86mi |
| 1756 Delaware St Indianapolis, IN | 3.0 | 2.0 | 1014 | $1,300 | $1.28 | 43d | 1 | 0.91mi |
| 1756 S Delaware St Unit 1754 Indianapolis, IN | 3.0 | 2.0 | 1014 | $1,300 | $1.28 | 14d | 1 | 0.91mi |
| 2555 Shelby St Unit 2559 Indianapolis, IN | 1.0 | 1.0 | 717 | $1,250 | $1.74 | 43d | 1 | 0.94mi |
| 2525 Shelby St Unit 4 Indianapolis, IN | 1.0 | 1.0 | 600 | $775 | $1.29 | 23d | 1 | 0.94mi |
| 2525 Shelby St Unit 1 Indianapolis, IN | 1.0 | 1.0 | 600 | $865 | $1.44 | 2d | 1 | 0.95mi |
| 1011 E Raymond St Indianapolis, IN | 2.0 | 2.0 | 1100 | $1,350 | $1.23 | 23d | 1 | 0.95mi |
| 620 E Beecher St Indianapolis, IN | 3.0 | 2.0 | 1072 | $1,639 | $1.53 | 19d | 1 | 0.96mi |
| 1861 Orleans St Indianapolis, IN | 1.0 | 1.0 | 552 | $2,500 | $4.53 | 23d | 1 | 1.00mi |
| 2103 Ringgold Ave Indianapolis, IN | 1.0 | 1.0 | 1090 | $775 | $0.71 | 13d | 1 | 1.01mi |
| 2948 Shelby St Unit D Indianapolis, IN | 2.0 | 1.0 | 750 | $1,025 | $1.37 | 43d | 1 | 1.03mi |
| 1144 McDougal St Indianapolis, IN | 3.0 | 1.0 | 876 | $1,500 | $1.71 | 21d | 1 | 1.05mi |
| 512 E Minnesota St Unit 203 Indianapolis, IN | 2.0 | 1.0 | 903 | $1,195 | $1.32 | 23d | 1 | 1.12mi |
| 118 E Palmer St Indianapolis, IN | 1.0 | 1.0 | 600 | $649 | $1.08 | 43d | 1 | 1.12mi |
| 118 E Palmer St #120 Indianapolis, IN | 1.0 | 1.0 | 600 | $825 | $1.38 | 17d | 1 | 1.12mi |
| 118 E Palmer St #122 Indianapolis, IN | 1.0 | 1.0 | 600 | $875 | $1.46 | 43d | 1 | 1.12mi |
| 823 Iowa St Indianapolis, IN | 2.0 | 1.0 | 812 | $1,100 | $1.35 | 43d | 1 | 1.14mi |
| 1524 S Talbott St #3 Indianapolis, IN | 1.0 | 1.0 | 1011 | $725 | $0.72 | 7d | 1 | 1.14mi |
| 1461 S Meridian St Unit A Indianapolis, IN | 1.0 | 1.0 | 800 | $950 | $1.19 | 43d | 1 | 1.20mi |
| 1436 S New Jersey St Unit C Indianapolis, IN | 2.0 | 2.0 | 600 | $1,600 | $2.67 | 43d | 1 | 1.23mi |
| 1436 S New Jersey St Unit B Indianapolis, IN | 2.0 | 2.0 | 650 | $1,700 | $2.62 | 7d | 1 | 1.23mi |
Listing history 2 events
-
2026-05-13status Pending
-
2026-05-12$110,000 Active
ⓘ Source: listings_history table (triggers on properties + properties_extension) + one-shot
backfill from property_details.listing_events for pre-trigger history.
Tax reassessment forecast IN · Partial reset (capped growth)
- Current annual tax
- $808 · $67/mo
- Projected year-2 tax
- $872 · $73/mo
- Expected delta
- +$63/yr (+$5/mo · 7.9%)
ⓘ Screening estimate from a state-policy table — verify with the county assessor before closing.
Climate risk First Street
- Flood 1/10 Low FEMA zone X (unshaded) · 0% chance over 30 yrs
- Wildfire 1/10 Low
- Heat 4/10 Moderate 7 d/yr ≥101°F today · 18 d/yr by 30 yrs out
- Wind 2/10 Low 0% chance of damaging wind over 30 yrs
- Air quality 3/10 Moderate 2 unhealthy d/yr today · 3 by 30 yrs out
Nearby sold comps map
Loading sold comps map…
Walkable amenities ~0.75 mi
Loading nearby amenities…
Taxation est. · year 1
- Rental income
- $14,086
- − Mortgage interest
- −$6,162
- − Property taxes
- −$808
- − Insurance
- −$550
- − Repairs & maintenance
- −$1,127
- − Management
- −$1,127
- − Depreciation
- −$3,200
- Taxable income
- $1,113
- Est. tax owed @ 24.0%
- −$267
- After-tax cash flow
- $2,581/yr
For passive investors: Depreciation is non-cash, so a rental often shows a tax loss while cash-flowing — sheltering income. Rental losses are passive: they offset passive income freely, and up to $25,000/yr can offset ordinary (W-2) income if you actively participate and your MAGI is under $100k (phasing out to $0 by $150k); unused losses carry forward. On sale, claimed depreciation is recaptured at up to 25%, and gains may owe capital-gains tax (a 1031 exchange can defer both). Figures are a year-1 estimate at your 24.0% rate — not tax advice; consult a CPA.
Schools (NCES district)
- District
- Indianapolis Public Schools
- NCES district ID
- 1804770
- Math proficiency
- 14% ▼ -7.00%
- Reading proficiency
- 20% ▼ -3.00%
- Median HH income
- $32,034
- Composite
- 13.69/100
- National rank
- #9499
- State rank
- #286 of 301 in IN
Livability — Indianapolis city (balance)
No livability data for this city. (Only ~50 U.S. cities are tracked.)
Census & demographics
- Census place
- Indianapolis city (balance), IN
- County
- Marion County · 998,460 people
- City population
- 881,119
- Metro
- Indianapolis-Carmel-Anderson, IN
- Population (ZIP)
- 6,037
- Household income
- $55,190
- Rent vs Own
- Severe rent burden
- 311.0
Population outlook (Marion County) Hauer SSP2
- Today (2025)
- 1,025,572 people
- By 2030
- 1,065,727 · +3.9%
- By 2040
- 1,141,577 · +11.3%
- By 2050
- 1,208,920 · +17.9%
- By 2075
- 1,367,288 · +33.3%
- By 2100
- 1,438,201 · +40.2%
Race, ethnicity, and origin ACS 2023
- Neighborhood character
- Predominantly White (68%)
- Race & ethnicity
- White 68% Two or more races 12% Black 11% Hispanic / Latino 10% Asian 2%
- Hispanic origin (detail)
- Mexican 6%
- Common ancestry
- Romanian 2% Italian 2% Slovak 1%
- Foreign-born
- 9% · Canada
- Languages at home
- 88% English-only · Spanish 10% German/W. Germanic 1%
Political lean MEDSL · Marion
- 2024 margin
- Strong D (+27.7) · D 63.0% · R 35.3% · Other 1.7%
- 2008→2024 swing
- -0.7pp no change · 2008: 28.4pp · 2024: 27.7pp
- All cycles
- 2024: D+27.7 2020: D+29.1 2016: D+22.8 2012: D+22.2 2008: D+28.4
Not yet ingested
- Civics
- —
Market trends
- HPI YoY
- ▼ -36.19%
- Current HPI
- 403.9271
- Rent YoY
- ▲ 10.98%
- Metro
- Indianapolis-Carmel-Anderson, IN
- State GDP YoY
- ▲ 2.90%
- F500 in state
- 18
Industry mix (Fortune 500 HQ in IN)
| Industry | F500 HQs | Revenue |
|---|---|---|
| Industrial Machinery | 2 | $37B |
|
||
| Healthcare | 1 | $177B |
|
||
| Pharmaceuticals | 1 | $45B |
|
||
| Metals / Steel | 1 | $18B |
|
||
| Agriculture | 1 | $17B |
|
||
| Packaging | 1 | $12B |
|
||
Price history
2 events — show timeline
- 2026-05-13 Pending — MIBOR as Distributed by MLS Grid
- 2026-05-12 Listed $110,000 MIBOR as Distributed by MLS Grid
Property tax history
+7.3%/yrLatest (2025): $808 · +2.5% YoY. Source: county tax records.
Cash-flow waterfall
monthlySold comps — $/sqft
last 12 mo · ≤1 miLoading sold comps…