 🏗️ New Construction
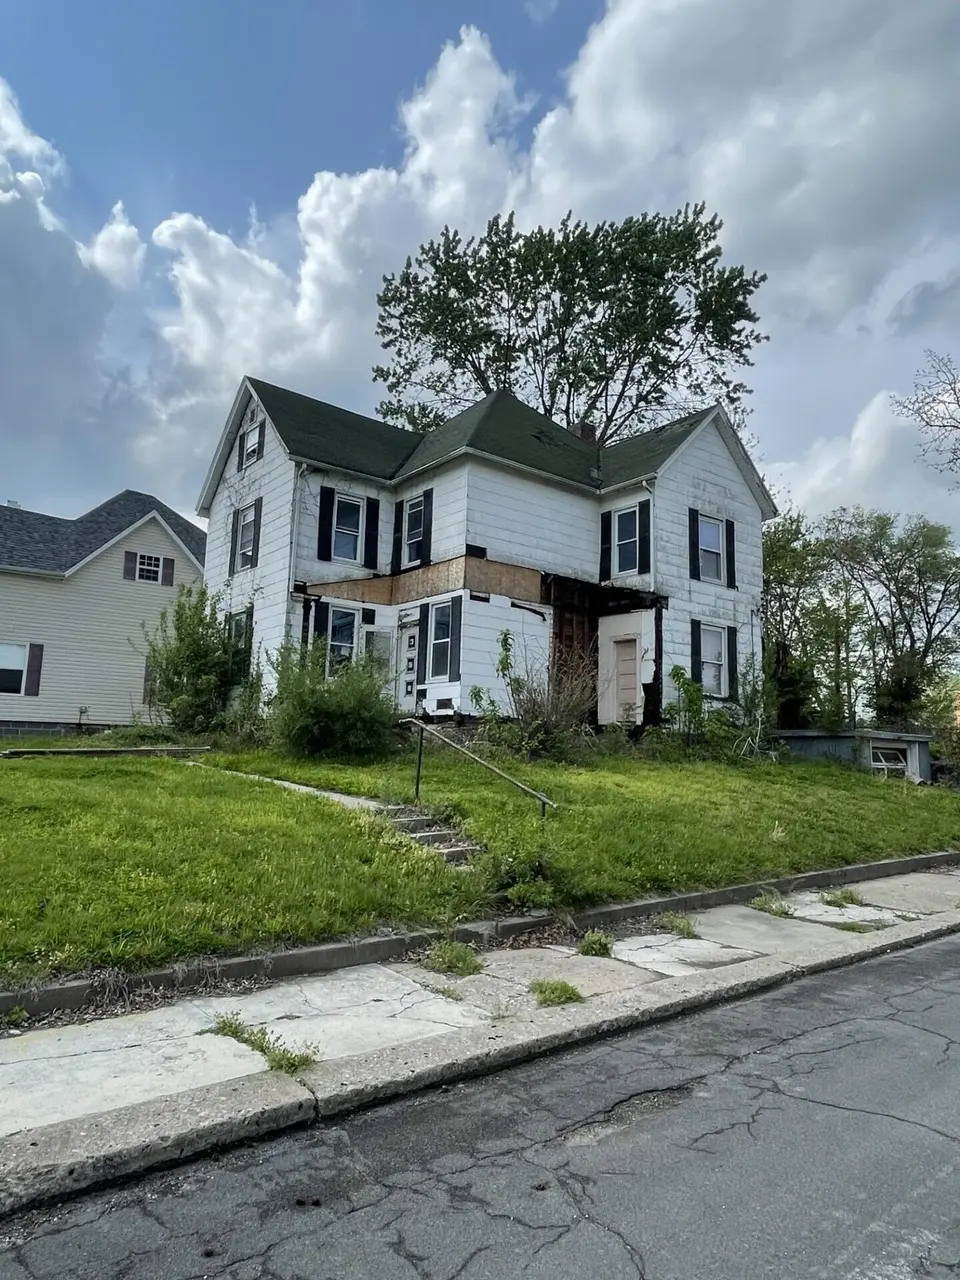
519 Fisk Ave · Moberly, MO
Flood risk 1/10 · Minimal
- FEMA flood zone
- X (unshaded)
- Chance of flooding over 30 yrs
- 0.0%
- Est. flood insurance / yr
- $507 – $1,088
Fire risk 4/10 · Minor
- Est. fire insurance / yr
- $1,054 – $1,958
Heat risk 4/10 · Minor
- Hot days now (above 106°F)
- 7 days/yr
- Hot days in 30 yrs
- 17 days/yr
Wind risk 2/10 · Minimal
- Chance of severe wind over 30 yrs
- —
Air-quality risk 1/10 · Minimal
- Unhealthy air days now
- 0 days/yr
- Unhealthy air days in 30 yrs
- 0 days/yr
Risk factors via First Street. Map © Google.
Why this score? — see what drove the D+ grade
The composite is a weighted blend of 9 inputs, each scored 0–100. Each bar is that input's sub-score; the figure is the points it added to the 100-point composite (weight × sub-score).
- Cash flow +17.9/30.0
- ARV discount +7.5/15.0
- DSCR +5.6/10.0
- 1% rule +4.8/10.0
- Livability +3.9/5.0
- Schools +2.7/10.0
- Rent growth +2.5/5.0
- Condition / age +2.5/5.0
- Appreciation +0.0/10.0
$12,000
🖨 Deal sheet 📄 Offer letter ✓ Due diligence
Listing remarks MLS
This property offers a unique opportunity for redevelopment. The existing structure is beyond renovation, making it ideal for a complete teardown and new construction. Situated on a desirable corner lot, the possibilities are wide open--bring your vision and build something entirely new! Zoned R-2 (single family or duplex)
Key facts
- New construction
- Complete teardown
- Corner lot
Tags
Neighborhood map
What this means for you Summary
Snapshot
- This is a 4-bed/1.5-bath single-family listed at $12k.
Deal economics
- At list price, monthly cash flow is $121 ($1k/yr) — positive.
- The deal already cash-flows at list — no discount required.
- Meets the 1% rule at list price ($1k rent vs $12k).
- Recommended offer: $12k (1.5% below list) — sets the bar for market timing.
- Cap rate 7.3% vs local median 4.5% in Moberly — top-decile yield for the area; either an underpriced asset or a hidden risk that comps aren't pricing in. Stress-test before assuming the spread holds.
Location & tenants
- Location reads 77/100 on livability (#32 in MO, #3,045 nationally) — a middle-class / working-renter tenant base. Strengths: cost of living A+, housing A+, health & safety A+; Watch: employment D, schools D-, amenities F.
- Moberly (town): math 30% / reading 36% proficiency, ranked #246 of 324 in MO (top 76%) — families likely to look elsewhere, expect single-tenant / working-renter base with shorter leases.
- Market conditions: 134 active listings in the ZIP; 25 units permitted in Randolph County in 2024 (0 in 5+ unit buildings).
Forward outlook
- Local home prices are declining (-3.0%/yr); year-one equity from $984 of loan paydown is wiped out by about $4k of value loss. Plan a longer hold.
- Randolph County population projected at -10% by 2050 — secular population decline; favor cash flow + early exit over multi-decade hold.
Negotiation context
- It's been on market 27 days — a 2% lower offer ($12k) is reasonable based on typical stale-listing flexibility.
- 3 sale attempts since 2y ago with the ask held roughly flat each time — persistent listings suggest the price (not the market) is what's stuck; bring a comps-based counter.
Risks & watch-outs
- Watch-outs: property tax is 17.8% of price; built in 1920 — expect roof / HVAC / electrical / plumbing capex.
Questions for the listing agent
- Built in 1920 — when were the roof, HVAC, electrical panel, plumbing, and water heater last replaced?
- Property tax is high relative to price — has the assessment been appealed recently, and will the sale trigger a re-assessment?
- Is there a deadline driving the sale (1031 exchange, divorce, estate, relocation)? That informs how much negotiation room exists.
- Schools are D-rated, which usually means shorter tenancies and higher turnover. Who's the typical renter profile here, and what's been the actual vacancy rate?
- The area grade is low — what's the realistic commute time and amenity access for the typical tenant pool here? Any planned neighborhood developments (good or bad) we should know about?
- What's the average days-on-market for RENTAL listings here right now (not sales)? A rising rental-DOM trend means longer vacancies and softer asking-rent achievability than the comps imply.
- What's the recent tenant-quality profile in this submarket — average credit score on applications, eviction rate, late-payment / NSF rate, and stable-employment percentage? A property-management company in the area should have these aggregated.
- How much new for-sale + rental construction is in the pipeline within 1–3 miles? Heavy new supply typically softens prices + rents 12–24 months out; constrained supply supports both.
Investment metrics
- 1% rule
- 0.98% ✗
- Cap rate
- 7.31%
- Cash-on-cash
- 3.64%
- DSCR
- 1.16
- GRM
- 8.5
CMA / ARV
- ARV (median comp)
- $142,308
- List price
- $12,000
- Delta
- -91.57%
- Verdict
- UNDERPRICED
- Comps
- 20 within 1.0 mi
Show comp detail 12 sales within ~0.75 mi
| Address | Dist | Beds/Ba | Sqft | Sold | Price | $/sf | Match |
|---|---|---|---|---|---|---|---|
| 519 Fisk Ave | 0.00mi | 4/1.5 | 2,592 (-2%) | 1mo | $12,000 | $5 | 97 |
| 523 W Logan St | 0.09mi | 4/2.0 | 2,428 (-8%) | 0mo | $65,000 | $27 | 81 |
| 419 S Fourth St | 0.19mi | 4/1.0 | 2,484 (-6%) | 4mo | $29,900 | $12 | 76 |
| 508 S Williams St | 0.29mi | 4/3.0 | 2,675 (+2%) | 2mo | $74,900 | $28 | 76 |
| 527 W Logan St | 0.09mi | 4/3.0 | 2,420 (-8%) | 11mo | $215,000 | $89 | 67 |
| 816 W Reed St | 0.33mi | 4/1.5 | 2,300 (-13%) | 3mo | $30,000 | $13 | 61 |
| 817 Gilman St | 0.45mi | 4/2.5 | 2,774 (+5%) | 6mo | $329,900 | $119 | 61 |
| 712 Flower Ln | 0.47mi | 4/2.5 | 2,538 (-4%) | 10mo | $249,000 | $98 | 60 |
| 1052 Bond St | 0.66mi | 3/1.5 (-1) | 2,565 (-3%) | 10mo | $129,000 | $50 | 52 |
| 1125 Fisk Ave | 0.62mi | 4/3.0 | 2,744 (+4%) | 10mo | $240,000 | $87 | 50 |
| 911 Beuth Rd | 0.66mi | 3/2.0 (-1) | 2,652 (+1%) | 14mo | $279,000 | $105 | 50 |
| 316 Taylor St | 0.65mi | 4/2.0 | 2,300 (-13%) | 9mo | $189,000 | $82 | 39 |
Match score weights: distance 35% · size 25% · config 20% · recency 20%. Top-matched comps best support the ARV.
Projected returns pro-forma
-3.0% appreciation · 3.0% rent growth · sell at horizon
- IRR
- -10.6%
- Equity multiple
- 0.62×
- Total profit
- $-15,332
- Equity at exit
- $21,219
- IRR
- -1.2%
- Equity multiple
- 0.92×
- Total profit
- $-3,342
- Equity at exit
- $12,304
Cash invested: $39,846 (down + closing). Projections, not guarantees.
Landlord ↔ Tenant lean methodology
- Overall (STATE)
- 81 Strongly Landlord-Friendly
- State Missouri
- 81 Strongly Landlord-Friendly · R+10
- County
- — inherits STATE
- City
- — inherits STATE
ZIP-level market 65270
- Home prices YoY
- -30.6%
- Active inventory
- 134
- Price-to-rent
- 0.7×
Monthly cashflow live
- Estimated rent
- $1,398 medium interval (Pro) →
- Mortgage (P&I)
- −$746
- Tax est. 1.5%
- −$178 /mo · $2,135/yr
- Insurance
- −$59
- HOA
- −$0
- Vacancy / Maint / Mgmt
- −$294
- Net cashflow
- $121
Break-even live
UW: 25.0% down · 7.5% · 30yr · 1.5% tax · 5.0% vac · 8.0% maint · 8.0% mgmt
Financing live
Cash to close
- Down payment
- $35,577
- Closing costs
- $4,269
- Reserves months
- —
- Total cash needed
- —
Loan-product check · same deal, 3 products live
Conventional
25% down · 7.5% · 30yr
- Down + closing
- —
- Monthly P&I
- —
- Monthly cashflow
- —
- DSCR
- —
- Eligible?
- —
Personal DTI + credit; lowest rate.
DSCR
20% down · 8.5% · 30yr
- Down + closing
- —
- Monthly P&I
- —
- Monthly cashflow
- —
- DSCR
- —
- Eligible?
- —
No personal income docs; deal must DSCR.
Hard money
10% down · 12.0% · 12mo
- Down + closing
- —
- Monthly P&I
- —
- Monthly cashflow
- —
- DSCR
- —
- Eligible?
- —
Short-term bridge; refi at stabilization.
Listing history 7 events
-
2026-05-17status Pending 324-char remark
Show marketing remark (326 chars)
This property offers a unique opportunity for redevelopment. The existing structure is beyond renovation, making it ideal for a complete teardown and new construction. Situated on a desirable corner lot, the possibilities are wide open--bring your vision and build something entirely new! Zoned R-2 (single family or duplex).
-
2026-05-17status Pending 326-char remark
Show marketing remark (326 chars)
This property offers a unique opportunity for redevelopment. The existing structure is beyond renovation, making it ideal for a complete teardown and new construction. Situated on a desirable corner lot, the possibilities are wide open--bring your vision and build something entirely new! Zoned R-2 (single family or duplex).
-
2026-04-20$12,000 Active 324-char remark
Show marketing remark (326 chars)
This property offers a unique opportunity for redevelopment. The existing structure is beyond renovation, making it ideal for a complete teardown and new construction. Situated on a desirable corner lot, the possibilities are wide open--bring your vision and build something entirely new! Zoned R-2 (single family or duplex).
-
2026-04-20$12,000 Active 326-char remark
Show marketing remark (326 chars)
This property offers a unique opportunity for redevelopment. The existing structure is beyond renovation, making it ideal for a complete teardown and new construction. Situated on a desirable corner lot, the possibilities are wide open--bring your vision and build something entirely new! Zoned R-2 (single family or duplex).
-
2024-05-09$17,000 Active
-
1988-08-23soldstatus
-
1984-08-28soldstatus $38,500
ⓘ Source: listings_history table (triggers on properties + properties_extension) + one-shot
backfill from property_details.listing_events for pre-trigger history.
Tax reassessment forecast MO · Resets to sale price
- Current annual tax
- $122 · $10/mo
- Projected year-2 tax
- $122 · $10/mo
- Expected delta
- $0/yr ($0/mo · 0.0%)
ⓘ Screening estimate from a state-policy table — verify with the county assessor before closing.
Climate risk First Street
- Flood 1/10 Low FEMA zone X (unshaded) · 0% chance over 30 yrs
- Wildfire 4/10 Moderate
- Heat 4/10 Moderate 7 d/yr ≥106°F today · 17 d/yr by 30 yrs out
- Wind 2/10 Low
- Air quality 1/10 Low 0 unhealthy d/yr today · 0 by 30 yrs out
Nearby sold comps map
Loading sold comps map…
Walkable amenities ~0.75 mi
Loading nearby amenities…
Taxation est. · year 1
- Rental income
- $16,777
- − Mortgage interest
- −$7,971
- − Property taxes
- −$2,135
- − Insurance
- −$712
- − Repairs & maintenance
- −$1,342
- − Management
- −$1,342
- − Depreciation
- −$4,140
- Taxable loss
- −$865
- Est. tax savings @ 24.0%
- +$208
- After-tax cash flow
- $1,660/yr
For passive investors: Depreciation is non-cash, so a rental often shows a tax loss while cash-flowing — sheltering income. Rental losses are passive: they offset passive income freely, and up to $25,000/yr can offset ordinary (W-2) income if you actively participate and your MAGI is under $100k (phasing out to $0 by $150k); unused losses carry forward. On sale, claimed depreciation is recaptured at up to 25%, and gains may owe capital-gains tax (a 1031 exchange can defer both). Figures are a year-1 estimate at your 24.0% rate — not tax advice; consult a CPA.
Schools (NCES district)
- District
- Moberly
- NCES district ID
- 2921100
- Math proficiency
- 30% ▼ -1.00%
- Reading proficiency
- 36% ▼ -3.00%
- Median HH income
- $36,160
- Composite
- 27.35/100
- National rank
- #6984
- State rank
- #246 of 324 in MO
Livability — Moberly
- Score
- 77/100
- State rank
- #32
- US rank
- #3045
Category grades
Schools grade is shown separately in the Schools card above.
Census & demographics
- Census place
- Moberly, MO
- Population (ZIP)
- 16,762
Population outlook (Randolph County) Hauer SSP2
- Today (2025)
- 24,596 people
- By 2030
- 24,213 · -1.6%
- By 2040
- 23,184 · -5.7%
- By 2050
- 22,081 · -10.2%
- By 2075
- 18,994 · -22.8%
- By 2100
- 15,070 · -38.7%
Race, ethnicity, and origin ACS 2023
- Neighborhood character
- Predominantly White (84%)
- Race & ethnicity
- White 84% Black 7% Two or more races 6% Hispanic / Latino 3%
- Common ancestry
- Italian 2% Lithuanian 2% Iranian 1%
- Foreign-born
- 1% · Canada
- Languages at home
- 98% English-only · Spanish 1%
Political lean MEDSL · Randolph
- 2024 margin
- Solid R (+52.2) · D 23.3% · R 75.5% · Other 1.2%
- 2008→2024 swing
- -28.9pp toward R · 2008: -23.3pp · 2024: -52.2pp
- All cycles
- 2024: R+52.2 2020: R+51.5 2016: R+50.9 2012: R+36.6 2008: R+23.3
Not yet ingested
- Civics
- —
Market trends
- HPI YoY
- ▼ -88.15%
- Current HPI
- 199.9743
- Rent YoY
- —
- Metro
- —
- State GDP YoY
- ▲ 1.84%
- F500 in state
- 20
Industry mix (Fortune 500 HQ in MO)
| Industry | F500 HQs | Revenue |
|---|---|---|
| Healthcare | 1 | $163B |
|
||
| Insurance | 1 | $21B |
|
||
| Industrial Technology | 1 | $17B |
|
||
| Retail | 1 | $16B |
|
||
| Industrial Distribution | 1 | $10B |
|
||
| Utilities | 1 | $9B |
|
||
Price history
-68.8% since first listed7 events — show timeline
- 2026-05-17 Pending — CBORMLS
- 2026-05-17 Pending — RCBR
- 2026-04-20 Listed $12,000 CBORMLS
- 2026-04-20 Listed $12,000 RCBR
- 2024-05-09 Listed $17,000 RCBR
- 1988-08-23 Sold (Public Records) — Public Records
- 1984-08-28 Sold (Public Records) $38,500 Public Records
Property tax history
-13.0%/yrLatest (2025): $122 · -69.0% YoY. Source: county tax records.
Cash-flow waterfall
monthlySold comps — $/sqft
last 12 mo · ≤1 miLoading sold comps…