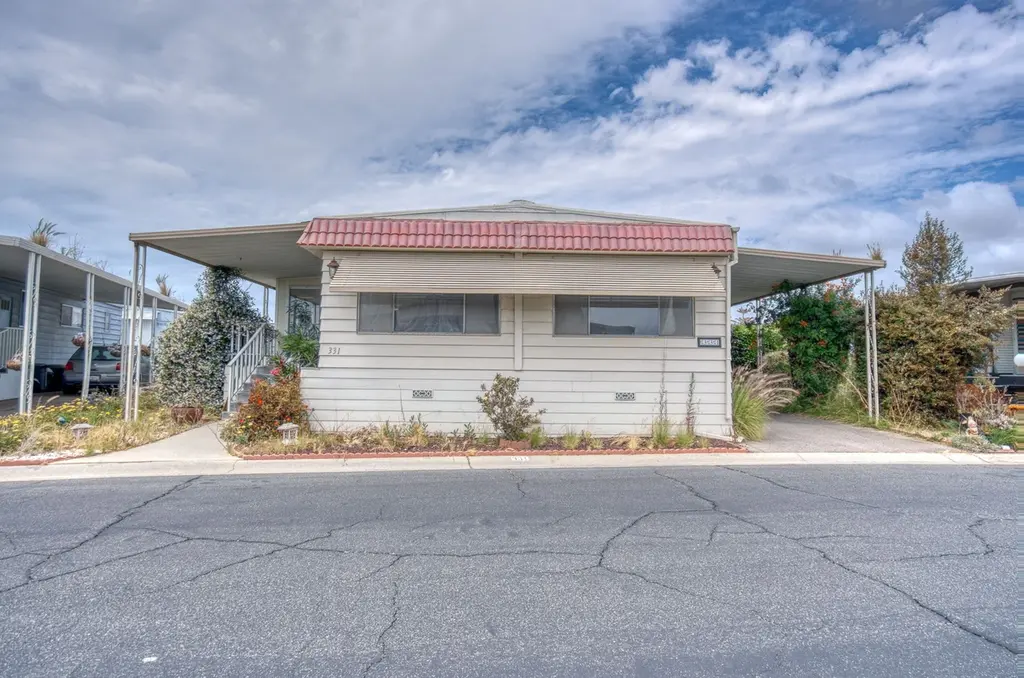
1065 Lomita Blvd #331 · West Carson, CA
Flood risk 1/10 · Minimal
- FEMA flood zone
- X (unshaded)
- Chance of flooding over 30 yrs
- 0.0%
- Est. flood insurance / yr
- $507 – $1,088
Fire risk 1/10 · Minimal
- Est. fire insurance / yr
- $659 – $1,223
Heat risk 3/10 · Minor
- Hot days now (above 87°F)
- 7 days/yr
- Hot days in 30 yrs
- 22 days/yr
Wind risk 1/10 · Minimal
- Chance of severe wind over 30 yrs
- —
Air-quality risk 5/10 · Moderate
- Unhealthy air days now
- 7 days/yr
- Unhealthy air days in 30 yrs
- 7 days/yr
Risk factors via First Street. Map © Google.
Why this score? — see what drove the B- grade
The composite is a weighted blend of 9 inputs, each scored 0–100. Each bar is that input's sub-score; the figure is the points it added to the 100-point composite (weight × sub-score).
- Cash flow +30.0/30.0
- DSCR +10.0/10.0
- 1% rule +8.8/10.0
- ARV discount +6.7/15.0
- Schools +3.6/10.0
- Rent growth +3.3/5.0
- Livability +3.2/5.0
- Condition / age +2.5/5.0
- Appreciation +0.0/10.0
$247,500
🖨 Deal sheet 📄 Offer letter ✓ Due diligence
Listing remarks MLS
EASY TO SHOW VACANT L/B ON SIDE DOOR. NEW CARPET TO BE PUT IN. ENCLOSED BONUS ROOM. OPEN KITCHEN WITH ISLAND. "ON THE CIRCLE" OWC 1ST. NEW CARPET MINIMUM COMMISSION $1000 OR 5% TO S. O. WHICHEVER IS GREATER. USE COE ESCROW
Key facts
- Yard area
- Versatile floor plan
- Center island
Tags
Property features AI
Finance
- Other: Lot categorized as 0-1 unit/acre; Directions: East of Normandie, entrance on Lomita Blvd
- Financial info: Monthly land lease: $1,515
- HOA & community: Senior community; Park name: San Rafael; Manager approval required; Land lease (park) monthly
Exterior
- Parking: Assigned carport parking; Carport attached; 2 parking spaces (2 carport spaces)
- Utilities: Public sewer; District/public water
- Home design: Double-wide mobile home; Single-story
- Construction: Year built per assessor; Mobile/manufactured construction
- Exterior features: Open patio; Community pool; One shed on property; Faces north; Located in an urban community; Mobile home remains on site (Model: Flamingo, 12' x 120')
Interior
- Bathrooms: 2 full bathrooms
- Interior features: Front entry; One-level living; Community spa
- Laundry & utility: Inside laundry; Washer included; Washer hookup
Neighborhood map
What this means for you Summary
Snapshot
- This is a 3-bed/2.0-bath manufactured listed at $248k.
Deal economics
- At list price, monthly cash flow is $988 ($12k/yr) — positive.
- The deal already cash-flows at list — no discount required.
- Meets the 1% rule at list price ($3k rent vs $248k).
- Recommended offer: $244k (1.5% below list) — sets the bar for market timing.
- Cap rate 11.1% vs local median 2.8% in West Carson — top-decile yield for the area; either an underpriced asset or a hidden risk that comps aren't pricing in. Stress-test before assuming the spread holds.
Location & tenants
- Location reads 64/100 on livability (#408 in CA) — a middle-class / working-renter tenant base. Strengths: commute A+, employment A+; Watch: crime D+, amenities F, cost of living F.
- Los Angeles Unified (urban): math 29% / reading 54% proficiency, ranked #223 of 517 in CA (top 43%) — families likely to look elsewhere, expect single-tenant / working-renter base with shorter leases; 67% free/reduced lunch — lower-income household profile, screen leases tightly.
- Market conditions: Rents rising (+3.1%/yr); 63 active listings in the ZIP; 32 comparable units currently listed for rent nearby; rentals at typical pace (median 23d on market — plan ~3-4 weeks tenant-placement turnaround); solid renter incomes; 19,697 units permitted in Los Angeles County in 2024 (9,426 in 5+ unit buildings).
- At $3,416/mo this rent would consume 50% of the median local household income ($82k/yr) (locally 979% of renters already pay >50% of income on rent) — very limited rent-growth headroom before tenants either downsize or default.
Forward outlook
- Local home prices are declining (-3.0%/yr); year-one equity from $2k of loan paydown is wiped out by about $7k of value loss. Plan a longer hold.
- Los Angeles County population projected at +9% by 2050 — modest demand growth; plan on rents tracking national, not racing it.
- At projected returns (-3.0% appreciation + 3.1% rent growth), your $69k cash investment doubles in ~7 years — after that, you're playing with house money.
Negotiation context
- It's been on market 20 days — a 2% lower offer ($244k) is reasonable based on typical stale-listing flexibility.
- 5 sale attempts since 31y ago with the ask held roughly flat each time — persistent listings suggest the price (not the market) is what's stuck; bring a comps-based counter.
- Current owner paid $19k; list at $248k implies a 1220% gain — meaningful room to come down on a strong offer.
Questions for the listing agent
- Built in 1973 — when were the roof, HVAC, electrical panel, plumbing, and water heater last replaced?
- Is there a deadline driving the sale (1031 exchange, divorce, estate, relocation)? That informs how much negotiation room exists.
- Crime grade is D in this area — have there been break-ins, vandalism, or insurance claims at this property in the last 3 years? What carrier currently insures it and at what premium?
- What's the average days-on-market for RENTAL listings here right now (not sales)? A rising rental-DOM trend means longer vacancies and softer asking-rent achievability than the comps imply.
- What's the recent tenant-quality profile in this submarket — average credit score on applications, eviction rate, late-payment / NSF rate, and stable-employment percentage? A property-management company in the area should have these aggregated.
- How much new for-sale + rental construction is in the pipeline within 1–3 miles? Heavy new supply typically softens prices + rents 12–24 months out; constrained supply supports both.
Investment metrics
- 1% rule
- 1.38% ✓
- Cap rate
- 11.08%
- Cash-on-cash
- 17.11%
- DSCR
- 1.76
- GRM
- 6.0
CMA / ARV
- ARV (median comp)
- $243,309
- List price
- $247,500
- Delta
- 1.72%
- Verdict
- FAIR
- Comps
- 20 within 1.0 mi
Show comp detail 12 sales within ~0.75 mi
| Address | Dist | Beds/Ba | Sqft | Sold | Price | $/sf | Match |
|---|---|---|---|---|---|---|---|
| 1065 Lomita Blvd #199 | 0.00mi | 2/2.0 (-1) | 1,550 (+4%) | 1mo | $222,500 | $144 | 87 |
| 1065 Lomita Blvd #7 | 0.00mi | 2/2.0 (-1) | 1,440 (-3%) | 5mo | $295,000 | $205 | 86 |
| 1065 Lomita Blvd #180 | 0.14mi | 3/2.0 | 1,554 (+4%) | 2mo | $375,000 | $241 | 85 |
| 1065 Lomita Blvd #172 | 0.00mi | 2/2.0 (-1) | 1,440 (-3%) | 7mo | $241,000 | $167 | 84 |
| 1065 W Lomita Blvd #153 | 0.14mi | 2/2.0 (-1) | 1,440 (-3%) | 1mo | $266,000 | $185 | 83 |
| 1065 Lomita Blvd #248 | 0.15mi | 2/2.0 (-1) | 1,536 (+3%) | 3mo | $250,000 | $163 | 80 |
| 1065 Lomita Blvd #147 | 0.00mi | 2/2.0 (-1) | 1,344 (-10%) | 0mo | $160,000 | $119 | 78 |
| 1065 Lomita Blvd #449 | 0.21mi | 2/2.0 (-1) | 1,440 (-3%) | 2mo | $337,000 | $234 | 78 |
| 1065 Lomita Blvd #391 | 0.21mi | 2/2.0 (-1) | 1,440 (-3%) | 4mo | $305,000 | $212 | 77 |
| 1065 Lomita Blvd #455 | 0.00mi | 3/2.0 | 1,680 (+13%) | 8mo | $255,000 | $152 | 72 |
| 1065 Lomita Blvd #115 | 0.00mi | 3/2.0 | 1,700 (+14%) | 9mo | $315,000 | $185 | 69 |
| 760 Lomita Blvd #116 | 0.57mi | 3/2.0 | 1,620 (+9%) | 8mo | $295,000 | $182 | 51 |
Match score weights: distance 35% · size 25% · config 20% · recency 20%. Top-matched comps best support the ARV.
Projected returns pro-forma
-3.0% appreciation · 3.13% rent growth · sell at horizon
- IRR
- 8.6%
- Equity multiple
- 1.34×
- Total profit
- $23,323
- Equity at exit
- $36,903
- IRR
- 17.9%
- Equity multiple
- 2.49×
- Total profit
- $103,392
- Equity at exit
- $21,399
Cash invested: $69,300 (down + closing). Projections, not guarantees.
Landlord ↔ Tenant lean methodology
- Overall (STATE)
- 18 Strongly Tenant-Friendly
- State California
- 18 Strongly Tenant-Friendly · D+13
- County
- — inherits STATE
- City
- — inherits STATE
ZIP-level market 90710
- Rents YoY
- 3.1%
- Active inventory
- 63
- Price-to-rent
- 6.0×
Monthly cashflow live
- Estimated rent
- $3,416 high interval (Pro) →
- Mortgage (P&I)
- −$1,298
- Tax est. 1.5%
- −$309 /mo · $3,712/yr
- Insurance
- −$103
- HOA
- −$0
- Vacancy / Maint / Mgmt
- −$717
- Net cashflow
- $988
Break-even live
UW: 25.0% down · 7.5% · 30yr · 1.5% tax · 5.0% vac · 8.0% maint · 8.0% mgmt
Financing live
Cash to close
- Down payment
- $61,875
- Closing costs
- $7,425
- Reserves months
- —
- Total cash needed
- —
Loan-product check · same deal, 3 products live
Conventional
25% down · 7.5% · 30yr
- Down + closing
- —
- Monthly P&I
- —
- Monthly cashflow
- —
- DSCR
- —
- Eligible?
- —
Personal DTI + credit; lowest rate.
DSCR
20% down · 8.5% · 30yr
- Down + closing
- —
- Monthly P&I
- —
- Monthly cashflow
- —
- DSCR
- —
- Eligible?
- —
No personal income docs; deal must DSCR.
Hard money
10% down · 12.0% · 12mo
- Down + closing
- —
- Monthly P&I
- —
- Monthly cashflow
- —
- DSCR
- —
- Eligible?
- —
Short-term bridge; refi at stabilization.
Rent comps 32 comps
| Address | Beds | Baths | Sqft | Rent | $/sqft | DOM | Units | Dist |
|---|---|---|---|---|---|---|---|---|
| 1115 252nd St Unit 6 Harbor City, CA | 2.0 | 1.0 | 1250 | $1,999 | $1.60 | 44d | 1 | 0.39mi |
| 1309 Hunt Ter Harbor City, CA | 4.0 | 2.5 | 1685 | $4,500 | $2.67 | 44d | 1 | 0.40mi |
| 1008 Harbor Heights Dr Unit B Harbor City, CA | 3.0 | 2.5 | 1434 | $3,295 | $2.30 | 15d | 1 | 0.55mi |
| 1435 Lomita Blvd #105 Harbor City, CA | 3.0 | 2.0 | 1260 | $3,250 | $2.58 | 44d | 1 | 0.58mi |
| 24223 Ambassador Pl Harbor City, CA | 3.0 | 2.0 | 1208 | $3,800 | $3.15 | 5d | 1 | 0.67mi |
| 256 W Lomita Blvd Wilmington, CA | 3.0 | 1.0 | 1000 | $1,800 | $1.80 | 21d | 1 | 0.82mi |
| 25595 Pine Creek Ln Wilmington, CA | 2.0 | 1.5 | 1170 | $3,300 | $2.82 | 12d | 1 | 0.83mi |
| 1500 W Pacific Coast Hwy Wilmington, CA | 2.0 | 2.0 | 971 | $3,256 | $3.35 | 2d | 2 | 0.91mi |
| 1732 251st St Lomita, CA | 3.0 | 1.0 | 1200 | $4,000 | $3.33 | 44d | 1 | 0.96mi |
| 817 W 232nd St Unit G Torrance, CA | 2.0 | 1.5 | 900 | $3,250 | $3.61 | 18d | 1 | 1.02mi |
| 25122 Ebony Ln Lomita, CA | 2.0 | 2.0 | 1716 | $2,955 | $1.72 | 21d | 1 | 1.03mi |
| 23502 Nicolle Ave Carson, CA | 4.0 | 2.0 | 1700 | $7,000 | $4.12 | 1d | 1 | 1.03mi |
| 1311 Sepulveda Blvd Torrance, CA | 2.0 | 2.0 | 1050 | $3,650 | $3.48 | 21d | 1 | 1.10mi |
| 1444 260th St #22 Harbor City, CA | 2.0 | 2.0 | 935 | $2,950 | $3.16 | 8d | 1 | 1.15mi |
| 1530 260th St Apt 6 Harbor City, CA | 3.0 | 2.0 | 1150 | $3,295 | $2.87 | 21d | 1 | 1.17mi |
| 1918 252nd St Lomita, CA | 3.0 | 2.0 | 1488 | $3,900 | $2.62 | 44d | 1 | 1.20mi |
| 22919 Mariposa Ave Torrance, CA | 2.0–3.0 | 2.5–4.0 | 1480 | $4,000 | $2.70 | 44d | 2 | 1.20mi |
| 26127 Frampton Ave Unit F Harbor City, CA | 3.0 | 2.5 | 1161 | $3,200 | $2.76 | 44d | 1 | 1.20mi |
| 1676 259th St Harbor City, CA | 2.0 | 1.0 | 1250 | $2,795 | $2.24 | 16d | 1 | 1.20mi |
| 24638 Eshelman Ave Unit 1/4 Lomita, CA | 2.0 | 1.0 | 950 | $2,950 | $3.11 | 44d | 1 | 1.21mi |
| 25018 Eshelman Ave Unit 9 Lomita, CA | 2.0 | 2.5 | 1400 | $3,295 | $2.35 | 25d | 1 | 1.21mi |
| 25018 Eshelman Ave Lomita, CA | 2.0 | 2.5 | 1400 | $3,295 | $2.35 | 44d | 1 | 1.22mi |
| 24636 Eshelman Ave Lomita, CA | 2.0 | 1.0 | 950 | $2,950 | $3.11 | 5d | 1 | 1.22mi |
| 22919 Mariposa Ave #202 Torrance, CA | 3.0 | 4.0 | 1780 | $4,000 | $2.25 | 25d | 1 | 1.23mi |
| 1316 1/2 W Anaheim St Harbor City, CA | 2.0 | 1.0 | 900 | $2,100 | $2.33 | 25d | 1 | 1.27mi |
| 22716 Meyler St Torrance, CA | 3.0 | 3.0 | 1650 | $4,700 | $2.85 | 22d | 1 | 1.32mi |
| 1724 260th St Lomita, CA | 2.0 | 2.0 | 1000 | $3,350 | $3.35 | 8d | 1 | 1.34mi |
| 25822 Walnut St Lomita, CA | 2.0 | 1.0 | 900 | $2,350 | $2.61 | 44d | 1 | 1.37mi |
| 24139 Ravenna Ave Carson, CA | 4.0 | 2.0 | 1356 | $4,500 | $3.32 | 19d | 1 | 1.40mi |
| 25021 Oak St Lomita, CA | 3.0 | 2.0 | 1281 | $3,995 | $3.12 | 8d | 1 | 1.43mi |
| 25326 Oak St Unit 1 Lomita, CA | 3.0 | 2.0 | 1300 | $3,650 | $2.81 | 44d | 1 | 1.46mi |
| 1567 W 228th St Torrance, CA | 2.0 | 2.0 | 990 | $3,200 | $3.23 | 44d | 1 | 1.47mi |
Listing history 19 events
-
2026-06-18days on market $247,500 Active 20 DOM
-
2026-06-17days on market $247,500 Active 19 DOM
-
2026-06-16days on market $247,500 Active 18 DOM
-
2026-06-15days on market $247,500 Active 17 DOM
-
2026-06-13days on market $247,500 Active 15 DOM
-
2026-06-09days on market $247,500 Active 11 DOM
-
2026-06-08days on market $247,500 Active 10 DOM
-
2026-06-07days on market $247,500 Active 9 DOM
-
2026-06-04days on market $247,500 Active 6 DOM
-
2026-06-03days on market $247,500 Active 5 DOM
-
2026-06-02days on market $247,500 Active 4 DOM
-
2026-06-01days on market $247,500 Active 3 DOM
-
2026-05-31days on market $247,500 Active 2 DOM
-
2025-12-04status Active
-
2025-12-03historical
-
2025-12-02status Active
-
2025-04-30$248,500 Active
-
1995-08-30soldstatus $18,750 232-char remark
Show marketing remark (232 chars)
EASY TO SHOW VACANT L/B ON SIDE DOOR. NEW CARPET TO BE PUT IN. ENCLOSED BONUS ROOM. OPEN KITCHEN WITH ISLAND. "ON THE CIRCLE" OWC 1ST. NEW CARPET MINIMUM COMMISSION $1000 OR 5% TO S. O. WHICHEVER IS GREATER. USE COE ESCROW
-
1995-03-20$23,850 232-char remark
Show marketing remark (232 chars)
EASY TO SHOW VACANT L/B ON SIDE DOOR. NEW CARPET TO BE PUT IN. ENCLOSED BONUS ROOM. OPEN KITCHEN WITH ISLAND. "ON THE CIRCLE" OWC 1ST. NEW CARPET MINIMUM COMMISSION $1000 OR 5% TO S. O. WHICHEVER IS GREATER. USE COE ESCROW
ⓘ Source: listings_history table (triggers on properties + properties_extension) + one-shot
backfill from property_details.listing_events for pre-trigger history.
Climate risk First Street
- Flood 1/10 Low FEMA zone X (unshaded) · 0% chance over 30 yrs
- Wildfire 1/10 Low
- Heat 3/10 Moderate 7 d/yr ≥87°F today · 22 d/yr by 30 yrs out
- Wind 1/10 Low
- Air quality 5/10 Major 7 unhealthy d/yr today · 7 by 30 yrs out
Nearby sold comps map
Loading sold comps map…
Walkable amenities ~0.75 mi
Loading nearby amenities…
Taxation est. · year 1
- Rental income
- $40,989
- − Mortgage interest
- −$13,864
- − Property taxes
- −$3,712
- − Insurance
- −$1,238
- − Repairs & maintenance
- −$3,279
- − Management
- −$3,279
- − Depreciation
- −$7,200
- Taxable income
- $8,417
- Est. tax owed @ 24.0%
- −$2,020
- After-tax cash flow
- $9,837/yr
For passive investors: Depreciation is non-cash, so a rental often shows a tax loss while cash-flowing — sheltering income. Rental losses are passive: they offset passive income freely, and up to $25,000/yr can offset ordinary (W-2) income if you actively participate and your MAGI is under $100k (phasing out to $0 by $150k); unused losses carry forward. On sale, claimed depreciation is recaptured at up to 25%, and gains may owe capital-gains tax (a 1031 exchange can defer both). Figures are a year-1 estimate at your 24.0% rate — not tax advice; consult a CPA.
Schools (NCES district)
- District
- Los Angeles Unified
- NCES district ID
- 0622710
- Math proficiency
- 29% ▼ -4.00%
- Reading proficiency
- 54% ▲ 10.00%
- Median HH income
- $50,403
- Composite
- 35.67/100
- National rank
- #4875
- State rank
- #223 of 517 in CA
Livability — West Carson
- Score
- 64/100
- State rank
- #408
- US rank
- #13927
Category grades
Schools grade is shown separately in the Schools card above.
Census & demographics
- Census place
- West Carson, CA
- County
- Los Angeles County · 9,444,647 people
- City population
- 18,467
- Metro
- Los Angeles-Long Beach-Anaheim, CA
- Population (ZIP)
- 26,761
- Household income
- $82,478
- Rent vs Own
- Severe rent burden
- 979.0
Population outlook (Los Angeles County) Hauer SSP2
- Today (2025)
- 10,940,515 people
- By 2030
- 11,256,481 · +2.9%
- By 2040
- 11,729,929 · +7.2%
- By 2050
- 11,948,407 · +9.2%
- By 2075
- 11,818,114 · +8.0%
- By 2100
- 10,842,928 · -0.9%
Race, ethnicity, and origin ACS 2023
- Neighborhood character
- Diverse neighborhood (Simpson 0.69)
- Race & ethnicity
- Hispanic / Latino 48% Two or more races 21% Asian 20% White 16% Black 11%
- Hispanic origin (detail)
- Mexican 35%
- Common ancestry
- Ukrainian 1% Lithuanian 1% Slovak 1%
- Foreign-born
- 35% · Canada, South Korea, China
- Languages at home
- 42% English-only · Spanish 38% Korean 6% Tagalog/Filipino 4%
Political lean MEDSL · Los Angeles
- 2024 margin
- Solid D (+32.9) · D 64.8% · R 31.9% · Other 3.3%
- 2008→2024 swing
- -7.4pp toward R · 2008: 40.4pp · 2024: 32.9pp
- All cycles
- 2024: D+32.9 2020: D+44.2 2016: D+48.0 2012: D+40.0 2008: D+40.4
Not yet ingested
- Civics
- —
Market trends
- HPI YoY
- ▼ -636.52%
- Current HPI
- 363.6265
- Rent YoY
- ▲ 3.13%
- Metro
- Los Angeles-Long Beach-Anaheim, CA
- State GDP YoY
- ▲ 3.21%
- F500 in state
- 116
Industry mix (Fortune 500 HQ in CA)
| Industry | F500 HQs | Revenue |
|---|---|---|
| Technology | 27 | $1,492B |
|
||
| Financial Services | 3 | $174B |
|
||
| Retail | 3 | $44B |
|
||
| Insurance | 3 | $26B |
|
||
| Media / Entertainment | 2 | $115B |
|
||
| Pharmaceuticals / Biotech | 2 | $62B |
|
||
Price history
+937.7% since first listed7 events — show timeline
- 2026-05-29 Listed $247,500 CRMLS
- 2025-12-04 Relisted — CRMLS
- 2025-12-03 Listing Removed — CRMLS
- 2025-12-02 Relisted — CRMLS
- 2025-04-30 Listed $248,500 CRMLS
- 1995-08-30 Sold (MLS) $18,750 CRMLS
- 1995-03-20 Listed $23,850 CRMLS
Property tax history
+7.5%/yrLatest (2025): $385 · +7.5% YoY. Source: county tax records.
Cash-flow waterfall
monthlySold comps — $/sqft
last 12 mo · ≤1 miLoading sold comps…