2121 El Paseo St #1200 · Houston, TX
Flood risk 6/10 · Moderate
- FEMA flood zone
- X (unshaded)
- Chance of flooding over 30 yrs
- 0.71%
- Est. flood insurance / yr
- $507 – $1,088
Fire risk 1/10 · Minimal
- Est. fire insurance / yr
- $1,222 – $2,270
Heat risk 9/10 · Severe
- Hot days now (above 109°F)
- 7 days/yr
- Hot days in 30 yrs
- 23 days/yr
Wind risk 9/10 · Severe
- Chance of severe wind over 30 yrs
- 99.0%
Air-quality risk 2/10 · Minimal
- Unhealthy air days now
- 2 days/yr
- Unhealthy air days in 30 yrs
- 2 days/yr
Risk factors via First Street. Map © Google.
Why this score? — see what drove the D grade
The composite is a weighted blend of 9 inputs, each scored 0–100. Each bar is that input's sub-score; the figure is the points it added to the 100-point composite (weight × sub-score).
- ARV discount +15.0/15.0
- 1% rule +8.1/10.0
- Cash flow +4.3/30.0
- Livability +3.7/5.0
- Appreciation +2.7/10.0
- Schools +2.7/10.0
- Condition / age +2.5/5.0
- Rent growth +1.8/5.0
- DSCR +0.0/10.0
$93,000
🖨 Deal sheet 📄 Offer letter ✓ Due diligence
Listing remarks MLS
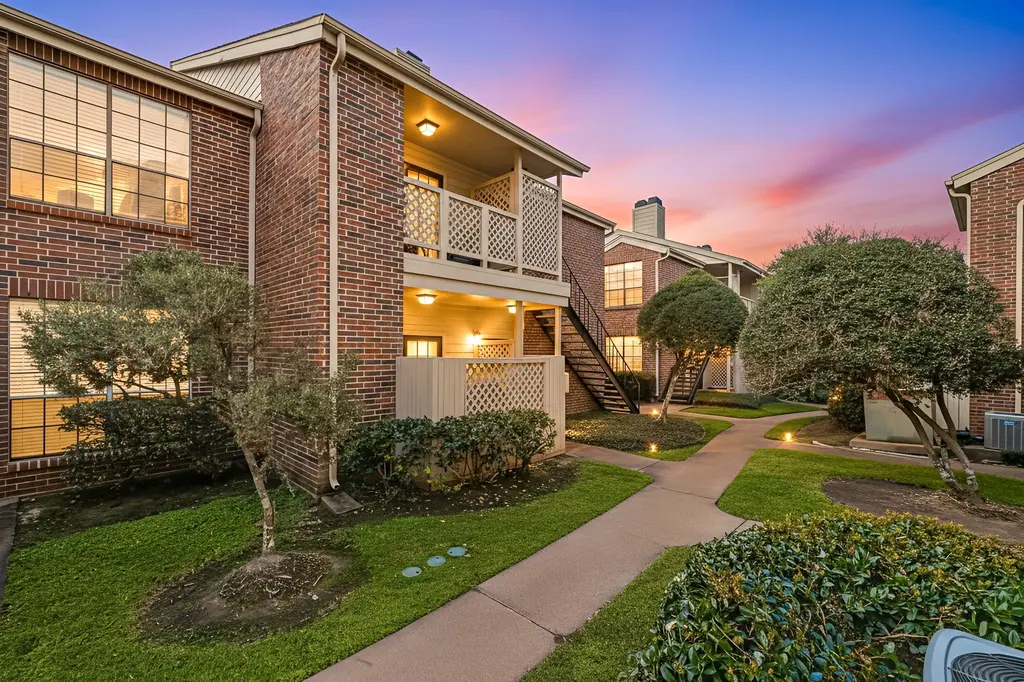
Stylish second-floor condo at 2121 El Paseo St #1200 offers 804 sq ft of airy living with 2 bedrooms and 1 bath. Dramatic vaulted ceilings and an open layout create a bright, welcoming feel, anchored by a cozy fireplace and French doors that lead to a spacious private balcony. Enjoy the convenience of in-unit laundry and comfortable, well-proportioned rooms. Residents have access to a sparkling community pool in a secure gated community with assigned parking. This prime location is convenient to the Houston Medical Center, NRG Center, Houston Museum District, and Hermann Park—ideal for work, play, study and everything in between.
Key facts
- Community pool
- Private balcony
- In-unit laundry
Tags
Neighborhood map
What this means for you Summary
Snapshot
- This is a 2-bed/1.0-bath condo listed at $93k.
Deal economics
- At list price, monthly cash flow is $-248 ($-3k/yr) — negative.
- To cash-flow at today's rent, offer at most $52k (43.6% below list).
- Meets the 1% rule at list price ($1k rent vs $93k).
- Recommended offer: $52k (43.6% below list) — sets the bar for cash-flow.
Location & tenants
- Location reads 74/100 on livability (#184 in TX, #4,771 nationally) — a middle-class / working-renter tenant base. Strengths: amenities A+, cost of living A+, housing A+; Watch: schools D, crime F.
- Houston ISD (urban): math 27% / reading 35% proficiency, ranked #593 of 826 in TX (top 72%) — families likely to look elsewhere, expect single-tenant / working-renter base with shorter leases; 71% free/reduced lunch — lower-income household profile, screen leases tightly.
- Market conditions: Rents soft (-2.8%/yr); 268 active listings in the ZIP; 40 comparable units currently listed for rent nearby; rentals leasing fast (median 13d on market — plan ~1-2 weeks tenant-placement turnaround); 29,883 units permitted in Harris County in 2024 (8,621 in 5+ unit buildings).
Forward outlook
- Local home prices are declining (-3.0%/yr); year-one equity from $643 of loan paydown is wiped out by about $3k of value loss. Plan a longer hold.
- Harris County population projected at +47% by 2050 — long-run rental-demand tailwind backs the buy-and-hold thesis.
Negotiation context
- It's been on market 105 days — a 9% lower offer ($85k) is reasonable based on typical stale-listing flexibility.
Risks & watch-outs
- Watch-outs: property tax is 2.8% of price; HOA is 38% of rent.
- Climate carrying-cost: major flood risk; severe wind risk, 99% chance of damaging wind over 30y; extreme-heat days projected 7→23/yr by 2055 (HVAC capex compounding) — expect insurance premiums to compound above CPI over the hold.
Questions for the listing agent
- What do current leases actually rent for vs. the listed asking? Can we see a recent rent roll and the last 12 months of T-12 income?
- It's been on market 105 days. Have you received any prior offers? Is the seller open to a 44% concession, seller financing, or rate buy-down credit?
- Property tax is high relative to price — has the assessment been appealed recently, and will the sale trigger a re-assessment?
- What does the HOA fee cover, when was the last increase, and are there any pending special assessments or reserve-fund shortfalls?
- Any open or pending special assessments — roof, HVAC, plumbing, elevator, façade? What's the per-unit balance and payoff schedule, and is the seller paying it off at close or rolling it to the buyer?
- Why hasn't it sold? Are there any deal-killer items the seller is aware of (foundation, flood, title, zoning, code violations)?
- Is there a deadline driving the sale (1031 exchange, divorce, estate, relocation)? That informs how much negotiation room exists.
- Schools are D-rated, which usually means shorter tenancies and higher turnover. Who's the typical renter profile here, and what's been the actual vacancy rate?
- Crime grade is F in this area — have there been break-ins, vandalism, or insurance claims at this property in the last 3 years? What carrier currently insures it and at what premium?
- The area grade is low — what's the realistic commute time and amenity access for the typical tenant pool here? Any planned neighborhood developments (good or bad) we should know about?
- What's the average days-on-market for RENTAL listings here right now (not sales)? A rising rental-DOM trend means longer vacancies and softer asking-rent achievability than the comps imply.
- What's the recent tenant-quality profile in this submarket — average credit score on applications, eviction rate, late-payment / NSF rate, and stable-employment percentage? A property-management company in the area should have these aggregated.
- How much new apartment / multifamily construction is in the pipeline within 1–3 miles? Heavy new supply (>2% of stock underway) typically softens rents 12–24 months out; light construction supports rent growth.
Investment metrics
- 1% rule
- 1.31% ✓
- Cap rate
- 3.09%
- Cash-on-cash
- -11.44%
- DSCR
- 0.49
- GRM
- 6.3
CMA / ARV
- ARV (median comp)
- $119,971
- List price
- $93,000
- Delta
- -22.48%
- Verdict
- UNDERPRICED
- Comps
- 20 within 1.0 mi
Projected returns pro-forma
-3.0% appreciation · 0.0% rent growth · sell at horizon
- IRR
- -44.9%
- Equity multiple
- -0.31×
- Total profit
- $-34,095
- Equity at exit
- $13,867
- IRR
- —
- Equity multiple
- -1.40×
- Total profit
- $-62,383
- Equity at exit
- $8,041
Cash invested: $26,040 (down + closing). Projections, not guarantees.
Landlord ↔ Tenant lean methodology
- Overall (STATE)
- 87 Strongly Landlord-Friendly
- State Texas
- 87 Strongly Landlord-Friendly · R+5
- County
- — inherits STATE
- City
- — inherits STATE
ZIP-level market 77054
- Home prices YoY
- -2.6%
- Rents YoY
- -2.8%
- Active inventory
- 268
- Price-to-rent
- 6.3×
Monthly cashflow live
- Estimated rent
- $1,221 high interval (Pro) →
- Mortgage (P&I)
- −$488
- Tax from tax record
- −$218 /mo · $2,621/yr
- Insurance
- −$39
- HOA
- −$468
- Vacancy / Maint / Mgmt
- −$256
- Net cashflow
- $-248
Break-even live
UW: 25.0% down · 7.5% · 30yr · 1.5% tax · 5.0% vac · 8.0% maint · 8.0% mgmt
Financing live
Cash to close
- Down payment
- $23,250
- Closing costs
- $2,790
- Reserves months
- —
- Total cash needed
- —
Loan-product check · same deal, 3 products live
Conventional
25% down · 7.5% · 30yr
- Down + closing
- —
- Monthly P&I
- —
- Monthly cashflow
- —
- DSCR
- —
- Eligible?
- —
Personal DTI + credit; lowest rate.
DSCR
20% down · 8.5% · 30yr
- Down + closing
- —
- Monthly P&I
- —
- Monthly cashflow
- —
- DSCR
- —
- Eligible?
- —
No personal income docs; deal must DSCR.
Hard money
10% down · 12.0% · 12mo
- Down + closing
- —
- Monthly P&I
- —
- Monthly cashflow
- —
- DSCR
- —
- Eligible?
- —
Short-term bridge; refi at stabilization.
Rent comps 40 comps
| Address | Beds | Baths | Sqft | Rent | $/sqft | DOM | Units | Dist |
|---|---|---|---|---|---|---|---|---|
| 2121 El Paseo St Houston, TX | 2.0 | 1.0 | 804 | $1,275 | $1.59 | 43d | 3 | 0.08mi |
| 7901 Cambridge St Houston, TX | 1.0 | 1.0 | 529 | $1,150 | $2.17 | 43d | 6 | 0.13mi |
| 2121 Hepburn St Houston, TX | 1.0–2.0 | 1.0–2.0 | 1100 | $1,400 | $1.27 | 15d | 6 | 0.25mi |
| 2800 Corder St Houston, TX | 2.0 | 1.0 | 1102 | $1,475 | $1.34 | 43d | 1 | 0.30mi |
| 7206 Almeda Rd Houston, TX | 2.0 | 2.0 | 1123 | $1,925 | $1.71 | 43d | 1 | 0.31mi |
| 7200 Almeda Rd Houston, TX | 1.0–2.0 | 1.0–2.0 | 953 | $1,746 | $1.83 | 2d | 11 | 0.33mi |
| 8401 Almeda Rd Houston, TX | 1.0 | 1.0 | 694 | $1,265 | $1.82 | 24d | 1 | 0.34mi |
| 8401 Almeda Rd Unit SATMC3 Houston, TX | 2.0 | 2.0 | 1027 | $1,585 | $1.54 | 24d | 1 | 0.34mi |
| 8401 Almeda Rd Houston, TX | 2.0 | 2.0 | 1027 | $1,585 | $1.54 | 21d | 1 | 0.34mi |
| 8282 Cambridge St Unit 2162 Houston, TX | 2.0 | 2.0 | 900 | $1,080 | $1.20 | 7d | 1 | 0.39mi |
| 8282 Cambridge St Unit 8339 Houston, TX | 2.0 | 2.0 | 900 | $1,125 | $1.25 | 13d | 1 | 0.39mi |
| 8282 Cambridge St Unit 8303 Houston, TX | 1.0 | 1.0 | 602 | $815 | $1.35 | 13d | 1 | 0.39mi |
| 8282 Cambridge St Unit 8356 Houston, TX | 1.0 | 1.0 | 602 | $772 | $1.28 | 2d | 1 | 0.39mi |
| 8282 Cambridge St Unit 1162 Houston, TX | 1.0 | 1.0 | 602 | $775 | $1.29 | 7d | 1 | 0.39mi |
| 8282 Cambridge St Unit 8333 Houston, TX | 1.0 | 1.0 | 602 | $764 | $1.27 | 12d | 1 | 0.39mi |
| 8282 Cambridge St Houston, TX | 1.0 | 1.0 | 602 | $810 | $1.35 | 13d | 1 | 0.42mi |
| 1800 El Paseo St Houston, TX | 1.0–2.0 | 1.0–2.0 | 750 | $1,202 | $1.60 | 1d | 39 | 0.42mi |
| 2117 Holly Hall St Houston, TX | 1.0 | 1.0 | 654 | $1,000 | $1.53 | 24d | 1 | 0.44mi |
| 7100 Almeda Rd Unit 7157 Houston, TX | 2.0 | 2.0 | 930 | $1,283 | $1.38 | 10d | 1 | 0.47mi |
| 7100 Almeda Rd Apt 422 Houston, TX | 2.0 | 2.0 | 930 | $1,259 | $1.35 | 7d | 1 | 0.47mi |
| 7100 Almeda Rd Unit 7121 Houston, TX | 1.0 | 1.0 | 575 | $781 | $1.36 | 2d | 1 | 0.47mi |
| 7100 Almeda Rd Unit 2162 Houston, TX | 2.0 | 2.0 | 930 | $1,259 | $1.35 | 5d | 1 | 0.47mi |
| 7100 Almeda Rd Unit 2174 Houston, TX | 2.0 | 2.0 | 930 | $1,251 | $1.35 | 2d | 1 | 0.47mi |
| 7100 Almeda Rd Unit 1162 Houston, TX | 1.0 | 1.0 | 575 | $784 | $1.36 | 7d | 1 | 0.47mi |
| 7100 Almeda Rd Unit 7121 Houston, TX | 1.0 | 1.0 | 575 | $859 | $1.49 | 14d | 1 | 0.47mi |
| 2256 Holly Hall St Houston, TX | 1.0 | 1.0 | 706 | $947 | $1.34 | 17d | 1 | 0.47mi |
| 2256 Holly Hall St Houston, TX | 2.0 | 2.0 | 979 | $1,278 | $1.31 | 24d | 1 | 0.47mi |
| 2256 Holly Hall St Houston, TX | 1.0 | 1.0 | 706 | $947 | $1.34 | 21d | 1 | 0.47mi |
| 7100 Almeda Rd Houston, TX | 1.0 | 1.0 | 575 | $773 | $1.34 | 12d | 1 | 0.47mi |
| 7100 Almeda Rd Houston, TX | 2.0 | 2.0 | 930 | $1,382 | $1.49 | 43d | 1 | 0.47mi |
| 7100 Almeda Rd Unit 1047 Houston, TX | 1.0 | 1.0 | 575 | $824 | $1.43 | 10d | 1 | 0.48mi |
| 2750 Holly Hall St Houston, TX | 1.0–2.0 | 1.0–2.0 | 704 | $2,000 | $2.84 | 1d | 12 | 0.50mi |
| 2750 Holly Hall St Houston, TX | 1.0–2.0 | 1.0–2.0 | 796 | $2,000 | $2.51 | 43d | 10 | 0.50mi |
| 2909 Dupree St Houston, TX | 2.0 | 2.0 | 1027 | $1,495 | $1.46 | 43d | 1 | 0.50mi |
| 2111 Holly Hall St Houston, TX | 1.0–3.0 | 1.0–3.0 | 974 | $1,124 | $1.15 | 2d | 30 | 0.51mi |
| 8300 El Mundo St Unit 424 Houston, TX | 2.0 | 2.0 | 970 | $1,265 | $1.30 | 5d | 1 | 0.51mi |
| 8300 El Mundo St Unit 1162 Houston, TX | 1.0 | 1.0 | 770 | $959 | $1.25 | 5d | 1 | 0.51mi |
| 8300 El Mundo St Unit 8357 Houston, TX | 2.0 | 2.0 | 970 | $1,289 | $1.33 | 10d | 1 | 0.51mi |
| 8300 El Mundo St Unit 2112 Houston, TX | 2.0 | 2.0 | 970 | $1,257 | $1.30 | 2d | 1 | 0.51mi |
| 8300 El Mundo St Apt 324 Houston, TX | 1.0 | 1.0 | 770 | $959 | $1.25 | 7d | 1 | 0.51mi |
HOA detail condo
- Monthly dues
- $468 · $5,616/yr
- Likely covers
- poolsecurityparking
- Assessments
- None detected in remarks — confirm with the listing agent.
Listing history 16 events
-
2026-06-18days on market $93,000 Active 105 DOM
-
2026-06-17days on market $93,000 Active 104 DOM
-
2026-06-16days on market $93,000 Active 103 DOM
-
2026-06-15days on market $93,000 Active 102 DOM
-
2026-06-13days on market $93,000 Active 100 DOM
-
2026-06-09days on market $93,000 Active 96 DOM
-
2026-06-08days on market $93,000 Active 95 DOM
-
2026-06-07days on market $93,000 Active 94 DOM
-
2026-06-04pricedays on market $93,000 Active 91 DOM
-
2026-06-03days on market $110,000 Active 90 DOM
-
2026-06-02days on market $110,000 Active 89 DOM
-
2026-06-01days on market $110,000 Active 88 DOM
-
2026-05-31days on market $110,000 Active 87 DOM
-
2026-04-20price $110,000 644-char remark
Show marketing remark (644 chars)
Stylish second-floor condo at 2121 El Paseo St #1200 offers 804 sq ft of airy living with 2 bedrooms and 1 bath. Dramatic vaulted ceilings and an open layout create a bright, welcoming feel, anchored by a cozy fireplace and French doors that lead to a spacious private balcony. Enjoy the convenience of in-unit laundry and comfortable, well-proportioned rooms. Residents have access to a sparkling community pool in a secure gated community with assigned parking. This prime location is convenient to the Houston Medical Center, NRG Center, Houston Museum District, and Hermann Park—ideal for work, play, study and everything in between.
-
2026-03-05$115,000 Active 644-char remark
Show marketing remark (644 chars)
Stylish second-floor condo at 2121 El Paseo St #1200 offers 804 sq ft of airy living with 2 bedrooms and 1 bath. Dramatic vaulted ceilings and an open layout create a bright, welcoming feel, anchored by a cozy fireplace and French doors that lead to a spacious private balcony. Enjoy the convenience of in-unit laundry and comfortable, well-proportioned rooms. Residents have access to a sparkling community pool in a secure gated community with assigned parking. This prime location is convenient to the Houston Medical Center, NRG Center, Houston Museum District, and Hermann Park—ideal for work, play, study and everything in between.
-
2008-08-26soldstatus
ⓘ Source: listings_history table (triggers on properties + properties_extension) + one-shot
backfill from property_details.listing_events for pre-trigger history.
Tax reassessment forecast TX · Resets to sale price
- Current annual tax
- $2,621 · $218/mo
- Projected year-2 tax
- $2,621 · $218/mo
- Expected delta
- $0/yr ($0/mo · 0.0%)
ⓘ Screening estimate from a state-policy table — verify with the county assessor before closing.
Climate risk First Street
- Flood 6/10 Major FEMA zone X (unshaded) · 71% chance over 30 yrs
- Wildfire 1/10 Low
- Heat 9/10 Extreme 7 d/yr ≥109°F today · 23 d/yr by 30 yrs out
- Wind 9/10 Extreme 99% chance of damaging wind over 30 yrs
- Air quality 2/10 Low 2 unhealthy d/yr today · 2 by 30 yrs out
Nearby sold comps map
Loading sold comps map…
Walkable amenities ~0.75 mi
Loading nearby amenities…
Taxation est. · year 1
- Rental income
- $14,651
- − Mortgage interest
- −$5,209
- − Property taxes
- −$2,621
- − Insurance
- −$465
- − Repairs & maintenance
- −$1,172
- − Management
- −$1,172
- − HOA
- −$5,616
- − Depreciation
- −$2,705
- Taxable loss
- −$4,310
- Est. tax savings @ 24.0%
- +$1,034
- After-tax cash flow
- $-1,945/yr
For passive investors: Depreciation is non-cash, so a rental often shows a tax loss while cash-flowing — sheltering income. Rental losses are passive: they offset passive income freely, and up to $25,000/yr can offset ordinary (W-2) income if you actively participate and your MAGI is under $100k (phasing out to $0 by $150k); unused losses carry forward. On sale, claimed depreciation is recaptured at up to 25%, and gains may owe capital-gains tax (a 1031 exchange can defer both). Figures are a year-1 estimate at your 24.0% rate — not tax advice; consult a CPA.
Schools (NCES district)
- District
- Houston ISD
- NCES district ID
- 4823640
- Math proficiency
- 27% ▼ -18.00%
- Reading proficiency
- 35% ▼ -6.00%
- Median HH income
- $46,054
- Composite
- 26.63/100
- National rank
- #7173
- State rank
- #593 of 826 in TX
Livability — Houston
- Score
- 74/100
- State rank
- #184
- US rank
- #4771
Category grades
Schools grade is shown separately in the Schools card above.
Census & demographics
- Census place
- Houston, TX
- County
- Harris County · 4,702,590 people
- City population
- 3,226,434
- Metro
- Houston-The Woodlands-Sugar Land, TX
- Population (ZIP)
- 28,272
- Household income
- $62,106
- Rent vs Own
- Severe rent burden
- 2814.0
Population outlook (Harris County) Hauer SSP2
- Today (2025)
- 5,571,493 people
- By 2030
- 6,089,821 · +9.3%
- By 2040
- 7,142,806 · +28.2%
- By 2050
- 8,185,864 · +46.9%
- By 2075
- 10,574,329 · +89.8%
- By 2100
- 12,109,958 · +117.4%
Race, ethnicity, and origin ACS 2023
- Neighborhood character
- Highly diverse neighborhood (Simpson 0.72)
- Race & ethnicity
- Black 41% Asian 22% White 20% Hispanic / Latino 14% Two or more races 10%
- Hispanic origin (detail)
- Mexican 7%
- Common ancestry
- Slovak 2% Romanian 1% Italian 1%
- Foreign-born
- 29% · China, Canada, Jamaica
- Languages at home
- 67% English-only · Spanish 9% Chinese 7% Other Indo-European 5%
Political lean MEDSL · Harris
- 2024 margin
- Lean D (+5.5) · D 52.0% · R 46.4% · Other 1.6%
- 2008→2024 swing
- +3.9pp toward D · 2008: 1.6pp · 2024: 5.5pp
- All cycles
- 2024: D+5.5 2020: D+13.3 2016: D+12.4 2012: D+0.1 2008: D+1.6
Not yet ingested
- Civics
- —
Market trends
- HPI YoY
- ▼ -4.51%
- Current HPI
- 170.4017
- Rent YoY
- ▼ -2.82%
- Metro
- Houston-The Woodlands-Sugar Land, TX
- State GDP YoY
- ▲ 3.95%
- F500 in state
- 110
Industry mix (Fortune 500 HQ in TX)
| Industry | F500 HQs | Revenue |
|---|---|---|
| Energy | 16 | $1,198B |
|
||
| Technology | 5 | $198B |
|
||
| Engineering / Construction | 4 | $72B |
|
||
| Energy Services | 3 | $60B |
|
||
| Utilities | 3 | $41B |
|
||
| Healthcare | 2 | $330B |
|
||
Price history
-4.3% since first listed3 events — show timeline
- 2026-04-20 Price Changed $110,000 HARMLS
- 2026-03-05 Listed $115,000 HARMLS
- 2008-08-26 Sold (Public Records) — Public Records
Property tax history
+4.7%/yrLatest (2025): $2,621 · +3.0% YoY. Source: county tax records.
Cash-flow waterfall
monthlySold comps — $/sqft
last 12 mo · ≤1 miLoading sold comps…