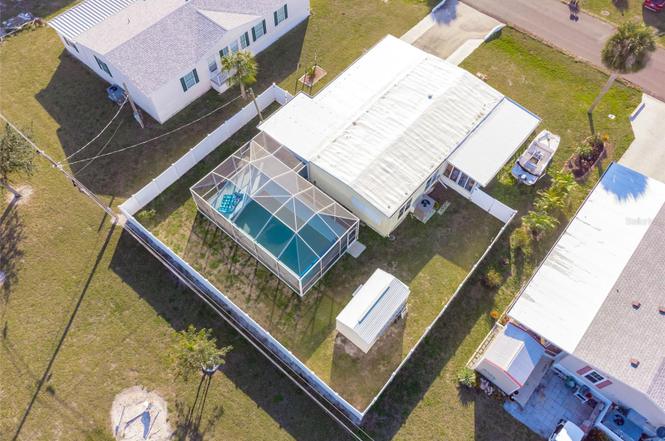
1287 Ibis Dr · Englewood, FL
Flood risk 8/10 · Major
- FEMA flood zone
- AE
- Chance of flooding over 30 yrs
- 0.97%
- Est. flood insurance / yr
- $1,737 – $8,500
Fire risk 5/10 · Moderate
- Est. fire insurance / yr
- $947 – $1,759
Heat risk 10/10 · Severe
- Hot days now (above 107°F)
- 7 days/yr
- Hot days in 30 yrs
- 27 days/yr
Wind risk 10/10 · Severe
- Chance of severe wind over 30 yrs
- 99.0%
Air-quality risk 2/10 · Minimal
- Unhealthy air days now
- 1 days/yr
- Unhealthy air days in 30 yrs
- 1 days/yr
Risk factors via First Street. Map © Google.
Why this score? — see what drove the C+ grade
The composite is a weighted blend of 9 inputs, each scored 0–100. Each bar is that input's sub-score; the figure is the points it added to the 100-point composite (weight × sub-score).
- Cash flow +30.0/30.0
- DSCR +10.0/10.0
- 1% rule +8.0/10.0
- Schools +4.6/10.0
- Livability +3.7/5.0
- Rent growth +2.5/5.0
- Condition / age +2.5/5.0
- ARV discount +0.9/15.0
- Appreciation +0.0/10.0
$189,000
🖨 Deal sheet (PDF) 📄 Offer letter ✓ Due diligence
Listing remarks MLS
PRICED TO SELL FAST. NEW WINDOWS IN LIVING ROOM, DINING ROOM, MASTER BEDROOM, KITCHEN & BATH. NEW ROOF IN 2003. REFRIGE APPX 4 YRS. LANAI HAS NEW SLIDING ACRYLIC WINDOWS. EAT-IN KITCHEN. 2 UTILITY SHEDS. VERTICALS ON WINDOWS. HURRICANE AQNINGS. MOST FURNISHINGS REMAIN. CERTIFIED ADULT PARK. PETS ALOWED.
Key facts
- Saltwater pool
- Privacy fence
- Updated bathrooms
Tags
Neighborhood map
What this means for you Summary
Snapshot
- This is a 2-bed/2.0-bath manufactured listed at $189k.
Deal economics
- At list price, monthly cash flow is $364 ($4k/yr) — positive.
- The deal already cash-flows at list — no discount required.
- Meets the 1% rule at list price ($2k rent vs $189k).
- Recommended offer: $166k (12.0% below list) — sets the bar for market timing.
- Cap rate 11.3% vs local median 3.8% in Englewood — top-decile yield for the area; either an underpriced asset or a hidden risk that comps aren't pricing in. Stress-test before assuming the spread holds.
Location & tenants
- Location reads 73/100 on livability (#321 in FL) — a middle-class / working-renter tenant base. Strengths: housing A+, cost of living A, health & safety A; Watch: employment C-, amenities F, commute F.
- Charlotte (suburban): math 54% / reading 54% proficiency, ranked #22 of 73 in FL (top 30%) — acceptable for families but not a draw, mixed tenant base, ~2y average lease.
- Market conditions: Rents soft (-0.1%/yr); 734 active listings in the ZIP; 13 comparable units currently listed for rent nearby; rentals at typical pace (median 22d on market — plan ~3-4 weeks tenant-placement turnaround); 4,585 units permitted in Charlotte County in 2024 (703 in 5+ unit buildings).
- At $2,454/mo this rent would consume 51% of the median local household income ($57k/yr) (locally 329% of renters already pay >50% of income on rent) — very limited rent-growth headroom before tenants either downsize or default.
Forward outlook
- Local home prices are declining (-3.0%/yr); year-one equity from $1k of loan paydown is wiped out by about $6k of value loss. Plan a longer hold.
- Charlotte County population projected at +24% by 2050 — long-run rental-demand tailwind backs the buy-and-hold thesis.
Negotiation context
- It's been on market 372 days — a 12% lower offer ($166k) is reasonable based on typical stale-listing flexibility.
- 4 sale attempts since 21y ago; this cycle's ask has dropped $31k (14%) from the opening price — seller is motivated, your offer sets the floor, not the list.
- Current owner paid $92k; list at $189k implies a 107% gain — meaningful room to come down on a strong offer.
Risks & watch-outs
- Watch-outs: flood insurance adds $427/mo.
- Climate carrying-cost: in FEMA flood zone AE (mandatory federal flood insurance); severe wind risk, 99% chance of damaging wind over 30y; moderate wildfire risk; extreme-heat days projected 7→27/yr by 2055 (HVAC capex compounding) — expect insurance premiums to compound above CPI over the hold.
Questions for the listing agent
- It's been on market 372 days. Have you received any prior offers? Is the seller open to a 12% concession, seller financing, or rate buy-down credit?
- Built in 1976 — when were the roof, HVAC, electrical panel, plumbing, and water heater last replaced?
- What's the actual annual flood-insurance premium (NFIP or private), and is the property in a SFHA with mandatory coverage?
- What does the HOA fee cover, when was the last increase, and are there any pending special assessments or reserve-fund shortfalls?
- Why hasn't it sold? Are there any deal-killer items the seller is aware of (foundation, flood, title, zoning, code violations)?
- Is there a deadline driving the sale (1031 exchange, divorce, estate, relocation)? That informs how much negotiation room exists.
- Schools are A-rated — typically a magnet for longer-tenancy family renters. What's the average tenant stay here, and is there a school-zone premium baked into asking?
- What's the average days-on-market for RENTAL listings here right now (not sales)? A rising rental-DOM trend means longer vacancies and softer asking-rent achievability than the comps imply.
- What's the recent tenant-quality profile in this submarket — average credit score on applications, eviction rate, late-payment / NSF rate, and stable-employment percentage? A property-management company in the area should have these aggregated.
- How much new for-sale + rental construction is in the pipeline within 1–3 miles? Heavy new supply typically softens prices + rents 12–24 months out; constrained supply supports both.
Investment metrics
- 1% rule
- 1.30% ✓
- Cap rate
- 11.31%
- Cash-on-cash
- 17.92%
- DSCR
- 1.80
- GRM
- 6.4
CMA / ARV
- ARV (on-the-fly)
- $164,736
- Comps found
- 2
Show comp detail 2 sales within ~0.75 mi
| Address | Dist | Beds/Ba | Sqft | Sold | Price | $/sf | Match |
|---|---|---|---|---|---|---|---|
| 1297 Kingfisher Dr | 0.06mi | 2/2.0 | 1,176 (+2%) | 3mo | $105,000 | $89 | 92 |
| 1513 Blue Heron Dr | 0.54mi | 2/2.0 | 1,152 (0%) | 11mo | $165,000 | $143 | 66 |
Match score weights: distance 35% · size 25% · config 20% · recency 20%. Top-matched comps best support the ARV.
Projected returns pro-forma
-3.0% appreciation · 0.0% rent growth · sell at horizon
- IRR
- -7.7%
- Equity multiple
- 0.73×
- Total profit
- $-14,460
- Equity at exit
- $28,181
- IRR
- -3.3%
- Equity multiple
- 0.82×
- Total profit
- $-9,743
- Equity at exit
- $16,341
Cash invested: $52,920 (down + closing). Projections, not guarantees.
Landlord ↔ Tenant lean methodology
- Overall (STATE)
- 87 Strongly Landlord-Friendly
- State Florida
- 87 Strongly Landlord-Friendly · R+3
- County
- — inherits STATE
- City
- — inherits STATE
ZIP-level market 34224
- Home prices YoY
- -18.9%
- Rents YoY
- -0.1%
- Active inventory
- 734
- Price-to-rent
- 6.4×
Monthly cashflow live
- Estimated rent
- $2,454 high interval (Pro) →
- Mortgage (P&I)
- −$991
- Tax from tax record
- −$69 /mo · $832/yr
- Insurance
- −$79
- Flood insurance flood zone
- −$427 /mo · $5,118/yr
- HOA
- −$9
- Vacancy / Maint / Mgmt
- −$515
- Net cashflow
- $364
Break-even live
Sensitivity live
| Price | -10% $471 | -5% $417 | +0% $364 | +5% $310 | +10% $257 |
|---|---|---|---|---|---|
| Rent | -10% $170 | -5% $267 | +0% $364 | +5% $460 | +10% $557 |
| Rate | -1.0pp $459 | -0.5pp $412 | base $364 | +0.5pp $315 | +1.0pp $265 |
UW: 25.0% down · 7.5% · 30yr · 1.5% tax · 5.0% vac · 8.0% maint · 8.0% mgmt
Financing live
Cash to close
- Down payment
- $47,250
- Closing costs
- $5,670
- Reserves months
- —
- Total cash needed
- —
Loan-product check · same deal, 3 products live
Conventional
25% down · 7.5% · 30yr
- Down + closing
- —
- Monthly P&I
- —
- Monthly cashflow
- —
- DSCR
- —
- Eligible?
- —
Personal DTI + credit; lowest rate.
DSCR
20% down · 8.5% · 30yr
- Down + closing
- —
- Monthly P&I
- —
- Monthly cashflow
- —
- DSCR
- —
- Eligible?
- —
No personal income docs; deal must DSCR.
Hard money
10% down · 12.0% · 12mo
- Down + closing
- —
- Monthly P&I
- —
- Monthly cashflow
- —
- DSCR
- —
- Eligible?
- —
Short-term bridge; refi at stabilization.
Rent comps 13 comps
| Address | Beds | Baths | Sqft | Rent | $/sqft | DOM | Units | Dist |
|---|---|---|---|---|---|---|---|---|
| 1120 Lampp Dr Englewood, FL | 3.0 | 2.0 | 1212 | $4,000 | $3.30 | 21d | 1 | 0.59mi |
| 1604 Cardinal Ln Unit 1 Englewood, FL | 1.0 | 1.0 | 750 | $1,300 | $1.73 | 21d | 1 | 0.64mi |
| 2275 S McCall Rd #201 Englewood, FL | 2.0 | 2.0 | 1050 | $2,000 | $1.90 | 14d | 1 | 0.65mi |
| 858 E 7th St Englewood, FL | 3.0 | 2.0 | 1244 | $1,995 | $1.60 | 21d | 1 | 0.80mi |
| 2643 Lear Rd Englewood, FL | 2.0 | 2.0 | 1206 | $5,800 | $4.81 | 21d | 1 | 0.95mi |
| 1531 Placida Rd #203 Englewood, FL | 2.0 | 2.0 | 1056 | $3,900 | $3.69 | 21d | 1 | 1.12mi |
| 1531 Placida Rd #204 Englewood, FL | 2.0 | 2.0 | 1056 | $3,500 | $3.31 | 21d | 1 | 1.12mi |
| 6699 San Casa Dr Englewood, FL | 2.0 | 2.0 | 1028 | $1,900 | $1.85 | 21d | 1 | 1.18mi |
| 6688 San Casa Dr Englewood, FL | 2.0 | 2.0 | 1143 | $1,600 | $1.40 | 21d | 1 | 1.24mi |
| 1575 Loralin Dr Englewood, FL | 3.0 | 2.0 | 1322 | $5,000 | $3.78 | 21d | 1 | 1.34mi |
| 1435 New Point Comfort Rd Unit B Englewood, FL | 1.0 | 1.0 | 744 | $1,520 | $2.04 | 21d | 1 | 1.35mi |
| 9264 Anita Ave Unit A Englewood, FL | 2.0 | 2.0 | 1008 | $1,400 | $1.39 | 21d | 1 | 1.42mi |
| 1210 S Maryknoll Rd Englewood, FL | 2.0 | 2.0 | 1063 | $2,600 | $2.45 | 21d | 1 | 1.49mi |
HOA detail
- Monthly dues
- $9 · $108/yr
Listing history 13 events
-
2026-04-10status Pending
-
2026-04-02price $189,000
-
2026-02-15price $199,800
-
2026-01-17price $209,800
-
2025-11-22status Active
-
2025-11-17status Pending
-
2025-08-11status Active
-
2025-02-15$219,800 Active
-
2006-04-19soldstatus $91,500
-
2006-04-07soldstatus $91,500 310-char remark
Show marketing remark (310 chars)
PRICED TO SELL FAST. NEW WINDOWS IN LIVING ROOM, DINING ROOM, MASTER BEDROOM, KITCHEN & BATH. NEW ROOF IN 2003. REFRIGE APPX 4 YRS. LANAI HAS NEW SLIDING ACRYLIC WINDOWS. EAT-IN KITCHEN. 2 UTILITY SHEDS. VERTICALS ON WINDOWS. HURRICANE AQNINGS. MOST FURNISHINGS REMAIN. CERTIFIED ADULT PARK. PETS ALOWED.
-
2005-12-05$115,000 310-char remark
Show marketing remark (310 chars)
PRICED TO SELL FAST. NEW WINDOWS IN LIVING ROOM, DINING ROOM, MASTER BEDROOM, KITCHEN & BATH. NEW ROOF IN 2003. REFRIGE APPX 4 YRS. LANAI HAS NEW SLIDING ACRYLIC WINDOWS. EAT-IN KITCHEN. 2 UTILITY SHEDS. VERTICALS ON WINDOWS. HURRICANE AQNINGS. MOST FURNISHINGS REMAIN. CERTIFIED ADULT PARK. PETS ALOWED.
-
2002-12-13soldstatus $60,000
-
1993-06-29soldstatus $46,000
ⓘ Source: listings_history table (triggers on properties + properties_extension) + one-shot
backfill from property_details.listing_events for pre-trigger history.
Tax reassessment forecast FL · Resets to sale price
- Current annual tax
- $832 · $69/mo
- Projected year-2 tax
- $1,569 · $131/mo
- Expected delta
- +$737/yr (+$61/mo · 88.7%)
ⓘ Screening estimate from a state-policy table — verify with the county assessor before closing.
Climate risk First Street
- Flood 8/10 Severe FEMA zone AE · 97% chance over 30 yrs
- Wildfire 5/10 Major
- Heat 10/10 Extreme 7 d/yr ≥107°F today · 27 d/yr by 30 yrs out
- Wind 10/10 Extreme 99% chance of damaging wind over 30 yrs
- Air quality 2/10 Low 1 unhealthy d/yr today · 1 by 30 yrs out
Nearby sold comps map
Loading sold comps map…
Walkable amenities ~0.75 mi
Loading nearby amenities…
Taxation est. · year 1
- Rental income
- $29,442
- − Mortgage interest
- −$10,587
- − Property taxes
- −$832
- − Insurance
- −$6,064
- − Repairs & maintenance
- −$2,355
- − Management
- −$2,355
- − HOA
- −$108
- − Depreciation
- −$5,498
- Taxable income
- $1,643
- Est. tax owed @ 24.0%
- −$394
- After-tax cash flow
- $3,968/yr
For passive investors: Depreciation is non-cash, so a rental often shows a tax loss while cash-flowing — sheltering income. Rental losses are passive: they offset passive income freely, and up to $25,000/yr can offset ordinary (W-2) income if you actively participate and your MAGI is under $100k (phasing out to $0 by $150k); unused losses carry forward. On sale, claimed depreciation is recaptured at up to 25%, and gains may owe capital-gains tax (a 1031 exchange can defer both). Figures are a year-1 estimate at your 24.0% rate — not tax advice; consult a CPA.
Schools (NCES district)
- District
- Charlotte
- NCES district ID
- 1200240
- Math proficiency
- 54% ▼ -6.00%
- Reading proficiency
- 54% ▼ -1.00%
- Median HH income
- $44,864
- Composite
- 45.62/100
- National rank
- #2586
- State rank
- #22 of 73 in FL
Livability — Englewood
- Score
- 73/100
- State rank
- #321
- US rank
- #5655
Category grades
Schools grade is shown separately in the Schools card above.
Census & demographics
- Census place
- Englewood, FL
- County
- Charlotte County · 196,994 people
- City population
- 35,420
- Metro
- Punta Gorda, FL
- Population (ZIP)
- 15,536
- Household income
- $57,281
- Rent vs Own
- Severe rent burden
- 329.0
Population outlook (Charlotte County) Hauer SSP2
- Today (2025)
- 198,646 people
- By 2030
- 210,507 · +6.0%
- By 2040
- 230,857 · +16.2%
- By 2050
- 247,148 · +24.4%
- By 2075
- 281,777 · +41.8%
- By 2100
- 293,609 · +47.8%
Race, ethnicity, and origin ACS 2023
- Neighborhood character
- Predominantly White (92%)
- Race & ethnicity
- White 92% Two or more races 5% Hispanic / Latino 3% Asian 1%
- Common ancestry
- Romanian 4% Slovak 4% Lithuanian 4%
- Foreign-born
- 9% · Canada
- Languages at home
- 92% English-only · Other Indo-European 2% Spanish 2% German/W. Germanic 1%
Political lean MEDSL · Charlotte
- 2024 margin
- Solid R (+34.0) · D 32.7% · R 66.7%
- 2008→2024 swing
- -26.7pp toward R · 2008: -7.2pp · 2024: -34.0pp
- All cycles
- 2024: R+34.0 2020: R+26.6 2016: R+27.8 2012: R+14.3 2008: R+7.2
Not yet ingested
- Civics
- —
Market trends
- HPI YoY
- ▼ -75.76%
- Current HPI
- 325.0345
- Rent YoY
- ▼ -0.11%
- Metro
- Punta Gorda, FL
- State GDP YoY
- ▲ 3.28%
- F500 in state
- 36
Industry mix (Fortune 500 HQ in FL)
| Industry | F500 HQs | Revenue |
|---|---|---|
| Industrial Technology | 2 | $29B |
|
||
| Insurance | 2 | $17B |
|
||
| Retail | 1 | $60B |
|
||
| Technology Distribution | 1 | $58B |
|
||
| Homebuilding | 1 | $35B |
|
||
| Technology Manufacturing | 1 | $35B |
|
||
Price history
+310.9% since first listed13 events — show timeline
- 2026-04-10 Pending — Stellar MLS as Distributed by MLS Grid
- 2026-04-02 Price Changed $189,000 Stellar MLS as Distributed by MLS Grid
- 2026-02-15 Price Changed $199,800 Stellar MLS as Distributed by MLS Grid
- 2026-01-17 Price Changed $209,800 Stellar MLS as Distributed by MLS Grid
- 2025-11-22 Relisted — Stellar MLS as Distributed by MLS Grid
- 2025-11-17 Pending — Stellar MLS as Distributed by MLS Grid
- 2025-08-11 Relisted — Stellar MLS as Distributed by MLS Grid
- 2025-02-15 Listed $219,800 Stellar MLS as Distributed by MLS Grid
- 2006-04-19 Sold (Public Records) $91,500 Public Records
- 2006-04-07 Sold (MLS) $91,500 Stellar MLS as Distributed by MLS Grid
- 2005-12-05 Listed $115,000 Stellar MLS as Distributed by MLS Grid
- 2002-12-13 Sold (Public Records) $60,000 Public Records
- 1993-06-29 Sold (Public Records) $46,000 Public Records
Property tax history
-0.8%/yrLatest (2025): $832 · -54.7% YoY. Source: county tax records.
Cash-flow waterfall
monthlySold comps — $/sqft
last 12 mo · ≤1 miLoading sold comps…