 🏷️ Likely Rental
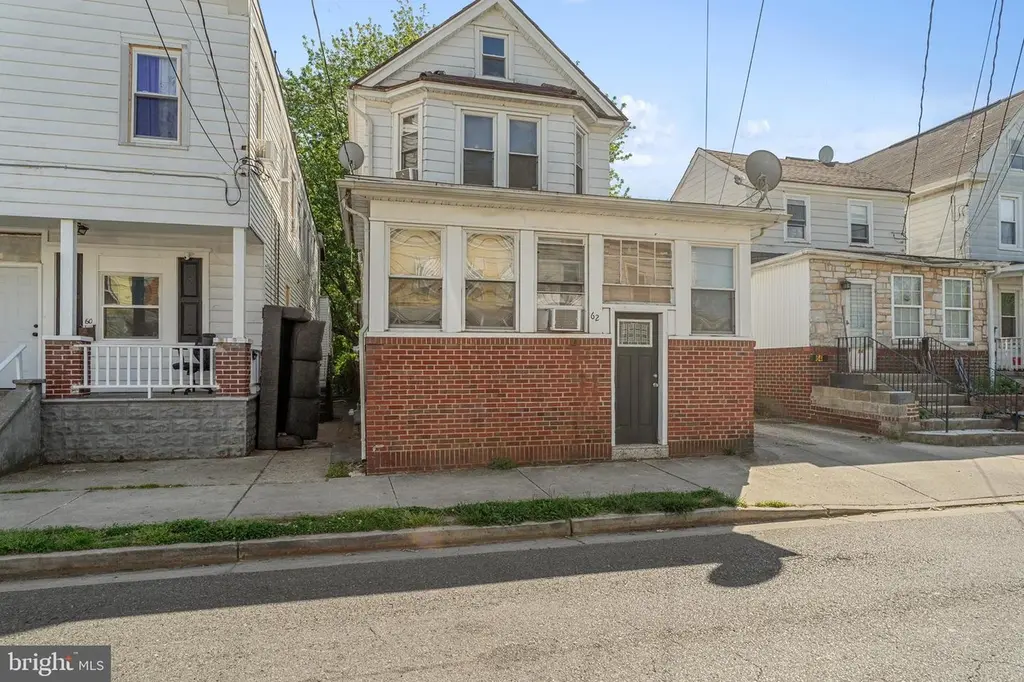
62 W Pitman St · Penns Grove, NJ
Flood risk 6/10 · Moderate
- FEMA flood zone
- X (unshaded)
- Chance of flooding over 30 yrs
- 0.54%
- Est. flood insurance / yr
- $507 – $1,088
Fire risk 1/10 · Minimal
- Est. fire insurance / yr
- $526 – $976
Heat risk 7/10 · Major
- Hot days now (above 104°F)
- 7 days/yr
- Hot days in 30 yrs
- 15 days/yr
Wind risk 6/10 · Moderate
- Chance of severe wind over 30 yrs
- 27.0%
Air-quality risk 3/10 · Minor
- Unhealthy air days now
- 3 days/yr
- Unhealthy air days in 30 yrs
- 5 days/yr
Risk factors via First Street. Map © Google.
Why this score? — see what drove the B grade
The composite is a weighted blend of 9 inputs, each scored 0–100. Each bar is that input's sub-score; the figure is the points it added to the 100-point composite (weight × sub-score).
- Cash flow +30.0/30.0
- ARV discount +15.0/15.0
- 1% rule +10.0/10.0
- DSCR +10.0/10.0
- Livability +2.9/5.0
- Rent growth +2.5/5.0
- Condition / age +2.5/5.0
- Schools +1.2/10.0
- Appreciation +0.0/10.0
$140,000
🖨 Deal sheet 📄 Offer letter ✓ Due diligence
Listing remarks
INVESTMENT OPPORTUNITY - This property offers strong potential for investors looking to add to their portfolio, renovate and resell, or create long-term rental income. Property is currently tenant occupied, which are paying $1,575 per month, making this an attractive opportunity for cash flow-focused investors. Additionally, the detached 3-car garage at the rear of the property offers additional rental income potential for storage, parking, workshop space, or tenant use. Being sold strictly as-is, buyers are responsible for conducting their own due diligence, and the seller makes no representations or guarantees regarding condition, zoning, permitted use, or potential income.
Key facts
- 3 garage spots
- Built 1940
- Listed 37 days
Tags
Property features AI
Exterior
- Parking: Detached garage with three spaces; Driveway
- Utilities: Public water; Public sewer; Natural gas heating and hot water
- Home design: Detached property; Entry and orientation details not provided
- Construction: Brick exterior; Permanent foundation
- Exterior features: Brick construction; Above- and below-grade structures include garage(s)
Interior
- Bedrooms: Three bedrooms on the upper level
- Bathrooms: One full bathroom on the upper level; One half bathroom on the main level
- Heating & cooling: Radiator heating; Natural gas hot water
- Interior features: Unfinished basement; Living area as reported by assessor
Neighborhood map
What this means for you Summary
Snapshot
- This is a 3-bed/1.5-bath single-family listed at $140k.
Deal economics
- At list price, monthly cash flow is $801 ($10k/yr) — positive.
- The deal already cash-flows at list — no discount required.
- Meets the 1% rule at list price ($3k rent vs $140k).
- Recommended offer: $136k (3.0% below list) — sets the bar for market timing.
- Cap rate 13.2% vs local median 6.0% in Penns Grove — top-decile yield for the area; either an underpriced asset or a hidden risk that comps aren't pricing in. Stress-test before assuming the spread holds.
Location & tenants
- Location reads 57/100 on livability (#519 in NJ) — a working-class tenant base; expect higher turnover. Strengths: cost of living A, housing A-; Watch: schools F, crime F, amenities F.
- Penns Grove-Carneys Point Regional School District (suburban): math 6% / reading 21% proficiency, ranked #462 of 472 in NJ (top 98%) — low school quality limits family demand, transient renter base, plan for 1-2y turnover; 65% free/reduced lunch — lower-income household profile, screen leases tightly.
- Market conditions: 101 active listings in the ZIP; 2 comparable units currently listed for rent nearby; 95 units permitted in Salem County in 2024 (0 in 5+ unit buildings).
- This rent runs 42% of the median local income ($72k/yr) — at the standard rent-burdened threshold; future hikes will face affordability resistance.
Forward outlook
- Local home prices are declining (-3.0%/yr); year-one equity from $968 of loan paydown is wiped out by about $4k of value loss. Plan a longer hold.
- Salem County population projected at -23% by 2050 — secular population decline; favor cash flow + early exit over multi-decade hold.
- At projected returns (-3.0% appreciation + 3.0% rent growth), your $39k cash investment doubles in ~5 years — after that, you're playing with house money.
Negotiation context
- It's been on market 38 days — a 3% lower offer ($136k) is reasonable based on typical stale-listing flexibility.
- 9 sale attempts since 19y ago; this cycle's ask has dropped $10k (7%) from the opening price — seller is motivated, your offer sets the floor, not the list.
- Current owner paid $54k; list at $140k implies a 159% gain — meaningful room to come down on a strong offer.
Risks & watch-outs
- Watch-outs: property tax is 3.5% of price; built in 1940 — expect roof / HVAC / electrical / plumbing capex.
- Climate carrying-cost: major flood risk; major wind risk, 27% chance of damaging wind over 30y; extreme-heat days projected 7→15/yr by 2055 (HVAC capex compounding) — expect insurance premiums to compound above CPI over the hold.
Questions for the listing agent
- It's been on market 38 days. Have you received any prior offers? Is the seller open to a 3% concession, seller financing, or rate buy-down credit?
- Built in 1940 — when were the roof, HVAC, electrical panel, plumbing, and water heater last replaced?
- Property tax is high relative to price — has the assessment been appealed recently, and will the sale trigger a re-assessment?
- Is there a deadline driving the sale (1031 exchange, divorce, estate, relocation)? That informs how much negotiation room exists.
- Schools are F-rated, which usually means shorter tenancies and higher turnover. Who's the typical renter profile here, and what's been the actual vacancy rate?
- Crime grade is F in this area — have there been break-ins, vandalism, or insurance claims at this property in the last 3 years? What carrier currently insures it and at what premium?
- What's the average days-on-market for RENTAL listings here right now (not sales)? A rising rental-DOM trend means longer vacancies and softer asking-rent achievability than the comps imply.
- What's the recent tenant-quality profile in this submarket — average credit score on applications, eviction rate, late-payment / NSF rate, and stable-employment percentage? A property-management company in the area should have these aggregated.
- How much new for-sale + rental construction is in the pipeline within 1–3 miles? Heavy new supply typically softens prices + rents 12–24 months out; constrained supply supports both.
Investment metrics
- 1% rule
- 1.81% ✓
- Cap rate
- 13.16%
- Cash-on-cash
- 24.51%
- DSCR
- 2.09
- GRM
- 4.6
CMA / ARV
- ARV (median comp)
- $197,968
- List price
- $140,000
- Delta
- -29.28%
- Verdict
- UNDERPRICED
- Comps
- 20 within 1.0 mi
Show comp detail 12 sales within ~0.75 mi
| Address | Dist | Beds/Ba | Sqft | Sold | Price | $/sf | Match |
|---|---|---|---|---|---|---|---|
| 22 Delaware Ave | 0.28mi | 3/2.0 | 1,927 (-2%) | 2mo | $250,000 | $130 | 79 |
| 136 Denny Ave | 0.16mi | 4/2.0 (+1) | 1,968 (-0%) | 8mo | $105,000 | $53 | 79 |
| 35 Franklin St | 0.10mi | 3/2.5 | 1,792 (-9%) | 6mo | $335,000 | $187 | 71 |
| 1 Risner Ave | 0.30mi | 4/3.0 (+1) | 1,880 (-5%) | 10mo | $350,000 | $186 | 59 |
| 14 Franklin St | 0.16mi | 4/2.5 (+1) | 2,152 (+9%) | 11mo | $280,000 | $130 | 59 |
| 76 State St | 0.43mi | 4/2.5 (+1) | 1,918 (-3%) | 12mo | $199,000 | $104 | 56 |
| 119 Field | 0.59mi | 3/2.5 | 1,906 (-3%) | 12mo | $330,000 | $173 | 53 |
| 163 State St | 0.67mi | 4/2.0 (+1) | 2,016 (+2%) | 9mo | $290,000 | $144 | 51 |
| 26 Church St | 0.61mi | 3/2.0 | 1,836 (-7%) | 12mo | $225,000 | $123 | 48 |
| 105 State St | 0.52mi | 3/2.5 | 2,148 (+9%) | 12mo | $230,500 | $107 | 47 |
| 86 State St | 0.47mi | 4/2.5 (+1) | 1,781 (-10%) | 12mo | $190,000 | $107 | 42 |
| 94 Walnut St | 0.65mi | 4/2.0 (+1) | 1,835 (-7%) | 14mo | $285,000 | $155 | 39 |
Match score weights: distance 35% · size 25% · config 20% · recency 20%. Top-matched comps best support the ARV.
Projected returns pro-forma
-3.0% appreciation · 3.0% rent growth · sell at horizon
- IRR
- 17.9%
- Equity multiple
- 1.73×
- Total profit
- $28,497
- Equity at exit
- $20,874
- IRR
- 26.4%
- Equity multiple
- 3.33×
- Total profit
- $91,222
- Equity at exit
- $12,105
Cash invested: $39,200 (down + closing). Projections, not guarantees.
Landlord ↔ Tenant lean methodology
- Overall (STATE)
- 21 Tenant-Leaning
- State New Jersey
- 21 Tenant-Leaning · D+6
- County
- — inherits STATE
- City
- — inherits STATE
ZIP-level market 08069
- Home prices YoY
- -18.8%
- Active inventory
- 101
- Price-to-rent
- 4.6×
Monthly cashflow live
- Estimated rent
- $2,531 medium interval (Pro) →
- Mortgage (P&I)
- −$734
- Tax from tax record
- −$406 /mo · $4,875/yr
- Insurance
- −$58
- HOA
- −$0
- Vacancy / Maint / Mgmt
- −$532
- Net cashflow
- $801
Break-even live
UW: 25.0% down · 7.5% · 30yr · 1.5% tax · 5.0% vac · 8.0% maint · 8.0% mgmt
Financing live
Cash to close
- Down payment
- $35,000
- Closing costs
- $4,200
- Reserves months
- —
- Total cash needed
- —
Loan-product check · same deal, 3 products live
Conventional
25% down · 7.5% · 30yr
- Down + closing
- —
- Monthly P&I
- —
- Monthly cashflow
- —
- DSCR
- —
- Eligible?
- —
Personal DTI + credit; lowest rate.
DSCR
20% down · 8.5% · 30yr
- Down + closing
- —
- Monthly P&I
- —
- Monthly cashflow
- —
- DSCR
- —
- Eligible?
- —
No personal income docs; deal must DSCR.
Hard money
10% down · 12.0% · 12mo
- Down + closing
- —
- Monthly P&I
- —
- Monthly cashflow
- —
- DSCR
- —
- Eligible?
- —
Short-term bridge; refi at stabilization.
Rent comps 2 comps
| Address | Beds | Baths | Sqft | Rent | $/sqft | DOM | Units | Dist |
|---|---|---|---|---|---|---|---|---|
| 79 Delaware Ave Penns Grove, NJ | 3.0 | 1.0 | 1300 | $1,900 | $1.46 | 1d | 1 | 0.25mi |
| 74 Delaware Ave Penns Grove, NJ | 4.0 | 3.0 | 2000 | $2,900 | $1.45 | 43d | 1 | 0.27mi |
Listing history 43 events
-
2026-06-18days on market $140,000 Active 38 DOM
-
2026-06-17days on market $140,000 Active 37 DOM
-
2026-06-16days on market $140,000 Active 36 DOM
-
2026-06-15days on market $140,000 Active 35 DOM
-
2026-06-13days on market $140,000 Active 33 DOM
-
2026-06-09days on market $140,000 Active 29 DOM
-
2026-06-08days on market $140,000 Active 28 DOM
-
2026-06-07days on market $140,000 Active 27 DOM
-
2026-06-04days on market $140,000 Active 24 DOM
-
2026-06-03days on market $140,000 Active 23 DOM
-
2026-06-02days on market $140,000 Active 22 DOM
-
2026-06-01days on market $140,000 Active 21 DOM
-
2026-05-31days on market $140,000 Active 20 DOM
-
2026-05-11$150,000 Active 684-char remark
-
2025-08-29historical
-
2025-06-20price $154,999
-
2025-05-21price $159,999
-
2025-04-16price $164,999
-
2025-03-10$169,999 Active
-
2025-01-11historical
-
2024-11-14price $185,000
-
2024-10-15$215,000 Active
-
2021-10-26soldstatus $54,000
-
2021-10-18soldstatus $54,000 Closed
-
2021-09-17status Pending
-
2021-08-28$69,900 Active
-
2019-11-30historical
-
2019-09-28price $59,900
-
2019-08-22price $61,900
-
2019-07-29price $64,900
-
2019-06-19price $66,900
-
2019-05-13price $69,900
-
2019-04-04$74,900 Active
-
2008-09-11soldstatus $16,200
-
2008-08-15historical
-
2008-05-29$19,900
-
2008-05-28historical
-
2008-04-15$49,900
-
2007-10-18historical
-
2007-10-05historical
-
2007-07-18$63,600
-
2007-02-16$65,000
-
1981-06-09soldstatus $28,000
ⓘ Source: listings_history table (triggers on properties + properties_extension) + one-shot
backfill from property_details.listing_events for pre-trigger history.
Tax reassessment forecast NJ · Partial reset (capped growth)
- Current annual tax
- $4,875 · $406/mo
- Projected year-2 tax
- $4,875 · $406/mo
- Expected delta
- $0/yr ($0/mo · 0.0%)
ⓘ Screening estimate from a state-policy table — verify with the county assessor before closing.
Climate risk First Street
- Flood 6/10 Major FEMA zone X (unshaded) · 54% chance over 30 yrs
- Wildfire 1/10 Low
- Heat 7/10 Severe 7 d/yr ≥104°F today · 15 d/yr by 30 yrs out
- Wind 6/10 Major 27% chance of damaging wind over 30 yrs
- Air quality 3/10 Moderate 3 unhealthy d/yr today · 5 by 30 yrs out
Nearby sold comps map
Loading sold comps map…
Walkable amenities ~0.75 mi
Loading nearby amenities…
Taxation est. · year 1
- Rental income
- $30,373
- − Mortgage interest
- −$7,842
- − Property taxes
- −$4,875
- − Insurance
- −$700
- − Repairs & maintenance
- −$2,430
- − Management
- −$2,430
- − Depreciation
- −$4,073
- Taxable income
- $8,023
- Est. tax owed @ 24.0%
- −$1,926
- After-tax cash flow
- $7,684/yr
For passive investors: Depreciation is non-cash, so a rental often shows a tax loss while cash-flowing — sheltering income. Rental losses are passive: they offset passive income freely, and up to $25,000/yr can offset ordinary (W-2) income if you actively participate and your MAGI is under $100k (phasing out to $0 by $150k); unused losses carry forward. On sale, claimed depreciation is recaptured at up to 25%, and gains may owe capital-gains tax (a 1031 exchange can defer both). Figures are a year-1 estimate at your 24.0% rate — not tax advice; consult a CPA.
Schools (NCES district)
- District
- Penns Grove-Carneys Point Regional School District
- NCES district ID
- 3412840
- Math proficiency
- 6% ▼ -16.00%
- Reading proficiency
- 21% ▼ -7.00%
- Median HH income
- $44,930
- Composite
- 11.98/100
- National rank
- #9665
- State rank
- #462 of 472 in NJ
Livability — Penns Grove
- Score
- 57/100
- State rank
- #519
- US rank
- #22190
Category grades
Schools grade is shown separately in the Schools card above.
Census & demographics
- Census place
- Penns Grove, NJ
- County
- Salem County · 24,175 people
- Metro
- Philadelphia-Camden-Wilmington, PA-NJ-DE-MD
- Population (ZIP)
- 13,413
- Household income
- $71,942
- Rent vs Own
- Severe rent burden
- 696.0
Population outlook (Salem County) Hauer SSP2
- Today (2025)
- 59,905 people
- By 2030
- 57,351 · -4.3%
- By 2040
- 51,837 · -13.5%
- By 2050
- 46,356 · -22.6%
- By 2075
- 36,452 · -39.2%
- By 2100
- 28,907 · -51.7%
Race, ethnicity, and origin ACS 2023
- Neighborhood character
- Diverse neighborhood (Simpson 0.65)
- Race & ethnicity
- White 50% Hispanic / Latino 22% Black 22% Two or more races 8% Asian 2%
- Hispanic origin (detail)
- Mexican 5% Puerto Rican 14%
- Common ancestry
- Romanian 3% Slovak 2% Lithuanian 1%
- Foreign-born
- 5% · Canada
- Languages at home
- 85% English-only · Spanish 13% Tagalog/Filipino 1%
Political lean MEDSL · Salem
- 2024 margin
- R (+19.2) · D 39.6% · R 58.8% · Other 1.6%
- 2008→2024 swing
- -23.1pp toward R · 2008: 3.9pp · 2024: -19.2pp
- All cycles
- 2024: R+19.2 2020: R+12.8 2016: R+15.4 2012: D+0.8 2008: D+3.9
Not yet ingested
- Civics
- —
Market trends
- HPI YoY
- ▼ -67.07%
- Current HPI
- 290.3853
- Rent YoY
- —
- Metro
- Philadelphia-Camden-Wilmington, PA-NJ-DE-MD
- State GDP YoY
- ▲ 2.05%
- F500 in state
- 34
Industry mix (Fortune 500 HQ in NJ)
| Industry | F500 HQs | Revenue |
|---|---|---|
| Consumer Goods | 3 | $31B |
|
||
| Pharmaceuticals | 2 | $153B |
|
||
| Technology | 2 | $21B |
|
||
| Insurance | 2 | $20B |
|
||
| Healthcare | 2 | $19B |
|
||
| Financial Services | 1 | $70B |
|
||
Price history
+400.0% since first listed32 events — show timeline
- 2026-05-29 Price Changed $140,000 BRIGHT MLS
- 2026-05-19 Price Changed $145,000 BRIGHT MLS
- 2026-05-11 Listed $150,000 BRIGHT MLS
- 2025-08-29 Listing Removed — BRIGHT MLS
- 2025-06-20 Price Changed $154,999 BRIGHT MLS
- 2025-05-21 Price Changed $159,999 BRIGHT MLS
- 2025-04-16 Price Changed $164,999 BRIGHT MLS
- 2025-03-10 Listed $169,999 BRIGHT MLS
- 2025-01-11 Listing Removed — BRIGHT MLS
- 2024-11-14 Price Changed $185,000 BRIGHT MLS
- 2024-10-15 Listed $215,000 BRIGHT MLS
- 2021-10-26 Sold (Public Records) $54,000 Public Records
- 2021-10-18 Sold (MLS) $54,000 BRIGHT MLS
- 2021-09-17 Pending — BRIGHT MLS
- 2021-08-28 Listed $69,900 BRIGHT MLS
- 2019-11-30 Listing Removed — BRIGHT MLS
- 2019-09-28 Price Changed $59,900 BRIGHT MLS
- 2019-08-22 Price Changed $61,900 BRIGHT MLS
- 2019-07-29 Price Changed $64,900 BRIGHT MLS
- 2019-06-19 Price Changed $66,900 BRIGHT MLS
- 2019-05-13 Price Changed $69,900 BRIGHT MLS
- 2019-04-04 Listed $74,900 BRIGHT MLS
- 2008-09-11 Sold (MLS) $16,200 BRIGHT MLS
- 2008-08-15 Listing Removed — BRIGHT MLS
- 2008-05-29 Listed $19,900 BRIGHT MLS
- 2008-05-28 Listing Removed — BRIGHT MLS
- 2008-04-15 Listed $49,900 BRIGHT MLS
- 2007-10-18 Listing Removed — BRIGHT MLS
- 2007-10-05 Listing Removed — BRIGHT MLS
- 2007-07-18 Listed $63,600 BRIGHT MLS
- 2007-02-16 Listed $65,000 BRIGHT MLS
- 1981-06-09 Sold (Public Records) $28,000 Public Records
Property tax history
+9.4%/yrLatest (2025): $4,875 · +1.9% YoY. Source: county tax records.
Cash-flow waterfall
monthlySold comps — $/sqft
last 12 mo · ≤1 miLoading sold comps…