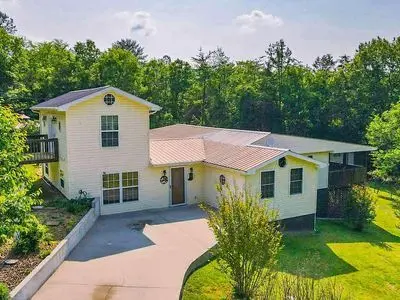
2453 Aderholt Rd · Burnside, KY
Flood risk 1/10 · Minimal
- FEMA flood zone
- X (unshaded)
- Chance of flooding over 30 yrs
- 0.0%
- Est. flood insurance / yr
- $507 – $1,088
Fire risk 5/10 · Moderate
- Est. fire insurance / yr
- $839 – $1,559
Heat risk 4/10 · Minor
- Hot days now (above 102°F)
- 7 days/yr
- Hot days in 30 yrs
- 20 days/yr
Wind risk 2/10 · Minimal
- Chance of severe wind over 30 yrs
- 3.0%
Air-quality risk 1/10 · Minimal
- Unhealthy air days now
- 0 days/yr
- Unhealthy air days in 30 yrs
- 0 days/yr
Risk factors via First Street. Map © Google.
Why this score? — see what drove the C+ grade
The composite is a weighted blend of 9 inputs, each scored 0–100. Each bar is that input's sub-score; the figure is the points it added to the 100-point composite (weight × sub-score).
- Cash flow +22.0/30.0
- Appreciation +10.0/10.0
- ARV discount +7.5/15.0
- DSCR +7.0/10.0
- 1% rule +4.9/10.0
- Schools +4.0/10.0
- Livability +3.6/5.0
- Rent growth +2.5/5.0
- Condition / age +2.5/5.0
$190,000
🖨 Deal sheet (PDF) 📄 Offer letter ✓ Due diligence
Listing remarks
Beautiful home nestled in the country. Plenty of privacy. Deer visit daily, and drink from the stream. Lots of room for entertaining. Minutes from Lake Cumberland.
Key facts
- Lake cumberland
- Privacy
- Deer visit
Tags
Neighborhood map
What this means for you Summary
Snapshot
- This is a 4-bed/2.0-bath single-family listed at $190k.
Deal economics
- At list price, monthly cash flow is $301 ($4k/yr) — positive.
- The deal already cash-flows at list — no discount required.
- To meet the 1% rule (rent ≥ 1% of price), the offer needs to be $187k (1.5% below list).
- Recommended offer: $187k (1.5% below list) — sets the bar for 1% rule.
- Cap rate 8.2% vs local median 3.0% in Burnside — top-decile yield for the area; either an underpriced asset or a hidden risk that comps aren't pricing in. Stress-test before assuming the spread holds.
Location & tenants
- Location reads 71/100 on livability (#141 in KY) — a middle-class / working-renter tenant base. Strengths: crime A+, cost of living A+, health & safety A+; Watch: schools D+, amenities F, commute F.
- Pulaski County (town): math 43% / reading 53% proficiency, ranked #17 of 165 in KY (top 10%) — families likely to look elsewhere, expect single-tenant / working-renter base with shorter leases.
- Market conditions: 50 active listings in the ZIP; 117 units permitted in Pulaski County in 2024 (50 in 5+ unit buildings).
Forward outlook
- In year one you build about $20k of equity ($1k loan paydown + $19k appreciation (10.0% local appreciation)).
- At projected returns (10.0% appreciation + 3.0% rent growth), your $53k cash investment doubles in ~3 years — after that, you're playing with house money.
- By year 2, paydown + projected appreciation supports a ~$33k cash-out refi (75% LTV) — recoverable capital for the next deal without selling this one.
Negotiation context
- Only 13 days on market — expect competitive offers; lowballing is unlikely to land.
- 3 sale attempts since 3y ago with the ask held roughly flat each time — persistent listings suggest the price (not the market) is what's stuck; bring a comps-based counter.
Risks & watch-outs
- Climate carrying-cost: moderate wildfire risk — expect insurance premiums to compound above CPI over the hold.
Questions for the listing agent
- Is there a deadline driving the sale (1031 exchange, divorce, estate, relocation)? That informs how much negotiation room exists.
- Schools are D-rated, which usually means shorter tenancies and higher turnover. Who's the typical renter profile here, and what's been the actual vacancy rate?
- What's the average days-on-market for RENTAL listings here right now (not sales)? A rising rental-DOM trend means longer vacancies and softer asking-rent achievability than the comps imply.
- What's the recent tenant-quality profile in this submarket — average credit score on applications, eviction rate, late-payment / NSF rate, and stable-employment percentage? A property-management company in the area should have these aggregated.
- How much new for-sale + rental construction is in the pipeline within 1–3 miles? Heavy new supply typically softens prices + rents 12–24 months out; constrained supply supports both.
Investment metrics
- 1% rule
- 0.99% ✗
- Cap rate
- 8.19%
- Cash-on-cash
- 6.79%
- DSCR
- 1.30
- GRM
- 8.5
CMA / ARV
No comps found within radius.
Projected returns pro-forma
10.0% appreciation · 3.0% rent growth · sell at horizon
- IRR
- 29.2%
- Equity multiple
- 3.30×
- Total profit
- $122,593
- Equity at exit
- $171,167
- IRR
- 25.4%
- Equity multiple
- 7.50×
- Total profit
- $345,832
- Equity at exit
- $369,128
Cash invested: $53,200 (down + closing). Projections, not guarantees.
Landlord ↔ Tenant lean methodology
- Overall (STATE)
- 83 Strongly Landlord-Friendly
- State Kentucky
- 83 Strongly Landlord-Friendly · R+16
- County
- — inherits STATE
- City
- — inherits STATE
ZIP-level market 42518
- Active inventory
- 50
- Price-to-rent
- 8.5×
Monthly cashflow live
- Estimated rent
- $1,872 medium interval (Pro) →
- Mortgage (P&I)
- −$996
- Tax from tax record
- −$102 /mo · $1,230/yr
- Insurance
- −$79
- HOA
- −$0
- Vacancy / Maint / Mgmt
- −$393
- Net cashflow
- $301
Break-even live
Sensitivity live
| Price | -10% $409 | -5% $355 | +0% $301 | +5% $247 | +10% $193 |
|---|---|---|---|---|---|
| Rent | -10% $153 | -5% $227 | +0% $301 | +5% $375 | +10% $449 |
| Rate | -1.0pp $397 | -0.5pp $349 | base $301 | +0.5pp $252 | +1.0pp $202 |
UW: 25.0% down · 7.5% · 30yr · 1.5% tax · 5.0% vac · 8.0% maint · 8.0% mgmt
Financing live
Cash to close
- Down payment
- $47,500
- Closing costs
- $5,700
- Reserves months
- —
- Total cash needed
- —
Loan-product check · same deal, 3 products live
Conventional
25% down · 7.5% · 30yr
- Down + closing
- —
- Monthly P&I
- —
- Monthly cashflow
- —
- DSCR
- —
- Eligible?
- —
Personal DTI + credit; lowest rate.
DSCR
20% down · 8.5% · 30yr
- Down + closing
- —
- Monthly P&I
- —
- Monthly cashflow
- —
- DSCR
- —
- Eligible?
- —
No personal income docs; deal must DSCR.
Hard money
10% down · 12.0% · 12mo
- Down + closing
- —
- Monthly P&I
- —
- Monthly cashflow
- —
- DSCR
- —
- Eligible?
- —
Short-term bridge; refi at stabilization.
Listing history 11 events
-
2026-06-22days on market $190,000 Active 13 DOM
-
2026-06-21days on market $190,000 Active 12 DOM
-
2026-06-21days on market $190,000 Active 11 DOM
-
2026-06-18days on market $190,000 Active 9 DOM
-
2026-06-17days on market $190,000 Active 8 DOM
-
2026-06-16days on market $190,000 Active 7 DOM
-
2026-06-15days on market $190,000 Active 6 DOM
-
2026-06-13days on market $190,000 Active 4 DOM
-
2026-06-12days on market $190,000 Active 3 DOM
-
2026-06-09remarks 163-char remark
-
2026-06-09$190,000 Active 1 DOM
ⓘ Source: listings_history table (triggers on properties + properties_extension) + one-shot
backfill from property_details.listing_events for pre-trigger history.
Tax reassessment forecast KY · Resets to sale price
- Current annual tax
- $1,230 · $102/mo
- Projected year-2 tax
- $1,634 · $136/mo
- Expected delta
- +$404/yr (+$34/mo · 32.9%)
ⓘ Screening estimate from a state-policy table — verify with the county assessor before closing.
Climate risk First Street
- Flood 1/10 Low FEMA zone X (unshaded) · 0% chance over 30 yrs
- Wildfire 5/10 Major
- Heat 4/10 Moderate 7 d/yr ≥102°F today · 20 d/yr by 30 yrs out
- Wind 2/10 Low 3% chance of damaging wind over 30 yrs
- Air quality 1/10 Low 0 unhealthy d/yr today · 0 by 30 yrs out
Nearby sold comps map
Loading sold comps map…
Walkable amenities ~0.75 mi
Loading nearby amenities…
Taxation est. · year 1
- Rental income
- $22,465
- − Mortgage interest
- −$10,643
- − Property taxes
- −$1,230
- − Insurance
- −$950
- − Repairs & maintenance
- −$1,797
- − Management
- −$1,797
- − Depreciation
- −$5,527
- Taxable income
- $521
- Est. tax owed @ 24.0%
- −$125
- After-tax cash flow
- $3,486/yr
For passive investors: Depreciation is non-cash, so a rental often shows a tax loss while cash-flowing — sheltering income. Rental losses are passive: they offset passive income freely, and up to $25,000/yr can offset ordinary (W-2) income if you actively participate and your MAGI is under $100k (phasing out to $0 by $150k); unused losses carry forward. On sale, claimed depreciation is recaptured at up to 25%, and gains may owe capital-gains tax (a 1031 exchange can defer both). Figures are a year-1 estimate at your 24.0% rate — not tax advice; consult a CPA.
Schools (NCES district)
- District
- Pulaski County
- NCES district ID
- 2104950
- Math proficiency
- 43% ▼ -18.00%
- Reading proficiency
- 53% ▼ -13.00%
- Median HH income
- $35,366
- Composite
- 39.69/100
- National rank
- #3906
- State rank
- #17 of 165 in KY
Livability — Burnside
- Score
- 71/100
- State rank
- #141
- US rank
- #6774
Category grades
Schools grade is shown separately in the Schools card above.
Census & demographics
- Population (ZIP)
- 2,946
Population outlook (Pulaski County) Hauer SSP2
- Today (2025)
- 65,414 people
- By 2030
- 65,828 · +0.6%
- By 2040
- 65,972 · +0.9%
- By 2050
- 65,108 · -0.5%
- By 2075
- 61,647 · -5.8%
- By 2100
- 53,613 · -18.0%
Race, ethnicity, and origin ACS 2023
- Neighborhood character
- Predominantly White (93%)
- Race & ethnicity
- White 93% Two or more races 2% Hispanic / Latino 1%
- Common ancestry
- Slovak 3% Serbian 2% Iranian 1%
- Foreign-born
- 1% · Canada
- Languages at home
- 99% English-only · Spanish 1%
Political lean MEDSL · Pulaski
- 2024 margin
- Solid R (+65.2) · D 16.9% · R 82.1% · Other 1.0%
- 2008→2024 swing
- -9.9pp toward R · 2008: -55.4pp · 2024: -65.2pp
- All cycles
- 2024: R+65.2 2020: R+62.7 2016: R+66.7 2012: R+60.5 2008: R+55.4
Not yet ingested
- Civics
- —
Market trends
- HPI YoY
- ▲ 111.57%
- Current HPI
- 360.0351
- Rent YoY
- —
- Metro
- —
- State GDP YoY
- ▲ 1.81%
- F500 in state
- 4
Industry mix (Fortune 500 HQ in KY)
| Industry | F500 HQs | Revenue |
|---|---|---|
| Healthcare | 1 | $118B |
|
||
| Food / Beverage | 1 | $7B |
|
||
Price history
-28.3% since first listed6 events — show timeline
- 2026-06-10 Listed $190,000 FSBO.com
- 2025-11-12 Listing Removed — ImagineMLS
- 2025-09-22 Price Changed $262,900 ImagineMLS
- 2025-08-13 Listed $264,900 ImagineMLS
- 2023-11-23 Listing Removed — ImagineMLS
- 2023-05-23 Listed $264,900 ImagineMLS
Property tax history
+25.1%/yrLatest (2025): $1,230 · -2.3% YoY. Source: county tax records.
Cash-flow waterfall
monthlySold comps — $/sqft
last 12 mo · ≤1 miLoading sold comps…