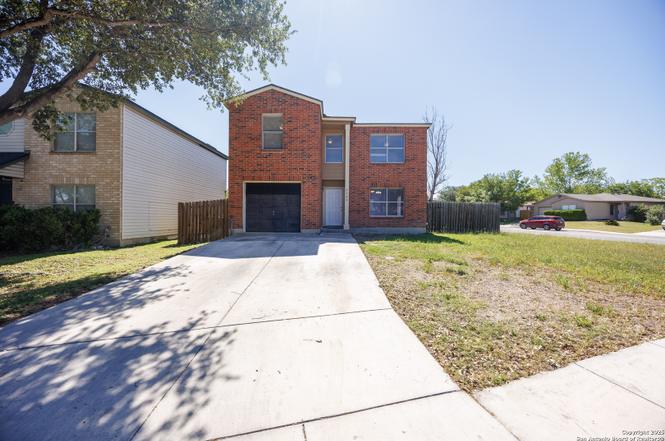
3702 Candlebluff · San Antonio, TX
Flood risk 1/10 · Minimal
- FEMA flood zone
- X (unshaded)
- Chance of flooding over 30 yrs
- 0.0%
- Est. flood insurance / yr
- $507 – $1,088
Fire risk 4/10 · Minor
- Est. fire insurance / yr
- $1,222 – $2,270
Heat risk 8/10 · Major
- Hot days now (above 108°F)
- 7 days/yr
- Hot days in 30 yrs
- 22 days/yr
Wind risk 8/10 · Major
- Chance of severe wind over 30 yrs
- 80.0%
Air-quality risk 2/10 · Minimal
- Unhealthy air days now
- 0 days/yr
- Unhealthy air days in 30 yrs
- 1 days/yr
Risk factors via First Street. Map © Google.
Why this score? — see what drove the D+ grade
The composite is a weighted blend of 9 inputs, each scored 0–100. Each bar is that input's sub-score; the figure is the points it added to the 100-point composite (weight × sub-score).
- Cash flow +14.3/30.0
- ARV discount +10.6/15.0
- 1% rule +4.4/10.0
- DSCR +4.3/10.0
- Livability +4.0/5.0
- Rent growth +2.7/5.0
- Condition / age +2.5/5.0
- Schools +2.4/10.0
- Appreciation +0.0/10.0
$199,700
🖨 Deal sheet (PDF) 📄 Offer letter ✓ Due diligence
Listing remarks MLS
PC1074 GREAT OPPORTUNITY TO BUILD YOUR OWN EQUITY! SOLD 'AS-IS.' SELLER EXEMPT FROM DISCLOSURE. PROVIDE PREQUAL LETTER OR PROOF OF FUNDS WITH OFFER. SELLER WILL COUNTER ON ADDENDUMS. FAX ALL OFFERS TO CATHY AT 525-8623.
Key facts
- Wood flooring
- Renovated
- Fresh paint
Tags
Neighborhood map
What this means for you Summary
Snapshot
- This is a 4-bed/2.5-bath single-family listed at $200k.
Deal economics
- At list price, monthly cash flow is $36 ($430/yr) — positive.
- The deal already cash-flows at list — no discount required.
- To meet the 1% rule (rent ≥ 1% of price), the offer needs to be $188k (5.9% below list).
- Recommended offer: $188k (5.9% below list) — sets the bar for 1% rule.
- Cap rate 6.5% vs local median 3.8% in San Antonio — top-decile yield for the area; either an underpriced asset or a hidden risk that comps aren't pricing in. Stress-test before assuming the spread holds.
Location & tenants
- Location reads 80/100 on livability (#31 in TX, #1,616 nationally) — a professional / high-income tenant draw. Strengths: amenities A+, commute A+, cost of living A+; Watch: crime F.
- Judson ISD (suburban): math 21% / reading 33% proficiency, ranked #660 of 826 in TX (top 80%) — low school quality limits family demand, transient renter base, plan for 1-2y turnover.
- Zoned schools: Candlewood El (math 12% / reading 22%, grade F, #3,836 of 4,322 statewide, top 91%, 519 students, 90% FRL); Henry Metzger Middle (math 12% / reading 20%, grade F, #1,543 of 1,662 statewide, top 94%, 953 students, 90% FRL); Karen Wagner H S (math 12% / reading 29%, grade F, #1,389 of 1,632 statewide, top 86%, 2,366 students, 80% FRL) — zoned schools average 86% FRL vs 57% district-wide (30 pts higher); higher-poverty schools than district average — tighter screening recommended.
- Market conditions: Rents flat; 193 active listings in the ZIP; 40 comparable units currently listed for rent nearby; rentals at typical pace (median 17d on market — plan ~3-4 weeks tenant-placement turnaround); 8,308 units permitted in Bexar County in 2024 (2,506 in 5+ unit buildings).
- This rent runs 32% of the median local income ($71k/yr) — at the standard rent-burdened threshold; future hikes will face affordability resistance.
Forward outlook
- Local home prices are declining (-3.0%/yr); year-one equity from $1k of loan paydown is wiped out by about $6k of value loss. Plan a longer hold.
- Bexar County population projected at +50% by 2050 — long-run rental-demand tailwind backs the buy-and-hold thesis.
Negotiation context
- It's been on market 27 days — a 2% lower offer ($197k) is reasonable based on typical stale-listing flexibility.
- 4 sale attempts since 22y ago with the ask held roughly flat each time — persistent listings suggest the price (not the market) is what's stuck; bring a comps-based counter.
Risks & watch-outs
- Climate carrying-cost: severe wind risk, 80% chance of damaging wind over 30y; extreme-heat days projected 7→22/yr by 2055 (HVAC capex compounding) — expect insurance premiums to compound above CPI over the hold.
Questions for the listing agent
- Is there a deadline driving the sale (1031 exchange, divorce, estate, relocation)? That informs how much negotiation room exists.
- Crime grade is F in this area — have there been break-ins, vandalism, or insurance claims at this property in the last 3 years? What carrier currently insures it and at what premium?
- The area grade is low — what's the realistic commute time and amenity access for the typical tenant pool here? Any planned neighborhood developments (good or bad) we should know about?
- What's the average days-on-market for RENTAL listings here right now (not sales)? A rising rental-DOM trend means longer vacancies and softer asking-rent achievability than the comps imply.
- What's the recent tenant-quality profile in this submarket — average credit score on applications, eviction rate, late-payment / NSF rate, and stable-employment percentage? A property-management company in the area should have these aggregated.
- How much new for-sale + rental construction is in the pipeline within 1–3 miles? Heavy new supply typically softens prices + rents 12–24 months out; constrained supply supports both.
Investment metrics
- 1% rule
- 0.94% ✗
- Cap rate
- 6.51%
- Cash-on-cash
- 0.77%
- DSCR
- 1.03
- GRM
- 8.9
CMA / ARV
- ARV (on-the-fly)
- $214,332
- Comps found
- 12
Show comp detail 12 sales within ~0.75 mi
| Address | Dist | Beds/Ba | Sqft | Sold | Price | $/sf | Match |
|---|---|---|---|---|---|---|---|
| 3702 Candlebluff | 0.00mi | 4/2.5 | 2,022 (0%) | 1mo | $199,700 | $99 | 99 |
| 3713 Candlecreek Ct | 0.04mi | 4/2.0 | 2,180 (+8%) | 6mo | $215,000 | $99 | 78 |
| 6239 Post | 0.21mi | 3/2.5 (-1) | 1,928 (-5%) | 2mo | $199,999 | $104 | 76 |
| 6351 Wild Flower | 0.30mi | 4/2.5 | 2,165 (+7%) | 1mo | $230,000 | $106 | 73 |
| 6526 Candledim | 0.33mi | 4/2.5 | 1,962 (-3%) | 8mo | $249,999 | $127 | 73 |
| 6334 Fence | 0.38mi | 4/2.5 | 1,982 (-2%) | 8mo | $204,900 | $103 | 72 |
| 3722 Candlecreek Ct | 0.07mi | 5/2.0 (+1) | 2,180 (+8%) | 7mo | $205,900 | $94 | 71 |
| 6335 Fence Xing | 0.36mi | 3/2.5 (-1) | 2,166 (+7%) | 5mo | $215,000 | $99 | 62 |
| 3343 Uresti | 0.65mi | 3/2.5 (-1) | 2,027 (+0%) | 5mo | $285,000 | $141 | 60 |
| 2722 Green Leaf Way | 0.33mi | 3/2.5 (-1) | 2,221 (+10%) | 8mo | $242,000 | $109 | 57 |
| 2715 Sunset | 0.48mi | 3/2.5 (-1) | 2,249 (+11%) | 8mo | $282,500 | $126 | 48 |
| 2915 Sunset Bnd | 0.58mi | 4/2.5 | 2,320 (+15%) | 1mo | $300,000 | $129 | 47 |
Match score weights: distance 35% · size 25% · config 20% · recency 20%. Top-matched comps best support the ARV.
Projected returns pro-forma
-3.0% appreciation · 0.75% rent growth · sell at horizon
- IRR
- -17.7%
- Equity multiple
- 0.39×
- Total profit
- $-34,169
- Equity at exit
- $29,776
- IRR
- -15.1%
- Equity multiple
- 0.23×
- Total profit
- $-42,855
- Equity at exit
- $17,266
Cash invested: $55,916 (down + closing). Projections, not guarantees.
Landlord ↔ Tenant lean methodology
- Overall (STATE)
- 87 Strongly Landlord-Friendly
- State Texas
- 87 Strongly Landlord-Friendly · R+5
- County
- — inherits STATE
- City
- — inherits STATE
ZIP-level market 78244
- Home prices YoY
- -4.4%
- Rents YoY
- 0.8%
- Active inventory
- 193
- Price-to-rent
- 8.9×
Monthly cashflow live
- Estimated rent
- $1,880 high interval (Pro) →
- Mortgage (P&I)
- −$1,047
- Tax from tax record
- −$319 /mo · $3,827/yr
- Insurance
- −$83
- HOA
- −$0
- Vacancy / Maint / Mgmt
- −$395
- Net cashflow
- $36
Break-even live
Sensitivity live
| Price | -10% $149 | -5% $92 | +0% $36 | +5% $-21 | +10% $-77 |
|---|---|---|---|---|---|
| Rent | -10% $-113 | -5% $-38 | +0% $36 | +5% $110 | +10% $184 |
| Rate | -1.0pp $136 | -0.5pp $87 | base $36 | +0.5pp $-16 | +1.0pp $-69 |
UW: 25.0% down · 7.5% · 30yr · 1.5% tax · 5.0% vac · 8.0% maint · 8.0% mgmt
Financing live
Cash to close
- Down payment
- $49,925
- Closing costs
- $5,991
- Reserves months
- —
- Total cash needed
- —
Loan-product check · same deal, 3 products live
Conventional
25% down · 7.5% · 30yr
- Down + closing
- —
- Monthly P&I
- —
- Monthly cashflow
- —
- DSCR
- —
- Eligible?
- —
Personal DTI + credit; lowest rate.
DSCR
20% down · 8.5% · 30yr
- Down + closing
- —
- Monthly P&I
- —
- Monthly cashflow
- —
- DSCR
- —
- Eligible?
- —
No personal income docs; deal must DSCR.
Hard money
10% down · 12.0% · 12mo
- Down + closing
- —
- Monthly P&I
- —
- Monthly cashflow
- —
- DSCR
- —
- Eligible?
- —
Short-term bridge; refi at stabilization.
Rent comps 40 comps
| Address | Beds | Baths | Sqft | Rent | $/sqft | DOM | Units | Dist |
|---|---|---|---|---|---|---|---|---|
| 3713 Candlebluff Dr San Antonio, TX | 3.0 | 2.5 | 1501 | $2,100 | $1.40 | 16d | 1 | 0.04mi |
| 3633 Candlebrook Ln San Antonio, TX | 3.0 | 2.0 | 1621 | $1,495 | $0.92 | 25d | 1 | 0.12mi |
| 3710 Candleglenn San Antonio, TX | 3.0 | 2.5 | 1582 | $1,650 | $1.04 | 5d | 1 | 0.14mi |
| 6402 Candlewick Ct San Antonio, TX | 4.0 | 2.5 | 2008 | $1,790 | $0.89 | 6d | 1 | 0.22mi |
| 6231 Post Ml San Antonio, TX | 3.0 | 2.0 | 1447 | $1,495 | $1.03 | 25d | 1 | 0.22mi |
| 6231 Post Ml San Antonio, TX | 3.0 | 2.0 | 1447 | $1,495 | $1.03 | 22d | 1 | 0.22mi |
| 2726 Candleridge Dr San Antonio, TX | 3.0 | 2.0 | 1430 | $1,349 | $0.94 | 25d | 1 | 0.23mi |
| 6523 Candlecrest Ct San Antonio, TX | 4.0 | 2.0 | 1905 | $1,930 | $1.01 | 45d | 1 | 0.31mi |
| 6458 Candleview Ct San Antonio, TX | 4.0 | 2.5 | 2008 | $1,645 | $0.82 | 6d | 1 | 0.31mi |
| 6323 Wild Flower Way San Antonio, TX | 4.0 | 2.5 | 2330 | $2,055 | $0.88 | 0d | 1 | 0.32mi |
| 6106 Candletree San Antonio, TX | 5.0 | 2.5 | 1633 | $2,600 | $1.59 | 0d | 1 | 0.33mi |
| 3643 Cameron Spgs San Antonio, TX | 3.0 | 1.5 | 1501 | $1,180 | $0.79 | 4d | 1 | 0.37mi |
| 2635 Green Leaf Way San Antonio, TX | 3.0 | 2.5 | 2344 | $1,900 | $0.81 | 25d | 1 | 0.37mi |
| 2631 Green Leaf Way San Antonio, TX | 4.0 | 2.5 | 1918 | $1,689 | $0.88 | 25d | 1 | 0.38mi |
| 6114 Hackberry Pond San Antonio, TX | 3.0 | 2.5 | 2043 | $1,695 | $0.83 | 45d | 1 | 0.40mi |
| 2615 Green Leaf Way San Antonio, TX | 4.0 | 2.5 | 2707 | $1,789 | $0.66 | 4d | 1 | 0.40mi |
| 2607 Bluff Xing San Antonio, TX | 3.0 | 2.5 | 2241 | $1,650 | $0.74 | 6d | 1 | 0.40mi |
| 2610 Green Leaf Way San Antonio, TX | 3.0 | 2.5 | 2003 | $1,995 | $1.00 | 12d | 1 | 0.42mi |
| 2638 Willow Pond San Antonio, TX | 4.0 | 2.5 | 2320 | $1,900 | $0.82 | 45d | 1 | 0.44mi |
| 3422 Dunlap Flds Converse, TX | 3.0 | 2.0 | 1450 | $1,540 | $1.06 | 22d | 1 | 0.52mi |
| 2606 Yaupon Rnch San Antonio, TX | 4.0 | 2.5 | 2398 | $2,500 | $1.04 | 0d | 1 | 0.52mi |
| 6503 Davenport Bay Converse, TX | 3.0 | 2.0 | 1494 | $1,786 | $1.20 | 0d | 1 | 0.53mi |
| 2414 Indian Frst San Antonio, TX | 3.0 | 2.0 | 1604 | $1,495 | $0.93 | 22d | 1 | 0.53mi |
| 2414 Indian Frst San Antonio, TX | 3.0 | 2.0 | 1604 | $1,495 | $0.93 | 25d | 1 | 0.53mi |
| 4122 Alaskian Sunrise San Antonio, TX | 3.0 | 2.0 | 1454 | $1,495 | $1.03 | 45d | 1 | 0.54mi |
| 2338 Camberly Vw Converse, TX | 4.0 | 3.0 | 2122 | $1,850 | $0.87 | 25d | 1 | 0.57mi |
| 2623 Barbwire Way San Antonio, TX | 4.0 | 2.5 | 2323 | $1,900 | $0.82 | 23d | 1 | 0.57mi |
| 6022 Foster Bnd San Antonio, TX | 5.0 | 3.0 | 2847 | $2,600 | $0.91 | 12d | 1 | 0.58mi |
| 6615 Port Elizabeth Converse, TX | 3.0 | 2.0 | 1596 | $1,489 | $0.93 | 6d | 1 | 0.58mi |
| 6014 Foster Bnd San Antonio, TX | 4.0 | 3.0 | 2268 | $1,895 | $0.84 | 5d | 1 | 0.59mi |
| 6510 Poseidon Way Converse, TX | 3.0 | 2.0 | 1408 | $1,539 | $1.09 | 4d | 1 | 0.64mi |
| 6703 Foster Flds Converse, TX | 4.0 | 2.0 | 1894 | $1,850 | $0.98 | 16d | 1 | 0.64mi |
| 6527 San Miguel Way Converse, TX | 3.0 | 2.5 | 2042 | $1,475 | $0.72 | 45d | 1 | 0.67mi |
| 3302 Uresti Flds Converse, TX | 3.0 | 2.5 | 2451 | $1,950 | $0.80 | 6d | 1 | 0.69mi |
| 6634 Poseidon Way Converse, TX | 4.0 | 2.5 | 1990 | $1,750 | $0.88 | 45d | 1 | 0.70mi |
| 6634 Poseidon Way Converse, TX | 4.0 | 2.5 | 1990 | $1,750 | $0.88 | 23d | 1 | 0.70mi |
| 5910 Summer Fest Dr San Antonio, TX | 3.0 | 2.5 | 1812 | $2,150 | $1.19 | 45d | 1 | 0.74mi |
| 5990 Catalina Sunrise Dr San Antonio, TX | 4.0 | 3.0 | 1600 | $1,600 | $1.00 | 3d | 1 | 0.77mi |
| 2715 Point Sur Converse, TX | 4.0 | 2.5 | 2056 | $1,785 | $0.87 | 6d | 1 | 0.77mi |
| 2409 Key Hole Vw Converse, TX | 3.0 | 2.0 | 1602 | $1,600 | $1.00 | 14d | 1 | 0.80mi |
Listing history 17 events
-
2025-06-23status Pending
-
2025-05-27$199,700 New
-
2020-12-28soldstatus
-
2017-07-25soldstatus
-
2017-07-01historical
-
2017-06-20price $139,900
-
2017-06-05price $148,500
-
2017-05-29price $150,999
-
2017-05-18price $151,000
-
2017-04-21status Back on Market
-
2017-04-10historical Active Option
-
2017-03-27price $155,000
-
2017-03-19$169,000 New
-
2005-02-08soldstatus 221-char remark
Show marketing remark (221 chars)
PC1074 GREAT OPPORTUNITY TO BUILD YOUR OWN EQUITY! SOLD 'AS-IS.' SELLER EXEMPT FROM DISCLOSURE. PROVIDE PREQUAL LETTER OR PROOF OF FUNDS WITH OFFER. SELLER WILL COUNTER ON ADDENDUMS. FAX ALL OFFERS TO CATHY AT 525-8623.
-
2004-11-30$83,900 221-char remark
Show marketing remark (221 chars)
PC1074 GREAT OPPORTUNITY TO BUILD YOUR OWN EQUITY! SOLD 'AS-IS.' SELLER EXEMPT FROM DISCLOSURE. PROVIDE PREQUAL LETTER OR PROOF OF FUNDS WITH OFFER. SELLER WILL COUNTER ON ADDENDUMS. FAX ALL OFFERS TO CATHY AT 525-8623.
-
1998-04-28soldstatus
-
1995-07-01soldstatus
ⓘ Source: listings_history table (triggers on properties + properties_extension) + one-shot
backfill from property_details.listing_events for pre-trigger history.
Tax reassessment forecast TX · Resets to sale price
- Current annual tax
- $3,827 · $319/mo
- Projected year-2 tax
- $3,827 · $319/mo
- Expected delta
- $0/yr ($0/mo · 0.0%)
ⓘ Screening estimate from a state-policy table — verify with the county assessor before closing.
Climate risk First Street
- Flood 1/10 Low FEMA zone X (unshaded) · 0% chance over 30 yrs
- Wildfire 4/10 Moderate
- Heat 8/10 Severe 7 d/yr ≥108°F today · 22 d/yr by 30 yrs out
- Wind 8/10 Severe 80% chance of damaging wind over 30 yrs
- Air quality 2/10 Low 0 unhealthy d/yr today · 1 by 30 yrs out
Nearby sold comps map
Loading sold comps map…
Walkable amenities ~0.75 mi
Loading nearby amenities…
Taxation est. · year 1
- Rental income
- $22,561
- − Mortgage interest
- −$11,186
- − Property taxes
- −$3,827
- − Insurance
- −$998
- − Repairs & maintenance
- −$1,805
- − Management
- −$1,805
- − Depreciation
- −$5,809
- Taxable loss
- −$2,871
- Est. tax savings @ 24.0%
- +$689
- After-tax cash flow
- $1,119/yr
For passive investors: Depreciation is non-cash, so a rental often shows a tax loss while cash-flowing — sheltering income. Rental losses are passive: they offset passive income freely, and up to $25,000/yr can offset ordinary (W-2) income if you actively participate and your MAGI is under $100k (phasing out to $0 by $150k); unused losses carry forward. On sale, claimed depreciation is recaptured at up to 25%, and gains may owe capital-gains tax (a 1031 exchange can defer both). Figures are a year-1 estimate at your 24.0% rate — not tax advice; consult a CPA.
Schools (NCES district)
- District
- Judson ISD
- NCES district ID
- 4824990
- Math proficiency
- 21% ▼ -21.00%
- Reading proficiency
- 33% ▼ -7.00%
- Median HH income
- $57,542
- Composite
- 24.39/100
- National rank
- #7689
- State rank
- #660 of 826 in TX
Livability — San Antonio
- Score
- 80/100
- State rank
- #31
- US rank
- #1616
Category grades
Schools grade is shown separately in the Schools card above.
Census & demographics
- County
- Bexar County · 1,990,555 people
- City population
- 1,806,925
- Metro
- San Antonio-New Braunfels, TX
- Population (ZIP)
- 38,092
- Household income
- $71,128
- Rent vs Own
- Severe rent burden
- 677.0
Population outlook (Bexar County) Hauer SSP2
- Today (2025)
- 2,336,851 people
- By 2030
- 2,560,728 · +9.6%
- By 2040
- 3,020,569 · +29.3%
- By 2050
- 3,493,522 · +49.5%
- By 2075
- 4,668,459 · +99.8%
- By 2100
- 5,533,242 · +136.8%
Race, ethnicity, and origin ACS 2023
- Neighborhood character
- Diverse neighborhood (Simpson 0.68)
- Race & ethnicity
- Hispanic / Latino 46% Black 27% Two or more races 24% White 20% Asian 2%
- Hispanic origin (detail)
- Mexican 38% Puerto Rican 2% Cuban 2%
- Common ancestry
- Slovak 2% Lithuanian 1% Italian 1%
- Foreign-born
- 14% · Canada, Vietnam
- Languages at home
- 68% English-only · Spanish 28% Vietnamese 1% Tagalog/Filipino 1%
Political lean MEDSL · Bexar
- 2024 margin
- Lean D (+9.8) · D 54.3% · R 44.6% · Other 1.1%
- 2008→2024 swing
- +4.2pp toward D · 2008: 5.6pp · 2024: 9.8pp
- All cycles
- 2024: D+9.8 2020: D+18.2 2016: D+13.5 2012: D+4.6 2008: D+5.6
Not yet ingested
- Civics
- —
Market trends
- HPI YoY
- ▼ -11.42%
- Current HPI
- 249.3834
- Rent YoY
- ▲ 0.75%
- Metro
- San Antonio-New Braunfels, TX
- State GDP YoY
- ▲ 3.95%
- F500 in state
- 110
Industry mix (Fortune 500 HQ in TX)
| Industry | F500 HQs | Revenue |
|---|---|---|
| Energy | 16 | $1,198B |
|
||
| Technology | 5 | $198B |
|
||
| Engineering / Construction | 4 | $72B |
|
||
| Energy Services | 3 | $60B |
|
||
| Utilities | 3 | $41B |
|
||
| Healthcare | 2 | $330B |
|
||
Price history
+138.0% since first listed17 events — show timeline
- 2025-06-23 Pending — LERA
- 2025-05-27 Listed $199,700 LERA
- 2020-12-28 Sold (Public Records) — Public Records
- 2017-07-25 Sold (Public Records) — Public Records
- 2017-07-01 Listing Removed — LERA
- 2017-06-20 Price Changed $139,900 LERA
- 2017-06-05 Price Changed $148,500 LERA
- 2017-05-29 Price Changed $150,999 LERA
- 2017-05-18 Price Changed $151,000 LERA
- 2017-04-21 Relisted — LERA
- 2017-04-10 Contingent — LERA
- 2017-03-27 Price Changed $155,000 LERA
- 2017-03-19 Listed $169,000 LERA
- 2005-02-08 Sold (MLS) — LERA
- 2004-11-30 Listed $83,900 LERA
- 1998-04-28 Sold (Public Records) — Public Records
- 1995-07-01 Sold (Public Records) — Public Records
Property tax history
+12.6%/yrLatest (2025): $3,827 · -1.1% YoY. Source: county tax records.
Cash-flow waterfall
monthlySold comps — $/sqft
last 12 mo · ≤1 miLoading sold comps…