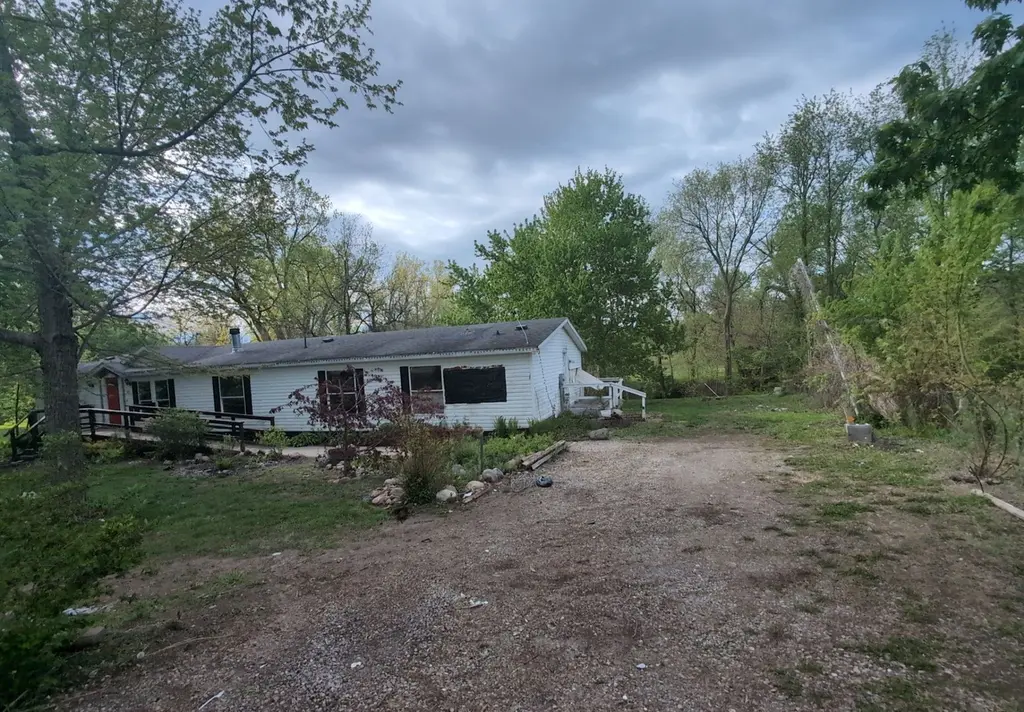
403 W Main St · Mingo, IA
Flood risk 1/10 · Minimal
- FEMA flood zone
- X (unshaded)
- Chance of flooding over 30 yrs
- 0.0%
- Est. flood insurance / yr
- $507 – $1,088
Fire risk 1/10 · Minimal
- Est. fire insurance / yr
- $902 – $1,676
Heat risk 3/10 · Minor
- Hot days now (above 104°F)
- 7 days/yr
- Hot days in 30 yrs
- 15 days/yr
Wind risk 2/10 · Minimal
- Chance of severe wind over 30 yrs
- —
Air-quality risk 2/10 · Minimal
- Unhealthy air days now
- 0 days/yr
- Unhealthy air days in 30 yrs
- 1 days/yr
Risk factors via First Street. Map © Google.
Why this score? — see what drove the B+ grade
The composite is a weighted blend of 9 inputs, each scored 0–100. Each bar is that input's sub-score; the figure is the points it added to the 100-point composite (weight × sub-score).
- Cash flow +30.0/30.0
- DSCR +10.0/10.0
- 1% rule +9.5/10.0
- ARV discount +7.5/15.0
- Appreciation +7.3/10.0
- Schools +5.4/10.0
- Livability +3.0/5.0
- Rent growth +2.5/5.0
- Condition / age +2.5/5.0
$89,900
🖨 Deal sheet 📄 Offer letter ✓ Due diligence
Listing remarks
Spacious ranch-style home offering 4 bedrooms and 3 bathrooms on over an acre of land, giving you plenty of room to spread out and enjoy. With multiple areas to relax and unwind, this property provides the space and comfort you've been looking for. Conveniently located just minutes from parks and the bike path, you'll enjoy the perfect blend of privacy and accessibility.
Key facts
- Ranch-style home
- Over an acre of land
- Minutes from parks
Tags
Property features AI
Exterior
- Utilities: Public water; Public sewer
- Home design: Vinyl siding; Asphalt shingle roof
- Construction: Vinyl siding construction; Asphalt shingle roof
- Exterior features: Asphalt road access; Residential zoning
Interior
- Bedrooms: 4 main-level bedrooms
- Bathrooms: 3 full bathrooms
- Heating & cooling: Central air; Forced air heat (natural gas)
- Interior features: Central air conditioning; Forced air heating (natural gas)
Neighborhood map
What this means for you Summary
Snapshot
- This is a 4-bed/3.0-bath single-family listed at $90k.
Deal economics
- At list price, monthly cash flow is $369 ($4k/yr) — positive.
- The deal already cash-flows at list — no discount required.
- Meets the 1% rule at list price ($1k rent vs $90k).
- Recommended offer: $87k (3.0% below list) — sets the bar for market timing.
Location & tenants
- Location reads 60/100 on livability (#835 in IA) — a middle-class / working-renter tenant base. Strengths: cost of living A+, housing B+; Watch: employment D, schools D-, amenities F.
- Colfax-Mingo Community School District (rural): math 59% / reading 66% proficiency, ranked #213 of 289 in IA (top 74%) — acceptable for families but not a draw, mixed tenant base, ~2y average lease.
- Market conditions: 31 active listings in the ZIP; 16 units permitted in Jasper County in 2024 (0 in 5+ unit buildings).
Forward outlook
- In year one you build about $5k of equity ($622 loan paydown + $4k appreciation (4.5% local appreciation)).
- Jasper County population projected to shrink 7% by 2050 — rents likely to lag national; underwrite the cash flow, not the appreciation.
- At projected returns (4.5% appreciation + 3.0% rent growth), your $25k cash investment doubles in ~3 years — after that, you're playing with house money.
- By year 7, paydown + projected appreciation supports a ~$30k cash-out refi (75% LTV) — recoverable capital for the next deal without selling this one.
Negotiation context
- It's been on market 31 days — a 3% lower offer ($87k) is reasonable based on typical stale-listing flexibility.
Questions for the listing agent
- It's been on market 31 days. Have you received any prior offers? Is the seller open to a 3% concession, seller financing, or rate buy-down credit?
- Is there a deadline driving the sale (1031 exchange, divorce, estate, relocation)? That informs how much negotiation room exists.
- Schools are D-rated, which usually means shorter tenancies and higher turnover. Who's the typical renter profile here, and what's been the actual vacancy rate?
- What's the average days-on-market for RENTAL listings here right now (not sales)? A rising rental-DOM trend means longer vacancies and softer asking-rent achievability than the comps imply.
- What's the recent tenant-quality profile in this submarket — average credit score on applications, eviction rate, late-payment / NSF rate, and stable-employment percentage? A property-management company in the area should have these aggregated.
- How much new for-sale + rental construction is in the pipeline within 1–3 miles? Heavy new supply typically softens prices + rents 12–24 months out; constrained supply supports both.
Investment metrics
- 1% rule
- 1.45% ✓
- Cap rate
- 11.22%
- Cash-on-cash
- 17.61%
- DSCR
- 1.78
- GRM
- 5.8
CMA / ARV
- ARV (on-the-fly)
- $312,208
- Comps found
- 2
Show comp detail 2 sales within ~0.75 mi
| Address | Dist | Beds/Ba | Sqft | Sold | Price | $/sf | Match |
|---|---|---|---|---|---|---|---|
| 204 E Bluff St | 0.36mi | 4/3.0 | 1,720 (-13%) | 19mo | $270,000 | $157 | 46 |
| 210 Davenport St | 0.62mi | 3/2.0 (-1) | 1,690 (-14%) | 2mo | $267,500 | $158 | 36 |
Match score weights: distance 35% · size 25% · config 20% · recency 20%. Top-matched comps best support the ARV.
Projected returns pro-forma
4.55% appreciation · 3.0% rent growth · sell at horizon
- IRR
- 27.3%
- Equity multiple
- 2.67×
- Total profit
- $41,991
- Equity at exit
- $48,506
- IRR
- 26.5%
- Equity multiple
- 5.28×
- Total profit
- $107,844
- Equity at exit
- $81,765
Cash invested: $25,172 (down + closing). Projections, not guarantees.
Landlord ↔ Tenant lean methodology
- Overall (STATE)
- 83 Strongly Landlord-Friendly
- State Iowa
- 83 Strongly Landlord-Friendly · R+6
- County
- — inherits STATE
- City
- — inherits STATE
ZIP-level market 50168
- Home prices YoY
- 3.1%
- Active inventory
- 31
- Price-to-rent
- 5.8×
Monthly cashflow live
- Estimated rent
- $1,300 medium interval (Pro) →
- Mortgage (P&I)
- −$471
- Tax from tax record
- −$149 /mo · $1,786/yr
- Insurance
- −$37
- HOA
- −$0
- Vacancy / Maint / Mgmt
- −$273
- Net cashflow
- $369
Break-even live
UW: 25.0% down · 7.5% · 30yr · 1.5% tax · 5.0% vac · 8.0% maint · 8.0% mgmt
Financing live
Cash to close
- Down payment
- $22,475
- Closing costs
- $2,697
- Reserves months
- —
- Total cash needed
- —
Loan-product check · same deal, 3 products live
Conventional
25% down · 7.5% · 30yr
- Down + closing
- —
- Monthly P&I
- —
- Monthly cashflow
- —
- DSCR
- —
- Eligible?
- —
Personal DTI + credit; lowest rate.
DSCR
20% down · 8.5% · 30yr
- Down + closing
- —
- Monthly P&I
- —
- Monthly cashflow
- —
- DSCR
- —
- Eligible?
- —
No personal income docs; deal must DSCR.
Hard money
10% down · 12.0% · 12mo
- Down + closing
- —
- Monthly P&I
- —
- Monthly cashflow
- —
- DSCR
- —
- Eligible?
- —
Short-term bridge; refi at stabilization.
Listing history 17 events
-
2026-06-18days on market $89,900 Active 31 DOM
-
2026-06-17days on market $89,900 Active 30 DOM
-
2026-06-16days on market $89,900 Active 29 DOM
-
2026-06-15days on market $89,900 Active 28 DOM
-
2026-06-14days on market $89,900 Active 26 DOM
-
2026-06-13days on market $89,900 Active 25 DOM
-
2026-06-10days on market $89,900 Active 23 DOM
-
2026-06-09days on market $89,900 Active 22 DOM
-
2026-06-08days on market $89,900 Active 21 DOM
-
2026-06-07days on market $89,900 Active 20 DOM
-
2026-06-05days on market $89,900 Active 17 DOM
-
2026-06-03days on market $89,900 Active 16 DOM
-
2026-06-02days on market $89,900 Active 15 DOM
-
2026-06-01days on market $89,900 Active 14 DOM
-
2026-05-31days on market $89,900 Active 13 DOM
-
2026-05-31days on market $89,900 Active 12 DOM
-
2026-05-18$89,900 Active
ⓘ Source: listings_history table (triggers on properties + properties_extension) + one-shot
backfill from property_details.listing_events for pre-trigger history.
Tax reassessment forecast IA · Partial reset (capped growth)
- Current annual tax
- $1,786 · $149/mo
- Projected year-2 tax
- $1,786 · $149/mo
- Expected delta
- $0/yr ($0/mo · 0.0%)
ⓘ Screening estimate from a state-policy table — verify with the county assessor before closing.
Climate risk First Street
- Flood 1/10 Low FEMA zone X (unshaded) · 0% chance over 30 yrs
- Wildfire 1/10 Low
- Heat 3/10 Moderate 7 d/yr ≥104°F today · 15 d/yr by 30 yrs out
- Wind 2/10 Low
- Air quality 2/10 Low 0 unhealthy d/yr today · 1 by 30 yrs out
Nearby sold comps map
Loading sold comps map…
Walkable amenities ~0.75 mi
Loading nearby amenities…
Taxation est. · year 1
- Rental income
- $15,601
- − Mortgage interest
- −$5,036
- − Property taxes
- −$1,786
- − Insurance
- −$450
- − Repairs & maintenance
- −$1,248
- − Management
- −$1,248
- − Depreciation
- −$2,615
- Taxable income
- $3,218
- Est. tax owed @ 24.0%
- −$772
- After-tax cash flow
- $3,659/yr
For passive investors: Depreciation is non-cash, so a rental often shows a tax loss while cash-flowing — sheltering income. Rental losses are passive: they offset passive income freely, and up to $25,000/yr can offset ordinary (W-2) income if you actively participate and your MAGI is under $100k (phasing out to $0 by $150k); unused losses carry forward. On sale, claimed depreciation is recaptured at up to 25%, and gains may owe capital-gains tax (a 1031 exchange can defer both). Figures are a year-1 estimate at your 24.0% rate — not tax advice; consult a CPA.
Schools (NCES district)
- District
- Colfax-Mingo Community School District
- NCES district ID
- 1900009
- Math proficiency
- 59% ▼ -2.00%
- Reading proficiency
- 66% ▲ 7.00%
- Median HH income
- $53,956
- Composite
- 53.51/100
- National rank
- #1450
- State rank
- #213 of 289 in IA
Livability — Mingo
- Score
- 60/100
- State rank
- #835
- US rank
- #19238
Category grades
Schools grade is shown separately in the Schools card above.
Census & demographics
- Census place
- Mingo, IA
- Population (ZIP)
- 829
Population outlook (Jasper County) Hauer SSP2
- Today (2025)
- 36,216 people
- By 2030
- 35,730 · -1.3%
- By 2040
- 34,727 · -4.1%
- By 2050
- 33,802 · -6.7%
- By 2075
- 33,382 · -7.8%
- By 2100
- 32,761 · -9.5%
Race, ethnicity, and origin ACS 2023
- Neighborhood character
- Predominantly White (95%)
- Race & ethnicity
- White 95% Two or more races 4%
- Common ancestry
- Iranian 4% Portuguese 4% Romanian 4%
- Languages at home
- 99% English-only · French/Haitian/Cajun 1%
Political lean MEDSL · Jasper
- 2024 margin
- Strong R (+27.6) · D 35.4% · R 63.0% · Other 1.5%
- 2008→2024 swing
- -35.1pp toward R · 2008: 7.5pp · 2024: -27.6pp
- All cycles
- 2024: R+27.6 2020: R+21.5 2016: R+18.4 2012: D+7.1 2008: D+7.5
Not yet ingested
- Civics
- —
Market trends
- HPI YoY
- ▲ 4.55%
- Current HPI
- 152.6455
- Rent YoY
- —
- Metro
- —
- State GDP YoY
- ▲ 2.48%
- F500 in state
- 4
Industry mix (Fortune 500 HQ in IA)
| Industry | F500 HQs | Revenue |
|---|---|---|
| Financial Services | 1 | $16B |
|
||
| Retail / Convenience | 1 | $15B |
|
||
Price history
1 event — show timeline
- 2026-05-18 Listed $89,900 DMMLS
Property tax history
+0.2%/yrLatest (2025): $1,786 · +0.4% YoY. Source: county tax records.
Cash-flow waterfall
monthlySold comps — $/sqft
last 12 mo · ≤1 miLoading sold comps…