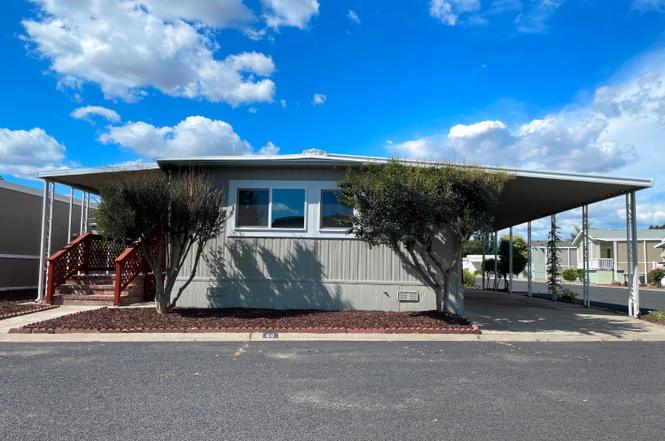
18450 N Highway 88 #60 · Lockeford, CA
Flood risk 1/10 · Minimal
- FEMA flood zone
- X (unshaded)
- Chance of flooding over 30 yrs
- 0.0%
- Est. flood insurance / yr
- $507 – $1,088
Fire risk 6/10 · Moderate
- Est. fire insurance / yr
- $659 – $1,223
Heat risk 7/10 · Major
- Hot days now (above 102°F)
- 7 days/yr
- Hot days in 30 yrs
- 14 days/yr
Wind risk 1/10 · Minimal
- Chance of severe wind over 30 yrs
- —
Air-quality risk 10/10 · Severe
- Unhealthy air days now
- 27 days/yr
- Unhealthy air days in 30 yrs
- 30 days/yr
Risk factors via First Street. Map © Google.
Why this score? — see what drove the B- grade
The composite is a weighted blend of 9 inputs, each scored 0–100. Each bar is that input's sub-score; the figure is the points it added to the 100-point composite (weight × sub-score).
- Cash flow +26.6/30.0
- ARV discount +15.0/15.0
- DSCR +9.1/10.0
- 1% rule +7.1/10.0
- Schools +2.7/10.0
- Livability +2.7/5.0
- Rent growth +2.5/5.0
- Condition / age +2.5/5.0
- Appreciation +0.0/10.0
$114,900
🖨 Deal sheet 📄 Offer letter ✓ Due diligence
Listing remarks
Welcome to a Place to Call Home, where Comfort, Calm and Everyday Luxury come together effortlessly. From the moment you arrive, you're Greeted by an Inviting Atmosphere that Radiates Warmth, Serenity, and Pride of Ownership. Fully Remodeled in 2025. This Home is located in the Desirable Double L Mobile Estates, a Peaceful and Quiet Senior 55+ Community in the Heart of Lockeford. Upgrades and Renewed Attention to Detail, this Corner‑lot Home features a Two‑car Covered Carport, a Newly painted Two‑way Covered Front porch Deck with New Carpeting, and an Updated rear Porch. The Exterior includes Newly painted Aluminum Siding, New wood Skirting, a Newly sealed Metal Roof, Concrete patio Areas,
Key facts
- Updated rear porch
- Fully remodeled
- New wood skirting
Tags
Neighborhood map
What this means for you Summary
Snapshot
- This is a 3-bed/2.0-bath manufactured listed at $115k.
Deal economics
- At list price, monthly cash flow is $307 ($4k/yr) — positive.
- The deal already cash-flows at list — no discount required.
- Meets the 1% rule at list price ($1k rent vs $115k).
- Cap rate 9.5% vs local median 1.0% in Lockeford — top-decile yield for the area; either an underpriced asset or a hidden risk that comps aren't pricing in. Stress-test before assuming the spread holds.
Location & tenants
- Location reads 53/100 on livability (#960 in CA) — a working-class tenant base; expect higher turnover. Strengths: housing A+, crime B+, employment B+; Watch: schools F, amenities F, commute F.
- Lodi Unified (urban): math 24% / reading 36% proficiency, ranked #325 of 517 in CA (top 63%) — families likely to look elsewhere, expect single-tenant / working-renter base with shorter leases.
- Market conditions: 24 active listings in the ZIP; 3,779 units permitted in San Joaquin County in 2024 (0 in 5+ unit buildings).
Forward outlook
- Local home prices are declining (-3.0%/yr); year-one equity from $794 of loan paydown is wiped out by about $3k of value loss. Plan a longer hold.
- San Joaquin County population projected at +17% by 2050 — long-run rental-demand tailwind backs the buy-and-hold thesis.
- At projected returns (-3.0% appreciation + 3.0% rent growth), your $32k cash investment doubles in ~10 years — after that, you're playing with house money.
Negotiation context
- Only 7 days on market — expect competitive offers; lowballing is unlikely to land.
Risks & watch-outs
- Climate carrying-cost: major wildfire risk; extreme-heat days projected 7→14/yr by 2055 (HVAC capex compounding) — expect insurance premiums to compound above CPI over the hold.
Questions for the listing agent
- Built in 1966 — when were the roof, HVAC, electrical panel, plumbing, and water heater last replaced?
- Is there a deadline driving the sale (1031 exchange, divorce, estate, relocation)? That informs how much negotiation room exists.
- Schools are F-rated, which usually means shorter tenancies and higher turnover. Who's the typical renter profile here, and what's been the actual vacancy rate?
- What's the average days-on-market for RENTAL listings here right now (not sales)? A rising rental-DOM trend means longer vacancies and softer asking-rent achievability than the comps imply.
- What's the recent tenant-quality profile in this submarket — average credit score on applications, eviction rate, late-payment / NSF rate, and stable-employment percentage? A property-management company in the area should have these aggregated.
- How much new for-sale + rental construction is in the pipeline within 1–3 miles? Heavy new supply typically softens prices + rents 12–24 months out; constrained supply supports both.
Investment metrics
- 1% rule
- 1.21% ✓
- Cap rate
- 9.50%
- Cash-on-cash
- 11.47%
- DSCR
- 1.51
- GRM
- 6.9
CMA / ARV
- ARV (median comp)
- $155,451
- List price
- $114,900
- Delta
- -24.16%
- Verdict
- UNDERPRICED
- Comps
- 3 within 1.0 mi
Projected returns pro-forma
-3.0% appreciation · 3.0% rent growth · sell at horizon
- IRR
- 0.8%
- Equity multiple
- 1.03×
- Total profit
- $984
- Equity at exit
- $17,132
- IRR
- 10.5%
- Equity multiple
- 1.81×
- Total profit
- $26,158
- Equity at exit
- $9,934
Cash invested: $32,172 (down + closing). Projections, not guarantees.
Landlord ↔ Tenant lean methodology
- Overall (STATE)
- 18 Strongly Tenant-Friendly
- State California
- 18 Strongly Tenant-Friendly · D+13
- County
- — inherits STATE
- City
- — inherits STATE
ZIP-level market 95237
- Home prices YoY
- -26.6%
- Active inventory
- 24
- Price-to-rent
- 6.9×
Monthly cashflow live
- Estimated rent
- $1,394 medium interval (Pro) →
- Mortgage (P&I)
- −$603
- Tax est. 1.5%
- −$144 /mo · $1,724/yr
- Insurance
- −$48
- HOA
- −$0
- Vacancy / Maint / Mgmt
- −$293
- Net cashflow
- $307
Break-even live
UW: 25.0% down · 7.5% · 30yr · 1.5% tax · 5.0% vac · 8.0% maint · 8.0% mgmt
Financing live
Cash to close
- Down payment
- $28,725
- Closing costs
- $3,447
- Reserves months
- —
- Total cash needed
- —
Loan-product check · same deal, 3 products live
Conventional
25% down · 7.5% · 30yr
- Down + closing
- —
- Monthly P&I
- —
- Monthly cashflow
- —
- DSCR
- —
- Eligible?
- —
Personal DTI + credit; lowest rate.
DSCR
20% down · 8.5% · 30yr
- Down + closing
- —
- Monthly P&I
- —
- Monthly cashflow
- —
- DSCR
- —
- Eligible?
- —
No personal income docs; deal must DSCR.
Hard money
10% down · 12.0% · 12mo
- Down + closing
- —
- Monthly P&I
- —
- Monthly cashflow
- —
- DSCR
- —
- Eligible?
- —
Short-term bridge; refi at stabilization.
Listing history 8 events
-
2026-06-18days on market $114,900 Active 7 DOM
-
2026-06-17days on market $114,900 Active 6 DOM
-
2026-06-16days on market $114,900 Active 5 DOM
-
2026-06-15days on market $114,900 Active 4 DOM
-
2026-06-14remarks 699-char remark
-
2026-06-14pricestatusdays on market $114,900 Active 2 DOM
-
2025-05-12price $139,900
-
2025-05-02$149,900 Active
ⓘ Source: listings_history table (triggers on properties + properties_extension) + one-shot
backfill from property_details.listing_events for pre-trigger history.
Climate risk First Street
- Flood 1/10 Low FEMA zone X (unshaded) · 0% chance over 30 yrs
- Wildfire 6/10 Major
- Heat 7/10 Severe 7 d/yr ≥102°F today · 14 d/yr by 30 yrs out
- Wind 1/10 Low
- Air quality 10/10 Extreme 27 unhealthy d/yr today · 30 by 30 yrs out
Nearby sold comps map
Loading sold comps map…
Walkable amenities ~0.75 mi
Loading nearby amenities…
Taxation est. · year 1
- Rental income
- $16,732
- − Mortgage interest
- −$6,436
- − Property taxes
- −$1,724
- − Insurance
- −$574
- − Repairs & maintenance
- −$1,339
- − Management
- −$1,339
- − Depreciation
- −$3,343
- Taxable income
- $1,978
- Est. tax owed @ 24.0%
- −$475
- After-tax cash flow
- $3,215/yr
For passive investors: Depreciation is non-cash, so a rental often shows a tax loss while cash-flowing — sheltering income. Rental losses are passive: they offset passive income freely, and up to $25,000/yr can offset ordinary (W-2) income if you actively participate and your MAGI is under $100k (phasing out to $0 by $150k); unused losses carry forward. On sale, claimed depreciation is recaptured at up to 25%, and gains may owe capital-gains tax (a 1031 exchange can defer both). Figures are a year-1 estimate at your 24.0% rate — not tax advice; consult a CPA.
Schools (NCES district)
- District
- Lodi Unified
- NCES district ID
- 0622230
- Math proficiency
- 24% ▼ -8.00%
- Reading proficiency
- 36% ▼ -8.00%
- Median HH income
- $57,165
- Composite
- 26.84/100
- National rank
- #7108
- State rank
- #325 of 517 in CA
Livability — Lockeford
- Score
- 53/100
- State rank
- #960
- US rank
- #24499
Category grades
Schools grade is shown separately in the Schools card above.
Census & demographics
- Census place
- Lockeford, CA
- City population
- 54,435
- Population (ZIP)
- 3,753
Population outlook (San Joaquin County) Hauer SSP2
- Today (2025)
- 796,965 people
- By 2030
- 828,849 · +4.0%
- By 2040
- 885,611 · +11.1%
- By 2050
- 929,798 · +16.7%
- By 2075
- 994,578 · +24.8%
- By 2100
- 971,291 · +21.9%
Race, ethnicity, and origin ACS 2023
- Neighborhood character
- Majority White (61%)
- Race & ethnicity
- White 61% Hispanic / Latino 33% Two or more races 9% Native American 4%
- Hispanic origin (detail)
- Mexican 30%
- Common ancestry
- Italian 6% Scotch-Irish 4% Iranian 4%
- Foreign-born
- 10% · Canada
- Languages at home
- 73% English-only · Spanish 25% German/W. Germanic 1% Other Asian/Pacific 1%
Political lean MEDSL · San Joaquin
- 2024 margin
- Toss-up / Even · D 48.0% · R 48.9% · Other 3.0%
- 2008→2024 swing
- -11.6pp toward R · 2008: 10.7pp · 2024: -0.9pp
- All cycles
- 2024: R+0.9 2020: D+13.9 2016: D+12.9 2012: D+8.9 2008: D+10.7
Not yet ingested
- Civics
- —
Market trends
- HPI YoY
- ▼ -116.85%
- Current HPI
- 321.7301
- Rent YoY
- —
- Metro
- —
- State GDP YoY
- ▲ 3.21%
- F500 in state
- 116
Industry mix (Fortune 500 HQ in CA)
| Industry | F500 HQs | Revenue |
|---|---|---|
| Technology | 27 | $1,492B |
|
||
| Financial Services | 3 | $174B |
|
||
| Retail | 3 | $44B |
|
||
| Insurance | 3 | $26B |
|
||
| Media / Entertainment | 2 | $115B |
|
||
| Pharmaceuticals / Biotech | 2 | $62B |
|
||
Price history
-6.7% since first listed2 events — show timeline
- 2025-05-12 Price Changed $139,900 BAREIS
- 2025-05-02 Listed $149,900 BAREIS
Cash-flow waterfall
monthlySold comps — $/sqft
last 12 mo · ≤1 miLoading sold comps…