 🏗️ New Construction
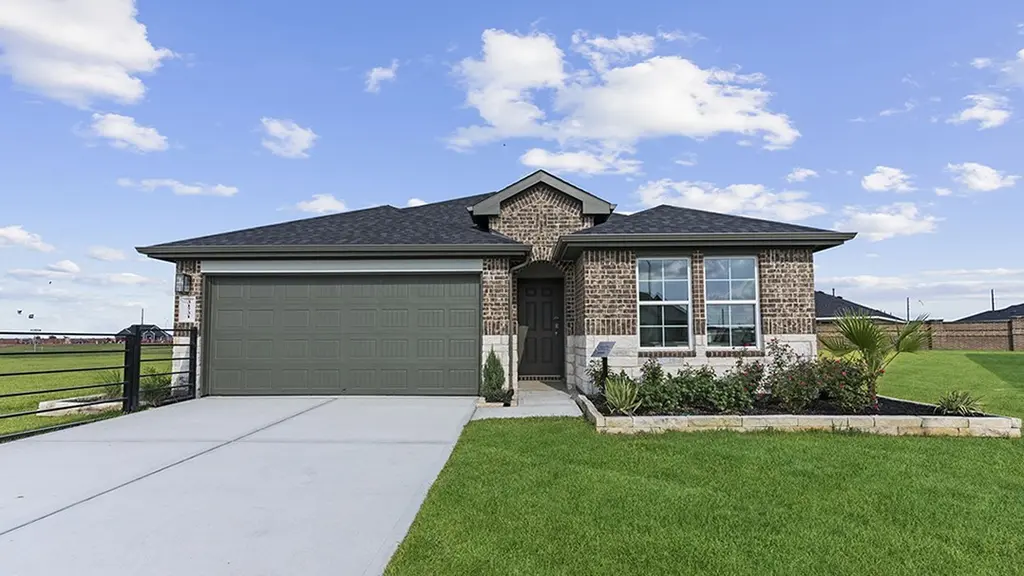
3039 Holland Lakes Dr · Fulshear, TX
Flood risk 6/10 · Moderate
- FEMA flood zone
- X (unshaded)
- Chance of flooding over 30 yrs
- 0.73%
- Est. flood insurance / yr
- $507 – $1,088
Fire risk 4/10 · Minor
- Est. fire insurance / yr
- $1,222 – $2,270
Heat risk 9/10 · Severe
- Hot days now (above 110°F)
- 7 days/yr
- Hot days in 30 yrs
- 22 days/yr
Wind risk 9/10 · Severe
- Chance of severe wind over 30 yrs
- 99.0%
Air-quality risk 2/10 · Minimal
- Unhealthy air days now
- 1 days/yr
- Unhealthy air days in 30 yrs
- 1 days/yr
Risk factors via First Street. Map © Google.
Why this score? — see what drove the F grade
The composite is a weighted blend of 9 inputs, each scored 0–100. Each bar is that input's sub-score; the figure is the points it added to the 100-point composite (weight × sub-score).
- ARV discount +7.5/15.0
- Cash flow +7.0/30.0
- Schools +5.7/10.0
- Condition / age +4.0/5.0
- Livability +3.5/5.0
- 1% rule +2.2/10.0
- Rent growth +2.1/5.0
- DSCR +1.2/10.0
- Appreciation +0.0/10.0
$314,990
🖨 Deal sheet (PDF) 📄 Offer letter ✓ Due diligence
Listing remarks
MOVE IN READY. Discover The Gaven at Tamarron, offering 1,778 sq. ft. in the vibrant city of Fulshear. Featuring 4 bedrooms and 2 full bathrooms, this layout combines modern comfort with a timeless style. The kitchen boasts granite countertops, stainless steel appliances, and an oversized island that seamlessly connects to the dining and family rooms. Expansive windows fill the main living areas with natural light and offer a picturesque view of the covered back patio and fenced backyard. The primary suite serves as a luxurious retreat with a large walk-in closet, dual sinks, and a walk-in shower (optional separate tub and shower). Each secondary bedroom features plush carpeting and spaciou
Key facts
- Covered back patio
- Large walk-in closet
- Granite countertops
Tags
Property features AI
Finance
- HOA & community: Inframark community association; Annual association fee of $1,300
Exterior
- Parking: Attached 2-car garage; Attached garage parking
- Security: Prewired; Smoke detectors
- Utilities: Public water; Public sewer
- Home design: Residential property; New construction; Full ownership; Slab foundation; Composition roof; Built in 2026; Living area approximately 1,778
- Construction: Brick, stone, and vinyl siding exterior; Built by D.R. Horton
- Exterior features: Covered patio; Deck; Patio; Private yard; Back yard fencing; Located in a subdivision; Cul-de-sac lot
Interior
- Kitchen: Dishwasher; Disposal; Gas range; Microwave; Oven
- Bedrooms: Primary bedroom on the first floor (13 x 15); Bedroom on the first floor (11 x 10); Bedroom on the first floor (10 x 10); Bedroom on the first floor (9 x 11); Four total rooms
- Flooring: Carpet; Plank; Vinyl
- Bathrooms: 2 full bathrooms
- Heating & cooling: Central heating (electric); Central air (electric)
- Interior features: Granite counters; Programmable thermostat; ENERGY STAR qualified appliances; Tankless water heater; Ventilation (improved indoor air quality)
- Laundry & utility: Washer hookup; Electric dryer hookup
Neighborhood map
What this means for you Summary
Snapshot
- This is a 4-bed/2.0-bath single-family listed at $315k. Condition is rated good.
Deal economics
- At list price, monthly cash flow is $-574 ($-7k/yr) — negative.
- To cash-flow at today's rent, offer at most $303k (3.9% below list).
- To meet the 1% rule (rent ≥ 1% of price), the offer needs to be $279k (11.6% below list).
- Recommended offer: $279k (11.6% below list) — sets the bar for 1% rule.
- Cap rate 4.5% vs local median 3.2% in Fulshear — top-decile yield for the area; either an underpriced asset or a hidden risk that comps aren't pricing in. Stress-test before assuming the spread holds.
Location & tenants
- Location reads 69/100 on livability (#430 in TX) — a middle-class / working-renter tenant base. Strengths: crime A+, employment A+, housing A+; Watch: amenities F, commute F, cost of living F.
- Katy ISD (suburban): math 61% / reading 63% proficiency, ranked #29 of 826 in TX (top 4%) — acceptable for families but not a draw, mixed tenant base, ~2y average lease.
- Zoned schools: James E Randolph El (math 79% / reading 73%, grade A, #70 of 4,322 statewide, top 2%, 1,078 students, 8% FRL); Seven Lakes J H (math 84% / reading 80%, grade A+, #7 of 1,662 statewide, top 0%, 1,630 students, 20% FRL); Katy H S (math 62% / reading 74%, grade B, #150 of 1,632 statewide, top 10%, 3,330 students, 38% FRL).
- Zoned-school proficiency averages 75% at this address vs 62% district-wide (+13 pts) — the actual schools serving this property are materially stronger than the Katy ISD average implies; a family-tenant draw the district grade alone would hide.
- Market conditions: Rents soft (-1.6%/yr); 1242 active listings in the ZIP; 10 comparable units currently listed for rent nearby; rentals leasing fast (median 7d on market — plan ~1-2 weeks tenant-placement turnaround); high-income renter base; 12,093 units permitted in Fort Bend County in 2024 (815 in 5+ unit buildings).
Forward outlook
- Local home prices are declining (-3.0%/yr); year-one equity from $3k of loan paydown is wiped out by about $12k of value loss. Plan a longer hold.
- Fort Bend County population projected at +75% by 2050 — long-run rental-demand tailwind backs the buy-and-hold thesis.
Negotiation context
- Only 9 days on market — expect competitive offers; lowballing is unlikely to land.
Risks & watch-outs
- Climate carrying-cost: major flood risk; severe wind risk, 99% chance of damaging wind over 30y; extreme-heat days projected 7→22/yr by 2055 (HVAC capex compounding) — expect insurance premiums to compound above CPI over the hold.
Questions for the listing agent
- What do current leases actually rent for vs. the listed asking? Can we see a recent rent roll and the last 12 months of T-12 income?
- What does the HOA fee cover, when was the last increase, and are there any pending special assessments or reserve-fund shortfalls?
- Is there a deadline driving the sale (1031 exchange, divorce, estate, relocation)? That informs how much negotiation room exists.
- Schools are A-rated — typically a magnet for longer-tenancy family renters. What's the average tenant stay here, and is there a school-zone premium baked into asking?
- The area grade is low — what's the realistic commute time and amenity access for the typical tenant pool here? Any planned neighborhood developments (good or bad) we should know about?
- What's the average days-on-market for RENTAL listings here right now (not sales)? A rising rental-DOM trend means longer vacancies and softer asking-rent achievability than the comps imply.
- What's the recent tenant-quality profile in this submarket — average credit score on applications, eviction rate, late-payment / NSF rate, and stable-employment percentage? A property-management company in the area should have these aggregated.
- How much new for-sale + rental construction is in the pipeline within 1–3 miles? Heavy new supply typically softens prices + rents 12–24 months out; constrained supply supports both.
Investment metrics
- 1% rule
- 0.72% ✗
- Cap rate
- 4.51%
- Cash-on-cash
- -6.38%
- DSCR
- 0.72
- GRM
- 11.5
CMA / ARV
- ARV (on-the-fly)
- $385,826
- Comps found
- 6
Show comp detail 6 sales within ~0.75 mi
| Address | Dist | Beds/Ba | Sqft | Sold | Price | $/sf | Match |
|---|---|---|---|---|---|---|---|
| 4239 Prairie Landing Ln | 0.69mi | 4/2.0 | 1,822 (+2%) | 5mo | $395,000 | $217 | 60 |
| 4818 Rustling Cedar Ln | 0.60mi | 3/2.0 (-1) | 1,894 (+6%) | 18mo | $389,998 | $206 | 41 |
| 4839 Rustling Cedar Ln | 0.56mi | 3/2.5 (-1) | 1,894 (+6%) | 21mo | $414,998 | $219 | 39 |
| 28938 Copper Ridge Drive Dr | 0.75mi | 3/2.5 (-1) | 2,005 (+13%) | 3mo | $419,000 | $209 | 34 |
| 28802 Copper Ridge Dr | 0.59mi | 3/2.0 (-1) | 2,021 (+14%) | 15mo | $476,228 | $236 | 33 |
| 4822 Rustling Cedar Ln | 0.60mi | 3/3.0 (-1) | 1,955 (+10%) | 18mo | $399,988 | $205 | 31 |
Match score weights: distance 35% · size 25% · config 20% · recency 20%. Top-matched comps best support the ARV.
Projected returns pro-forma
-3.0% appreciation · 0.0% rent growth · sell at horizon
- IRR
- -30.8%
- Equity multiple
- 0.01×
- Total profit
- $-107,141
- Equity at exit
- $57,528
- IRR
- -54.8%
- Equity multiple
- -0.59×
- Total profit
- $-171,484
- Equity at exit
- $33,359
Cash invested: $108,031 (down + closing). Projections, not guarantees.
Landlord ↔ Tenant lean methodology
- Overall (STATE)
- 87 Strongly Landlord-Friendly
- State Texas
- 87 Strongly Landlord-Friendly · R+5
- County
- — inherits STATE
- City
- — inherits STATE
ZIP-level market 77441
- Rents YoY
- -1.6%
- Active inventory
- 1242
- Price-to-rent
- 9.4×
Monthly cashflow live
- Estimated rent
- $2,785 high interval (Pro) →
- Mortgage (P&I)
- −$2,023
- Tax est. 1.5%
- −$482 /mo · $5,787/yr
- Insurance
- −$161
- HOA
- −$108
- Vacancy / Maint / Mgmt
- −$585
- Net cashflow
- $-574
Break-even live
Sensitivity live
| Price | -10% $-307 | -5% $-441 | +0% $-574 | +5% $-707 | +10% $-841 |
|---|---|---|---|---|---|
| Rent | -10% $-794 | -5% $-684 | +0% $-574 | +5% $-464 | +10% $-354 |
| Rate | -1.0pp $-380 | -0.5pp $-476 | base $-574 | +0.5pp $-674 | +1.0pp $-776 |
UW: 25.0% down · 7.5% · 30yr · 1.5% tax · 5.0% vac · 8.0% maint · 8.0% mgmt
Financing live
Cash to close
- Down payment
- $96,456
- Closing costs
- $11,575
- Reserves months
- —
- Total cash needed
- —
Loan-product check · same deal, 3 products live
Conventional
25% down · 7.5% · 30yr
- Down + closing
- —
- Monthly P&I
- —
- Monthly cashflow
- —
- DSCR
- —
- Eligible?
- —
Personal DTI + credit; lowest rate.
DSCR
20% down · 8.5% · 30yr
- Down + closing
- —
- Monthly P&I
- —
- Monthly cashflow
- —
- DSCR
- —
- Eligible?
- —
No personal income docs; deal must DSCR.
Hard money
10% down · 12.0% · 12mo
- Down + closing
- —
- Monthly P&I
- —
- Monthly cashflow
- —
- DSCR
- —
- Eligible?
- —
Short-term bridge; refi at stabilization.
Rent comps 10 comps
| Address | Beds | Baths | Sqft | Rent | $/sqft | DOM | Units | Dist |
|---|---|---|---|---|---|---|---|---|
| 27222 Fulshear Bend Dr Fulshear, TX | 3.0 | 1.0–2.0 | 1027 | $2,779 | $2.71 | 0d | 122 | 0.70mi |
| 3702 Mirabeau Dr Katy, TX | 2.0–4.0 | 2.5 | 1875 | $3,776 | $2.01 | 0d | 1 | 1.16mi |
| 27727 Halls Farms Ln Fulshear, TX | 3.0 | 2.5 | 2472 | $2,556 | $1.03 | 0d | 1 | 1.17mi |
| 3551 Shearwater St Katy, TX | 4.0 | 2.5 | 2054 | $2,500 | $1.22 | 45d | 1 | 1.24mi |
| 29403 Cayman Canyon Way Katy, TX | 3.0–5.0 | 2.0 | 1679 | $2,292 | $1.37 | 3d | 17 | 1.25mi |
| 3711 Daintree Park Dr Katy, TX | 3.0 | 2.0 | 1892 | $2,101 | $1.11 | 21d | 1 | 1.28mi |
| 28100 Tamarron Pkwy Katy, TX | 1.0–3.0 | 1.0–2.0 | 1007 | $2,361 | $2.34 | 0d | 26 | 1.34mi |
| 5506 Amber Brook Ln Fulshear, TX | 3.0 | 2.5 | 1897 | $2,350 | $1.24 | 45d | 1 | 1.35mi |
| 29418 Sydney Stone Ln Katy, TX | 4.0 | 3.0 | 2571 | $3,490 | $1.36 | 45d | 1 | 1.44mi |
| 6106 Carver Pines Dr Katy, TX | 4.0 | 2.0 | 2557 | $2,479 | $0.97 | 7d | 1 | 1.45mi |
HOA detail
- Monthly dues
- $108 · $1,296/yr
Listing history 7 events
-
2026-06-21days on market $314,990 Active 9 DOM
-
2026-06-18days on market $314,990 Active 6 DOM
-
2026-06-17days on market $314,990 Active 5 DOM
-
2026-06-16days on market $314,990 Active 4 DOM
-
2026-06-15days on market $314,990 Active 3 DOM
-
2026-06-13remarks 699-char remark
-
2026-06-13$314,990 Active 1 DOM
ⓘ Source: listings_history table (triggers on properties + properties_extension) + one-shot
backfill from property_details.listing_events for pre-trigger history.
Climate risk First Street
- Flood 6/10 Major FEMA zone X (unshaded) · 73% chance over 30 yrs
- Wildfire 4/10 Moderate
- Heat 9/10 Extreme 7 d/yr ≥110°F today · 22 d/yr by 30 yrs out
- Wind 9/10 Extreme 99% chance of damaging wind over 30 yrs
- Air quality 2/10 Low 1 unhealthy d/yr today · 1 by 30 yrs out
Nearby sold comps map
Loading sold comps map…
Walkable amenities ~0.75 mi
Loading nearby amenities…
Taxation est. · year 1
- Rental income
- $33,421
- − Mortgage interest
- −$21,612
- − Property taxes
- −$5,787
- − Insurance
- −$1,929
- − Repairs & maintenance
- −$2,674
- − Management
- −$2,674
- − HOA
- −$1,296
- − Depreciation
- −$11,224
- Taxable loss
- −$13,775
- Est. tax savings @ 24.0%
- +$3,306
- After-tax cash flow
- $-3,584/yr
For passive investors: Depreciation is non-cash, so a rental often shows a tax loss while cash-flowing — sheltering income. Rental losses are passive: they offset passive income freely, and up to $25,000/yr can offset ordinary (W-2) income if you actively participate and your MAGI is under $100k (phasing out to $0 by $150k); unused losses carry forward. On sale, claimed depreciation is recaptured at up to 25%, and gains may owe capital-gains tax (a 1031 exchange can defer both). Figures are a year-1 estimate at your 24.0% rate — not tax advice; consult a CPA.
Condition & rehab AI · 1 photo
This move-in-ready single-family home in Fulshear, TX, is in good condition with a well-maintained exterior and interior. It offers a good return on investment with minor updates that can significantly enhance its value.
Value-add opportunities
- Both Painting the exterior brick — Enhances curb appeal and can increase both resale and rental value.
- Both Landscaping improvements — Enhances curb appeal and can increase both resale and rental value.
- Both New flooring in secondary bedrooms — Updates the flooring and can increase both resale and rental value.
- Both Upgrading the kitchen appliances — Modernizes the kitchen and can increase both resale and rental value.
Renovation cost estimate screening
Value-add ROI direction
- Both Painting the exterior brick — Enhances curb appeal and can increase both resale and rental value. ↑
- Both Landscaping improvements — Enhances curb appeal and can increase both resale and rental value. ↑
- Both New flooring in secondary bedrooms — Updates the flooring and can increase both resale and rental value. ↑
- Both Upgrading the kitchen appliances — Modernizes the kitchen and can increase both resale and rental value. ↑
ⓘ Cost ranges are severity-bucket heuristics (US national rule-of-thumb). Get contractor quotes + a written scope before underwriting a rehab budget.
Schools (NCES district)
- District
- Katy ISD
- NCES district ID
- 4825170
- Math proficiency
- 61% ▼ -7.00%
- Reading proficiency
- 63% ▼ -3.00%
- Median HH income
- $90,312
- Composite
- 56.59/100
- National rank
- #1146
- State rank
- #29 of 826 in TX
Livability — Fulshear
- Score
- 69/100
- State rank
- #430
- US rank
- #8901
Category grades
Schools grade is shown separately in the Schools card above.
Census & demographics
- Census place
- Fulshear, TX
- County
- Fort Bend County · 836,777 people
- City population
- 41,324
- Metro
- Houston-The Woodlands-Sugar Land, TX
- Population (ZIP)
- 41,324
- Household income
- $184,390
- Rent vs Own
- Severe rent burden
- 301.0
Population outlook (Fort Bend County) Hauer SSP2
- Today (2025)
- 1,004,526 people
- By 2030
- 1,153,104 · +14.8%
- By 2040
- 1,453,718 · +44.7%
- By 2050
- 1,753,781 · +74.6%
- By 2075
- 2,455,772 · +144.5%
- By 2100
- 2,930,528 · +191.7%
Race, ethnicity, and origin ACS 2023
- Neighborhood character
- Diverse neighborhood (Simpson 0.62)
- Race & ethnicity
- White 57% Hispanic / Latino 20% Two or more races 15% Asian 12% Black 6%
- Hispanic origin (detail)
- Mexican 10%
- Common ancestry
- Lithuanian 5% Romanian 2% Italian 1%
- Foreign-born
- 26% · Canada, China, Jamaica
- Languages at home
- 68% English-only · Spanish 17% German/W. Germanic 4% Chinese 4%
Political lean MEDSL · Fort Bend
- 2024 margin
- Toss-up / Even · D 49.5% · R 47.9% · Other 2.6%
- 2008→2024 swing
- +4.0pp toward D · 2008: -2.4pp · 2024: 1.6pp
- All cycles
- 2024: D+1.6 2020: D+10.6 2016: D+6.6 2012: R+6.8 2008: R+2.4
Not yet ingested
- Civics
- —
Market trends
- HPI YoY
- ▼ -154.74%
- Current HPI
- 275.8798
- Rent YoY
- ▼ -1.63%
- Metro
- Houston-The Woodlands-Sugar Land, TX
- State GDP YoY
- ▲ 3.95%
- F500 in state
- 110
Industry mix (Fortune 500 HQ in TX)
| Industry | F500 HQs | Revenue |
|---|---|---|
| Energy | 16 | $1,198B |
|
||
| Technology | 5 | $198B |
|
||
| Engineering / Construction | 4 | $72B |
|
||
| Energy Services | 3 | $60B |
|
||
| Utilities | 3 | $41B |
|
||
| Healthcare | 2 | $330B |
|
||
Price history
-0.9% since first listed2 events — show timeline
- 2026-06-12 Price Changed $314,990 HARMLS
- 2026-06-12 Listed $317,990 HARMLS
Cash-flow waterfall
monthlySold comps — $/sqft
last 12 mo · ≤1 miLoading sold comps…