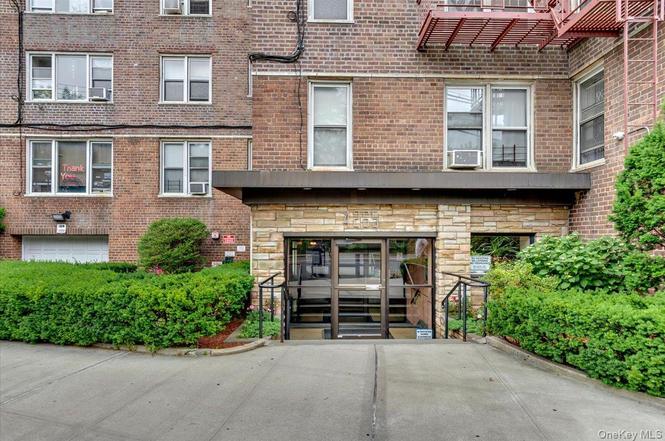
4265 Webster Ave Unit 7D · New York, NY
Flood risk 1/10 · Minimal
- FEMA flood zone
- X (unshaded)
- Chance of flooding over 30 yrs
- 0.0%
- Est. flood insurance / yr
- $507 – $1,088
Fire risk 1/10 · Minimal
- Est. fire insurance / yr
- $691 – $1,283
Heat risk 6/10 · Moderate
- Hot days now (above 99°F)
- 7 days/yr
- Hot days in 30 yrs
- 15 days/yr
Wind risk 6/10 · Moderate
- Chance of severe wind over 30 yrs
- 27.0%
Air-quality risk 3/10 · Minor
- Unhealthy air days now
- 3 days/yr
- Unhealthy air days in 30 yrs
- 4 days/yr
Risk factors via First Street. Map © Google.
Why this score? — see what drove the C+ grade
The composite is a weighted blend of 9 inputs, each scored 0–100. Each bar is that input's sub-score; the figure is the points it added to the 100-point composite (weight × sub-score).
- Cash flow +25.8/30.0
- DSCR +8.6/10.0
- ARV discount +7.5/15.0
- 1% rule +6.8/10.0
- Schools +5.0/10.0
- Livability +3.8/5.0
- Rent growth +2.5/5.0
- Condition / age +2.5/5.0
- Appreciation +0.0/10.0
$225,000
🖨 Deal sheet 📄 Offer letter ✓ Due diligence
Listing remarks
Two bedroom co-op in the heart of Woodlawn. Enjoy the convenient 27 min. Metro North commute to NYC. Numerous shops and restaurants all within walking distance from this very large unit. Indoor parking garage -waitlist. Walking distance to PS 19. Whether downsizing or making your first venture into home ownership, this truly is a place which would be wonderful to call home.
Key facts
- Metro north commute
- Garage
- Built 1956
Tags
Neighborhood map
What this means for you Summary
Snapshot
- This is a 2-bed/1.0-bath condo listed at $225k.
Deal economics
- At list price, monthly cash flow is $543 ($7k/yr) — positive.
- The deal already cash-flows at list — no discount required.
- Meets the 1% rule at list price ($3k rent vs $225k).
- Recommended offer: $198k (12.0% below list) — sets the bar for market timing.
- Cap rate 9.2% vs local median 2.6% in New York — top-decile yield for the area; either an underpriced asset or a hidden risk that comps aren't pricing in. Stress-test before assuming the spread holds.
Location & tenants
- Location reads 75/100 on livability (#268 in NY, #4,188 nationally) — a middle-class / working-renter tenant base. Strengths: amenities A+, commute A+, health & safety A; Watch: crime F, cost of living F.
- Market conditions: 66 active listings in the ZIP; 15 comparable units currently listed for rent nearby; rentals at typical pace (median 25d on market — plan ~3-4 weeks tenant-placement turnaround); solid renter incomes; 6,929 units permitted in Bronx County in 2024 (6,829 in 5+ unit buildings).
- This rent runs 35% of the median local income ($90k/yr) — at the standard rent-burdened threshold; future hikes will face affordability resistance.
Forward outlook
- Local home prices are declining (-3.0%/yr); year-one equity from $2k of loan paydown is wiped out by about $7k of value loss. Plan a longer hold.
- Bronx County population projected at +21% by 2050 — long-run rental-demand tailwind backs the buy-and-hold thesis.
Negotiation context
- It's been on market 125 days — a 12% lower offer ($198k) is reasonable based on typical stale-listing flexibility.
- 4 sale attempts since 2y ago with the ask held roughly flat each time — persistent listings suggest the price (not the market) is what's stuck; bring a comps-based counter.
Risks & watch-outs
- Watch-outs: built in 1956 — expect roof / HVAC / electrical / plumbing capex.
- Climate carrying-cost: major wind risk, 27% chance of damaging wind over 30y; extreme-heat days projected 7→15/yr by 2055 (HVAC capex compounding) — expect insurance premiums to compound above CPI over the hold.
Questions for the listing agent
- It's been on market 125 days. Have you received any prior offers? Is the seller open to a 12% concession, seller financing, or rate buy-down credit?
- Built in 1956 — when were the roof, HVAC, electrical panel, plumbing, and water heater last replaced?
- Any open or pending special assessments — roof, HVAC, plumbing, elevator, façade? What's the per-unit balance and payoff schedule, and is the seller paying it off at close or rolling it to the buyer?
- Why hasn't it sold? Are there any deal-killer items the seller is aware of (foundation, flood, title, zoning, code violations)?
- Is there a deadline driving the sale (1031 exchange, divorce, estate, relocation)? That informs how much negotiation room exists.
- Schools are B-rated — typically a magnet for longer-tenancy family renters. What's the average tenant stay here, and is there a school-zone premium baked into asking?
- Crime grade is F in this area — have there been break-ins, vandalism, or insurance claims at this property in the last 3 years? What carrier currently insures it and at what premium?
- What's the average days-on-market for RENTAL listings here right now (not sales)? A rising rental-DOM trend means longer vacancies and softer asking-rent achievability than the comps imply.
- What's the recent tenant-quality profile in this submarket — average credit score on applications, eviction rate, late-payment / NSF rate, and stable-employment percentage? A property-management company in the area should have these aggregated.
- How much new apartment / multifamily construction is in the pipeline within 1–3 miles? Heavy new supply (>2% of stock underway) typically softens rents 12–24 months out; light construction supports rent growth.
Investment metrics
- 1% rule
- 1.18% ✓
- Cap rate
- 9.19%
- Cash-on-cash
- 10.33%
- DSCR
- 1.46
- GRM
- 7.1
CMA / ARV
No comps found within radius.
Projected returns pro-forma
-3.0% appreciation · 3.0% rent growth · sell at horizon
- IRR
- -0.8%
- Equity multiple
- 0.97×
- Total profit
- $-1,864
- Equity at exit
- $33,548
- IRR
- 8.9%
- Equity multiple
- 1.68×
- Total profit
- $43,035
- Equity at exit
- $19,454
Cash invested: $63,000 (down + closing). Projections, not guarantees.
Landlord ↔ Tenant lean methodology
- Overall (CITY)
- 0 Strongly Tenant-Friendly
- State New York
- 15 Strongly Tenant-Friendly · D+10
- County
- — inherits STATE
- City New York
- 0 Strongly Tenant-Friendly · D+34
ZIP-level market 10470
- Home prices YoY
- -28.6%
- Active inventory
- 66
- Price-to-rent
- 7.1×
Monthly cashflow live
- Estimated rent
- $2,655 high interval (Pro) →
- Mortgage (P&I)
- −$1,180
- Tax est. 1.5%
- −$281 /mo · $3,375/yr
- Insurance
- −$94
- HOA
- −$0
- Vacancy / Maint / Mgmt
- −$558
- Net cashflow
- $543
Break-even live
UW: 25.0% down · 7.5% · 30yr · 1.5% tax · 5.0% vac · 8.0% maint · 8.0% mgmt
Financing live
Cash to close
- Down payment
- $56,250
- Closing costs
- $6,750
- Reserves months
- —
- Total cash needed
- —
Loan-product check · same deal, 3 products live
Conventional
25% down · 7.5% · 30yr
- Down + closing
- —
- Monthly P&I
- —
- Monthly cashflow
- —
- DSCR
- —
- Eligible?
- —
Personal DTI + credit; lowest rate.
DSCR
20% down · 8.5% · 30yr
- Down + closing
- —
- Monthly P&I
- —
- Monthly cashflow
- —
- DSCR
- —
- Eligible?
- —
No personal income docs; deal must DSCR.
Hard money
10% down · 12.0% · 12mo
- Down + closing
- —
- Monthly P&I
- —
- Monthly cashflow
- —
- DSCR
- —
- Eligible?
- —
Short-term bridge; refi at stabilization.
Rent comps 15 comps
| Address | Beds | Baths | Sqft | Rent | $/sqft | DOM | Units | Dist |
|---|---|---|---|---|---|---|---|---|
| 135 Wakefield Ave Yonkers, NY | 2.0 | 1.0 | 850 | $3,000 | $3.53 | 43d | 2 | 0.62mi |
| 116 Alexander Ave Yonkers, NY | 2.0 | 2.0 | 1200 | $3,250 | $2.71 | 24d | 1 | 0.69mi |
| 255 Bronx River Rd Unit 4R Yonkers, NY | 1.0 | 1.0 | 800 | $2,250 | $2.81 | 24d | 1 | 0.88mi |
| 2325 Cortlandt St Unit 4 Mt Vernon, NY | 2.0 | 1.0 | 700 | $2,300 | $3.29 | 24d | 1 | 1.05mi |
| 119 S 13th Ave Mount Vernon, NY | 2.0 | 1.0 | 800 | $2,997 | $3.75 | 13d | 1 | 1.15mi |
| 20 Overhill Pl Unit 3 Yonkers, NY | 2.0 | 1.0 | 800 | $3,000 | $3.75 | 43d | 1 | 1.21mi |
| 356 S Tenth Ave Unit 2nd Floor Mt Vernon, NY | 3.0 | 2.0 | 1100 | $3,850 | $3.50 | 24d | 1 | 1.25mi |
| 119 S 11th Ave Unit 1 Mt Vernon, NY | 2.0 | 1.0 | 700 | $2,800 | $4.00 | 11d | 1 | 1.26mi |
| 421 S 10th Ave Mount Vernon, NY | 3.0 | 1.0 | 1200 | $3,500 | $2.92 | 24d | 1 | 1.29mi |
| 18 N Bond St Unit 3D Mt Vernon, NY | 1.0 | 1.0 | 750 | $2,000 | $2.67 | 24d | 1 | 1.34mi |
| 32 N Bond St Mount Vernon, NY | 1.0 | 1.0 | 850 | $1,900 | $2.24 | 7d | 1 | 1.37mi |
| 495 Kimball Ave Unit First Floor Yonkers, NY | 2.0 | 1.0 | 1100 | $3,000 | $2.73 | 43d | 1 | 1.44mi |
| 150 S 6th Ave Unit 2 Mt Vernon, NY | 1.0 | 1.0 | 800 | $2,500 | $3.12 | 7d | 1 | 1.47mi |
| 150 S 6th Ave Unit 2 Mt Vernon, NY | 1.0 | 1.0 | 800 | $2,500 | $3.12 | 17d | 1 | 1.47mi |
| 142 Trenchard St Unit 2E Yonkers, NY | 1.0 | 1.0 | 900 | $2,250 | $2.50 | 11d | 1 | 1.49mi |
HOA detail condo
- Monthly dues
- $0 · $0/yr
- Assessments
- None detected in remarks — confirm with the listing agent.
Listing history 12 events
-
2026-03-26status Pending
-
2026-03-03status Active
-
2026-03-03price $225,000
-
2025-10-28status Pending
-
2025-07-18$220,000 Active
-
2025-07-02historical
-
2025-01-08price $210,900
-
2024-12-06price $209,900
-
2024-11-23status Active
-
2024-10-11status Pending
-
2024-09-16$219,900 Active
-
2024-09-12historical
ⓘ Source: listings_history table (triggers on properties + properties_extension) + one-shot
backfill from property_details.listing_events for pre-trigger history.
Climate risk First Street
- Flood 1/10 Low FEMA zone X (unshaded) · 0% chance over 30 yrs
- Wildfire 1/10 Low
- Heat 6/10 Major 7 d/yr ≥99°F today · 15 d/yr by 30 yrs out
- Wind 6/10 Major 27% chance of damaging wind over 30 yrs
- Air quality 3/10 Moderate 3 unhealthy d/yr today · 4 by 30 yrs out
Nearby sold comps map
Loading sold comps map…
Walkable amenities ~0.75 mi
Loading nearby amenities…
Taxation est. · year 1
- Rental income
- $31,860
- − Mortgage interest
- −$12,603
- − Property taxes
- −$3,375
- − Insurance
- −$1,125
- − Repairs & maintenance
- −$2,549
- − Management
- −$2,549
- − Depreciation
- −$6,545
- Taxable income
- $3,114
- Est. tax owed @ 24.0%
- −$747
- After-tax cash flow
- $5,763/yr
For passive investors: Depreciation is non-cash, so a rental often shows a tax loss while cash-flowing — sheltering income. Rental losses are passive: they offset passive income freely, and up to $25,000/yr can offset ordinary (W-2) income if you actively participate and your MAGI is under $100k (phasing out to $0 by $150k); unused losses carry forward. On sale, claimed depreciation is recaptured at up to 25%, and gains may owe capital-gains tax (a 1031 exchange can defer both). Figures are a year-1 estimate at your 24.0% rate — not tax advice; consult a CPA.
Schools (NCES district)
No district data.
Livability — New York
- Score
- 75/100
- State rank
- #268
- US rank
- #4188
Category grades
Schools grade is shown separately in the Schools card above.
Census & demographics
- Census place
- New York, NY
- County
- Bronx County · 1,197,324 people
- City population
- 7,731,280
- Metro
- New York-Newark-Jersey City, NY-NJ-PA
- Population (ZIP)
- 16,004
- Household income
- $90,046
- Rent vs Own
- Severe rent burden
- 805.0
Population outlook (Bronx County) Hauer SSP2
- Today (2025)
- 1,607,353 people
- By 2030
- 1,681,852 · +4.6%
- By 2040
- 1,824,421 · +13.5%
- By 2050
- 1,945,470 · +21.0%
- By 2075
- 2,187,887 · +36.1%
- By 2100
- 2,244,136 · +39.6%
Race, ethnicity, and origin ACS 2023
- Neighborhood character
- Highly diverse neighborhood (Simpson 0.71)
- Race & ethnicity
- White 38% Black 30% Hispanic / Latino 24% Two or more races 9% Asian 3% Native American 1%
- Hispanic origin (detail)
- Puerto Rican 9% Dominican 9%
- Common ancestry
- Romanian 1% Lithuanian 1% Slovak 1%
- Foreign-born
- 32% · Canada, Jamaica
- Languages at home
- 72% English-only · Spanish 17% Other Indo-European 5% French/Haitian/Cajun 2%
Political lean MEDSL · Bronx
- 2024 margin
- Solid D (+45.4) · D 72.7% · R 27.3%
- 2008→2024 swing
- -32.3pp toward R · 2008: 77.8pp · 2024: 45.4pp
- All cycles
- 2024: D+45.4 2020: D+67.6 2016: D+79.1 2012: D+82.9 2008: D+77.8
Not yet ingested
- Civics
- —
Market trends
- HPI YoY
- ▼ -114.64%
- Current HPI
- 286.9195
- Rent YoY
- —
- Metro
- New York-Newark-Jersey City, NY-NJ-PA
- State GDP YoY
- ▲ 2.60%
- F500 in state
- 92
Industry mix (Fortune 500 HQ in NY)
| Industry | F500 HQs | Revenue |
|---|---|---|
| Financial Services | 10 | $950B |
|
||
| Consumer Goods | 9 | $162B |
|
||
| Insurance | 4 | $225B |
|
||
| Telecommunications | 2 | $144B |
|
||
| Pharmaceuticals | 2 | $112B |
|
||
| Media / Entertainment | 2 | $69B |
|
||
Price history
+2.3% since first listed12 events — show timeline
- 2026-03-26 Pending — OneKey® MLS as Distributed by MLS Grid
- 2026-03-03 Relisted — OneKey® MLS as Distributed by MLS Grid
- 2026-03-03 Price Changed $225,000 OneKey® MLS as Distributed by MLS Grid
- 2025-10-28 Pending — OneKey® MLS as Distributed by MLS Grid
- 2025-07-18 Listed $220,000 OneKey® MLS as Distributed by MLS Grid
- 2025-07-02 Listing Removed — OneKey® MLS as Distributed by MLS Grid
- 2025-01-08 Price Changed $210,900 OneKey® MLS as Distributed by MLS Grid
- 2024-12-06 Price Changed $209,900 OneKey® MLS as Distributed by MLS Grid
- 2024-11-23 Relisted — OneKey® MLS as Distributed by MLS Grid
- 2024-10-11 Pending — OneKey® MLS as Distributed by MLS Grid
- 2024-09-16 Listed $219,900 OneKey® MLS as Distributed by MLS Grid
- 2024-09-12 Coming Soon — OneKey® MLS as Distributed by MLS Grid
Cash-flow waterfall
monthlySold comps — $/sqft
last 12 mo · ≤1 miLoading sold comps…