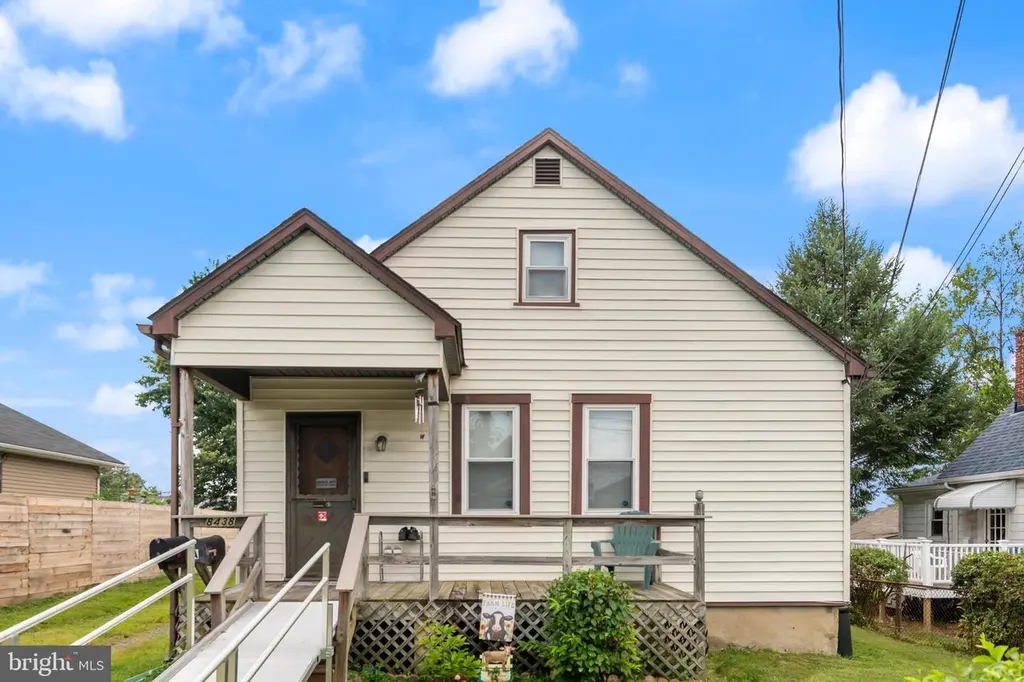
8438 Church Rd · Riviera Beach, MD
Flood risk 1/10 · Minimal
- FEMA flood zone
- X (unshaded)
- Chance of flooding over 30 yrs
- 0.0%
- Est. flood insurance / yr
- $473 – $860
Fire risk 1/10 · Minimal
- Est. fire insurance / yr
- $755 – $1,403
Heat risk 8/10 · Major
- Hot days now (above 103°F)
- 7 days/yr
- Hot days in 30 yrs
- 15 days/yr
Wind risk 6/10 · Moderate
- Chance of severe wind over 30 yrs
- 63.0%
Air-quality risk 5/10 · Moderate
- Unhealthy air days now
- 6 days/yr
- Unhealthy air days in 30 yrs
- 8 days/yr
Risk factors via First Street. Map © Google.
Why this score? — see what drove the C- grade
The composite is a weighted blend of 9 inputs, each scored 0–100. Each bar is that input's sub-score; the figure is the points it added to the 100-point composite (weight × sub-score).
- Cash flow +17.4/30.0
- ARV discount +15.0/15.0
- DSCR +5.4/10.0
- 1% rule +4.1/10.0
- Livability +3.2/5.0
- Schools +2.9/10.0
- Rent growth +2.7/5.0
- Condition / age +2.5/5.0
- Appreciation +0.0/10.0
$350,000
🖨 Deal sheet (PDF) 📄 Offer letter ✓ Due diligence
Listing remarks
Don’t miss this exceptional duplex opportunity in the highly desirable Riviera Beach community. This lead-free property features two separate units—one with one bedroom and one bathroom, and the other with two bedrooms and one bathroom—making it perfect for investors, multi-generational living, or those looking to offset their mortgage with rental income. The home also offers a rear deck and a spacious fenced-in backyard, adding even more appeal to this versatile property. A great find in a prime location—schedule a showing today!
Key facts
- Lead-free property
- Rear deck
- Fenced-in backyard
Tags
Property features AI
Finance
- Other: Assessed land and improvement values recorded; Total below-grade area and above-grade finished area recorded by assessor
- Financial info: Ownership: Fee simple
Exterior
- Parking: Driveway; On-street parking
- Utilities: Public water; Public sewer; Electric service; Oil heating fuel option
- Home design: Detached structure
- Construction: Foundation: Other; Above-grade and below-grade structures present; Finished above-grade area as recorded by assessor; Unfinished below-grade area as recorded by assessor
- Exterior features: Located outside city limits
Interior
- Bedrooms: One 1-bedroom unit and one 2-bedroom unit (multi-unit property)
- Heating & cooling: Baseboard electric heating; Window air conditioning units; Electric and oil heating fuel noted; Electric hot water
- Interior features: Finished above-grade living area (per assessor); Unfinished below-grade area (basement)
Neighborhood map
What this means for you Summary
Snapshot
- This is a 6-bed/2.0-bath single-family listed at $350k.
Deal economics
- At list price, monthly cash flow is $261 ($3k/yr) — positive.
- The deal already cash-flows at list — no discount required.
- To meet the 1% rule (rent ≥ 1% of price), the offer needs to be $318k (9.2% below list).
- Recommended offer: $318k (9.2% below list) — sets the bar for 1% rule.
- Cap rate 7.2% vs local median 5.7% in Riviera Beach — meaningfully above typical; check what's discounted (condition, days-on-market, listing class) to confirm the premium yield is real.
Location & tenants
- Location reads 64/100 on livability (#280 in MD) — a middle-class / working-renter tenant base. Strengths: employment A+, housing A+; Watch: crime D, cost of living D, amenities F.
- Anne Arundel County Public Schools (suburban): math 20% / reading 37% proficiency, ranked #10 of 24 in MD (top 42%) — low school quality limits family demand, transient renter base, plan for 1-2y turnover.
- Zoned schools: Monarch Global Academy Pcs Laurel Campus (math 13% / reading 28%, grade F, #341 of 860 statewide, top 40%, 830 students, 53% FRL); Northeast Middle (math 6% / reading 32%, grade F, #155 of 225 statewide, top 70%, 882 students, 49% FRL); Northeast High (math 24% / reading 57%, grade F, #130 of 222 statewide, top 58%, 1,390 students, 44% FRL) — zoned schools average 48% FRL vs 25% district-wide (23 pts higher); higher-poverty schools than district average — tighter screening recommended.
- Market conditions: Rents flat; 253 active listings in the ZIP; high-income renter base; 1,303 units permitted in Anne Arundel County in 2024 (299 in 5+ unit buildings).
Forward outlook
- Local home prices are declining (-3.0%/yr); year-one equity from $2k of loan paydown is wiped out by about $10k of value loss. Plan a longer hold.
- Anne Arundel County population projected at +17% by 2050 — long-run rental-demand tailwind backs the buy-and-hold thesis.
Negotiation context
- It's been on market 53 days — a 3% lower offer ($340k) is reasonable based on typical stale-listing flexibility.
- 3 sale attempts with the ask held roughly flat each time — persistent listings suggest the price (not the market) is what's stuck; bring a comps-based counter.
- Current owner paid $107k; list at $350k implies a 227% gain — meaningful room to come down on a strong offer.
Risks & watch-outs
- Watch-outs: built in 1945 — expect roof / HVAC / electrical / plumbing capex.
- Climate carrying-cost: major wind risk, 63% chance of damaging wind over 30y; extreme-heat days projected 7→15/yr by 2055 (HVAC capex compounding) — expect insurance premiums to compound above CPI over the hold.
Questions for the listing agent
- It's been on market 53 days. Have you received any prior offers? Is the seller open to a 9% concession, seller financing, or rate buy-down credit?
- Built in 1945 — when were the roof, HVAC, electrical panel, plumbing, and water heater last replaced?
- Is there a deadline driving the sale (1031 exchange, divorce, estate, relocation)? That informs how much negotiation room exists.
- Schools are D-rated, which usually means shorter tenancies and higher turnover. Who's the typical renter profile here, and what's been the actual vacancy rate?
- Crime grade is D in this area — have there been break-ins, vandalism, or insurance claims at this property in the last 3 years? What carrier currently insures it and at what premium?
- What's the average days-on-market for RENTAL listings here right now (not sales)? A rising rental-DOM trend means longer vacancies and softer asking-rent achievability than the comps imply.
- What's the recent tenant-quality profile in this submarket — average credit score on applications, eviction rate, late-payment / NSF rate, and stable-employment percentage? A property-management company in the area should have these aggregated.
- How much new for-sale + rental construction is in the pipeline within 1–3 miles? Heavy new supply typically softens prices + rents 12–24 months out; constrained supply supports both.
Investment metrics
- 1% rule
- 0.91% ✗
- Cap rate
- 7.19%
- Cash-on-cash
- 3.19%
- DSCR
- 1.14
- GRM
- 9.2
CMA / ARV
- ARV (median comp)
- $588,000
- List price
- $350,000
- Delta
- -40.48%
- Verdict
- UNDERPRICED
- Comps
- 1 within 2.0 mi
Show comp detail 1 sale within ~0.75 mi
| Address | Dist | Beds/Ba | Sqft | Sold | Price | $/sf | Match |
|---|---|---|---|---|---|---|---|
| 8428 Arbutus Rd | 0.12mi | 5/2.0 (-1) | 1,080 (0%) | 23mo | $420,000 | $389 | 70 |
Match score weights: distance 35% · size 25% · config 20% · recency 20%. Top-matched comps best support the ARV.
Projected returns pro-forma
-3.0% appreciation · 0.76% rent growth · sell at horizon
- IRR
- -13.7%
- Equity multiple
- 0.52×
- Total profit
- $-47,161
- Equity at exit
- $52,186
- IRR
- -8.6%
- Equity multiple
- 0.52×
- Total profit
- $-47,385
- Equity at exit
- $30,262
Cash invested: $98,000 (down + closing). Projections, not guarantees.
Landlord ↔ Tenant lean methodology
- Overall (STATE)
- 27 Tenant-Leaning
- State Maryland
- 27 Tenant-Leaning · D+14
- County
- — inherits STATE
- City
- — inherits STATE
ZIP-level market 21122
- Rents YoY
- 0.8%
- Active inventory
- 253
- Price-to-rent
- 9.2×
Monthly cashflow live
- Estimated rent
- $3,178 medium interval (Pro) →
- Mortgage (P&I)
- −$1,835
- Tax from tax record
- −$268 /mo · $3,221/yr
- Insurance
- −$146
- HOA
- −$0
- Vacancy / Maint / Mgmt
- −$667
- Net cashflow
- $261
Break-even live
Sensitivity live
| Price | -10% $459 | -5% $360 | +0% $261 | +5% $162 | +10% $63 |
|---|---|---|---|---|---|
| Rent | -10% $10 | -5% $135 | +0% $261 | +5% $386 | +10% $512 |
| Rate | -1.0pp $437 | -0.5pp $350 | base $261 | +0.5pp $170 | +1.0pp $78 |
UW: 25.0% down · 7.5% · 30yr · 1.5% tax · 5.0% vac · 8.0% maint · 8.0% mgmt
Financing live
Cash to close
- Down payment
- $87,500
- Closing costs
- $10,500
- Reserves months
- —
- Total cash needed
- —
Loan-product check · same deal, 3 products live
Conventional
25% down · 7.5% · 30yr
- Down + closing
- —
- Monthly P&I
- —
- Monthly cashflow
- —
- DSCR
- —
- Eligible?
- —
Personal DTI + credit; lowest rate.
DSCR
20% down · 8.5% · 30yr
- Down + closing
- —
- Monthly P&I
- —
- Monthly cashflow
- —
- DSCR
- —
- Eligible?
- —
No personal income docs; deal must DSCR.
Hard money
10% down · 12.0% · 12mo
- Down + closing
- —
- Monthly P&I
- —
- Monthly cashflow
- —
- DSCR
- —
- Eligible?
- —
Short-term bridge; refi at stabilization.
Listing history 23 events
-
2026-06-21days on market $350,000 Active 53 DOM
-
2026-06-18days on market $350,000 Active 50 DOM
-
2026-06-17days on market $350,000 Active 49 DOM
-
2026-06-16days on market $350,000 Active 48 DOM
-
2026-06-15days on market $350,000 Active 47 DOM
-
2026-06-13days on market $350,000 Active 45 DOM
-
2026-06-09days on market $350,000 Active 41 DOM
-
2026-06-08days on market $350,000 Active 40 DOM
-
2026-06-07days on market $350,000 Active 39 DOM
-
2026-06-04days on market $350,000 Active 36 DOM
-
2026-06-03days on market $350,000 Active 35 DOM
-
2026-06-02days on market $350,000 Active 34 DOM
-
2026-06-01days on market $350,000 Active 33 DOM
-
2026-05-31days on market $350,000 Active 32 DOM
-
2026-04-29$350,000 Active 560-char remark
-
2026-01-15historical
-
2025-12-23status Active
-
2025-12-08status Pending
-
2025-08-25price $324,900
-
2025-08-07$349,900 Active
-
2025-08-05historical
-
1999-03-29soldstatus $107,000
-
1988-11-14soldstatus $71,500
ⓘ Source: listings_history table (triggers on properties + properties_extension) + one-shot
backfill from property_details.listing_events for pre-trigger history.
Tax reassessment forecast MD · Partial reset (capped growth)
- Current annual tax
- $3,221 · $268/mo
- Projected year-2 tax
- $3,518 · $293/mo
- Expected delta
- +$297/yr (+$25/mo · 9.2%)
ⓘ Screening estimate from a state-policy table — verify with the county assessor before closing.
Climate risk First Street
- Flood 1/10 Low FEMA zone X (unshaded) · 0% chance over 30 yrs
- Wildfire 1/10 Low
- Heat 8/10 Severe 7 d/yr ≥103°F today · 15 d/yr by 30 yrs out
- Wind 6/10 Major 63% chance of damaging wind over 30 yrs
- Air quality 5/10 Major 6 unhealthy d/yr today · 8 by 30 yrs out
Nearby sold comps map
Loading sold comps map…
Walkable amenities ~0.75 mi
Loading nearby amenities…
Taxation est. · year 1
- Rental income
- $38,135
- − Mortgage interest
- −$19,605
- − Property taxes
- −$3,221
- − Insurance
- −$1,750
- − Repairs & maintenance
- −$3,051
- − Management
- −$3,051
- − Depreciation
- −$10,182
- Taxable loss
- −$2,725
- Est. tax savings @ 24.0%
- +$654
- After-tax cash flow
- $3,785/yr
For passive investors: Depreciation is non-cash, so a rental often shows a tax loss while cash-flowing — sheltering income. Rental losses are passive: they offset passive income freely, and up to $25,000/yr can offset ordinary (W-2) income if you actively participate and your MAGI is under $100k (phasing out to $0 by $150k); unused losses carry forward. On sale, claimed depreciation is recaptured at up to 25%, and gains may owe capital-gains tax (a 1031 exchange can defer both). Figures are a year-1 estimate at your 24.0% rate — not tax advice; consult a CPA.
Schools (NCES district)
- District
- Anne Arundel County Public Schools
- NCES district ID
- 2400060
- Math proficiency
- 20% ▼ -21.00%
- Reading proficiency
- 37% ▼ -13.00%
- Median HH income
- $87,880
- Composite
- 28.52/100
- National rank
- #6733
- State rank
- #10 of 24 in MD
Livability — Riviera Beach
- Score
- 64/100
- State rank
- #280
- US rank
- #14429
Category grades
Schools grade is shown separately in the Schools card above.
Census & demographics
- Census place
- Riviera Beach, MD
- County
- Anne Arundel County · 535,653 people
- Metro
- Baltimore-Columbia-Towson, MD
- Population (ZIP)
- 61,566
- Household income
- $127,587
- Rent vs Own
- Severe rent burden
- 791.0
Population outlook (Anne Arundel County) Hauer SSP2
- Today (2025)
- 617,384 people
- By 2030
- 642,094 · +4.0%
- By 2040
- 686,621 · +11.2%
- By 2050
- 723,031 · +17.1%
- By 2075
- 809,346 · +31.1%
- By 2100
- 837,658 · +35.7%
Race, ethnicity, and origin ACS 2023
- Neighborhood character
- Predominantly White (80%)
- Race & ethnicity
- White 80% Two or more races 7% Black 7% Hispanic / Latino 5% Asian 2%
- Common ancestry
- Romanian 4% Lithuanian 2% Slovak 2%
- Foreign-born
- 4% · Canada, China
- Languages at home
- 93% English-only · Spanish 3% Other Indo-European 1% Chinese 0%
Political lean MEDSL · Anne Arundel
- 2024 margin
- D (+13.9) · D 55.7% · R 41.7% · Other 2.6%
- 2008→2024 swing
- +15.7pp toward D · 2008: -1.8pp · 2024: 13.9pp
- All cycles
- 2024: D+13.9 2020: D+14.5 2016: D+0.7 2012: R+0.9 2008: R+1.8
Not yet ingested
- Civics
- —
Market trends
- HPI YoY
- ▼ -401.00%
- Current HPI
- 283.1566
- Rent YoY
- ▲ 0.76%
- Metro
- Baltimore-Columbia-Towson, MD
- State GDP YoY
- ▲ 2.97%
- F500 in state
- 12
Industry mix (Fortune 500 HQ in MD)
| Industry | F500 HQs | Revenue |
|---|---|---|
| Aerospace / Defense | 1 | $71B |
|
||
| Utilities | 1 | $25B |
|
||
| Hotels | 1 | $24B |
|
||
| Consumer Goods | 1 | $7B |
|
||
| Real Estate | 1 | $6B |
|
||
| Chemicals | 1 | $2B |
|
||
Price history
+389.5% since first listed9 events — show timeline
- 2026-04-29 Listed $350,000 BRIGHT MLS
- 2026-01-15 Listing Removed — BRIGHT MLS
- 2025-12-23 Relisted — BRIGHT MLS
- 2025-12-08 Pending — BRIGHT MLS
- 2025-08-25 Price Changed $324,900 BRIGHT MLS
- 2025-08-07 Listed $349,900 BRIGHT MLS
- 2025-08-05 Coming Soon — BRIGHT MLS
- 1999-03-29 Sold (Public Records) $107,000 Public Records
- 1988-11-14 Sold (Public Records) $71,500 Public Records
Property tax history
+3.1%/yrLatest (2025): $3,221 · +2.4% YoY. Source: county tax records.
Cash-flow waterfall
monthlySold comps — $/sqft
last 12 mo · ≤1 miLoading sold comps…