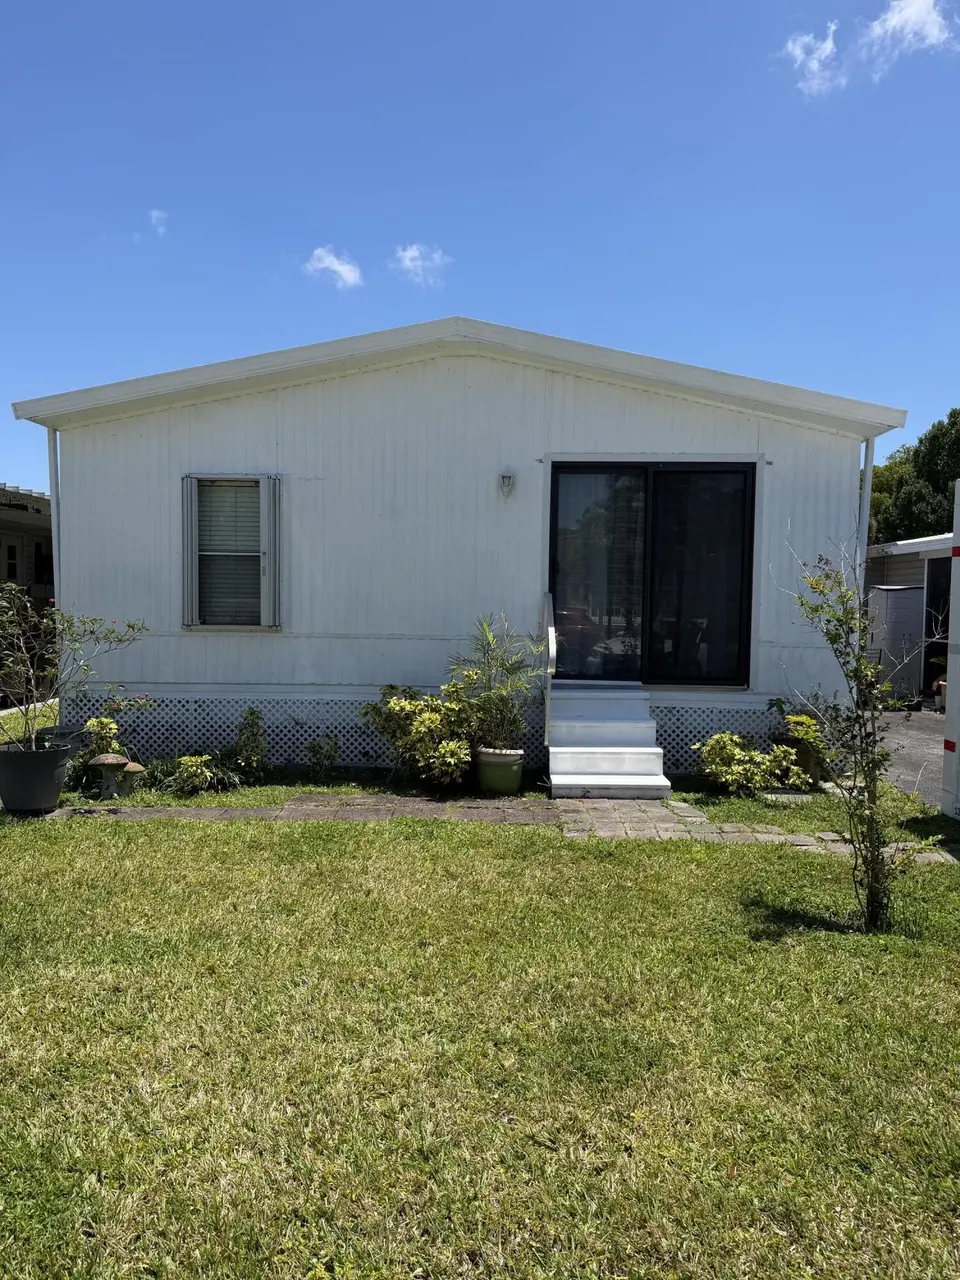
5310 SW 27th Ter · Dania Beach, FL
Flood risk 1/10 · Minimal
- FEMA flood zone
- X (shaded)
- Chance of flooding over 30 yrs
- 0.0%
- Est. flood insurance / yr
- $507 – $1,088
Fire risk 1/10 · Minimal
- Est. fire insurance / yr
- $947 – $1,759
Heat risk 10/10 · Severe
- Hot days now (above 105°F)
- 6 days/yr
- Hot days in 30 yrs
- 21 days/yr
Wind risk 10/10 · Severe
- Chance of severe wind over 30 yrs
- 99.0%
Air-quality risk 2/10 · Minimal
- Unhealthy air days now
- 2 days/yr
- Unhealthy air days in 30 yrs
- 2 days/yr
Risk factors via First Street. Map © Google.
Why this score? — see what drove the B- grade
The composite is a weighted blend of 9 inputs, each scored 0–100. Each bar is that input's sub-score; the figure is the points it added to the 100-point composite (weight × sub-score).
- Cash flow +26.3/30.0
- ARV discount +15.0/15.0
- DSCR +8.9/10.0
- 1% rule +6.2/10.0
- Schools +4.1/10.0
- Livability +3.9/5.0
- Rent growth +2.8/5.0
- Condition / age +2.5/5.0
- Appreciation +0.0/10.0
$269,900
🖨 Deal sheet 📄 Offer letter ✓ Due diligence
Listing remarks MLS
''PROPERTY SOLD ''''AS-IS'''' LIENS OR CODE VIOLATIONS MAY OR MAY NOT EXIST ON THIS'' PROPERTY AND ARE THE RESPONSIBILITY OF THE BROKER/PURCHASER TO RESOLVE.
Key facts
- Cul de sac
- Wood laminate floors
- No rear neighbor
Tags
Property features AI
Finance
- Other: Pets allowed (dogs and cats permitted)
- HOA & community: Has association (Ravenswood Estates); Monthly HOA fee of $80; HOA covers common areas, recreation facilities, and pool service; Community amenities include pool, clubhouse, playground, basketball and tennis courts, and recreation facilities
Exterior
- Parking: 3 parking spaces; Open parking
- Utilities: Public water; Public sewer; Cable available; Other utilities
- Home design: Manufactured home; One-story; South-facing; Resale condition
- Construction: Modular construction; Metal roof; 1,480 total building area
- Exterior features: Public maintained road; Not waterfront
Interior
- Kitchen: Electric range; Microwave; Dishwasher; Refrigerator
- Bedrooms: 3 bedrooms on the main level
- Flooring: Laminate; Wood
- Bathrooms: 2 full bathrooms on the main level
- Heating & cooling: Heating present (type: other); Ceiling fans; Wall/window cooling units
- Interior features: Built-in features; Walk-in closets; Accessible kitchen
- Laundry & utility: In-unit laundry; Electric water heater
Neighborhood map
What this means for you Summary
Snapshot
- This is a 3-bed/2.0-bath manufactured listed at $270k.
Deal economics
- At list price, monthly cash flow is $699 ($8k/yr) — positive.
- The deal already cash-flows at list — no discount required.
- Meets the 1% rule at list price ($3k rent vs $270k).
- Recommended offer: $262k (3.0% below list) — sets the bar for market timing.
- Cap rate 9.4% vs local median 3.9% in Dania Beach — top-decile yield for the area; either an underpriced asset or a hidden risk that comps aren't pricing in. Stress-test before assuming the spread holds.
Location & tenants
- Location reads 77/100 on livability (#180 in FL, #2,806 nationally) — a middle-class / working-renter tenant base. Strengths: commute A+, cost of living A, housing A; Watch: employment D, amenities F.
- Broward (suburban): math 42% / reading 53% proficiency, ranked #46 of 73 in FL (top 63%) — families likely to look elsewhere, expect single-tenant / working-renter base with shorter leases.
- Zoned schools: Mary M Bethune Elementary School (math 27% / reading 27%, grade F, #1,969 of 2,144 statewide, top 94%, 413 students, 90% FRL); Attucks Middle School (math 35% / reading 46%, grade F, #360 of 571 statewide, top 64%, 738 students, 75% FRL); Hollywood Hills High School (math 14% / reading 31%, grade F, #539 of 667 statewide, top 81%, 1,718 students, 68% FRL) — zoned schools average 78% FRL vs 51% district-wide (27 pts higher); higher-poverty schools than district average — tighter screening recommended.
- Zoned-school proficiency averages 30% at this address vs 48% district-wide (-18 pts) — the specific schools serving this property underperform the Broward average; the district grade overstates school quality for this exact location.
- Market conditions: Rents rising (+1.3%/yr); 412 active listings in the ZIP; 40 comparable units currently listed for rent nearby; rentals at typical pace (median 24d on market — plan ~3-4 weeks tenant-placement turnaround); solid renter incomes; 2,111 units permitted in Broward County in 2024 (1,265 in 5+ unit buildings).
- At $3,033/mo this rent would consume 48% of the median local household income ($76k/yr) (locally 1903% of renters already pay >50% of income on rent) — very limited rent-growth headroom before tenants either downsize or default.
Forward outlook
- Local home prices are declining (-3.0%/yr); year-one equity from $2k of loan paydown is wiped out by about $8k of value loss. Plan a longer hold.
- Broward County population projected at +34% by 2050 — long-run rental-demand tailwind backs the buy-and-hold thesis.
Negotiation context
- It's been on market 39 days — a 3% lower offer ($262k) is reasonable based on typical stale-listing flexibility.
- 2 sale attempts since 25y ago with the ask held roughly flat each time — persistent listings suggest the price (not the market) is what's stuck; bring a comps-based counter.
- Current owner paid $94k; list at $270k implies a 186% gain — meaningful room to come down on a strong offer.
Risks & watch-outs
- Climate carrying-cost: severe wind risk, 99% chance of damaging wind over 30y; extreme-heat days projected 6→21/yr by 2055 (HVAC capex compounding) — expect insurance premiums to compound above CPI over the hold.
Questions for the listing agent
- It's been on market 39 days. Have you received any prior offers? Is the seller open to a 3% concession, seller financing, or rate buy-down credit?
- What does the HOA fee cover, when was the last increase, and are there any pending special assessments or reserve-fund shortfalls?
- Is there a deadline driving the sale (1031 exchange, divorce, estate, relocation)? That informs how much negotiation room exists.
- Schools are D-rated, which usually means shorter tenancies and higher turnover. Who's the typical renter profile here, and what's been the actual vacancy rate?
- What's the average days-on-market for RENTAL listings here right now (not sales)? A rising rental-DOM trend means longer vacancies and softer asking-rent achievability than the comps imply.
- What's the recent tenant-quality profile in this submarket — average credit score on applications, eviction rate, late-payment / NSF rate, and stable-employment percentage? A property-management company in the area should have these aggregated.
- How much new for-sale + rental construction is in the pipeline within 1–3 miles? Heavy new supply typically softens prices + rents 12–24 months out; constrained supply supports both.
Investment metrics
- 1% rule
- 1.12% ✓
- Cap rate
- 9.40%
- Cash-on-cash
- 11.09%
- DSCR
- 1.49
- GRM
- 7.4
CMA / ARV
- ARV (on-the-fly)
- $325,600
- Comps found
- 2
Show comp detail 2 sales within ~0.75 mi
| Address | Dist | Beds/Ba | Sqft | Sold | Price | $/sf | Match |
|---|---|---|---|---|---|---|---|
| 5608 Lagoon Dr | 0.65mi | 2/2.0 (-1) | 1,467 (-1%) | 15mo | $280,000 | $191 | 51 |
| 3220 Teakwood Ln | 0.65mi | 3/2.0 | 1,268 (-14%) | 3mo | $279,000 | $220 | 44 |
Match score weights: distance 35% · size 25% · config 20% · recency 20%. Top-matched comps best support the ARV.
Projected returns pro-forma
-3.0% appreciation · 1.3% rent growth · sell at horizon
- IRR
- -1.6%
- Equity multiple
- 0.94×
- Total profit
- $-4,402
- Equity at exit
- $40,243
- IRR
- 6.3%
- Equity multiple
- 1.44×
- Total profit
- $32,994
- Equity at exit
- $23,336
Cash invested: $75,572 (down + closing). Projections, not guarantees.
Landlord ↔ Tenant lean methodology
- Overall (STATE)
- 87 Strongly Landlord-Friendly
- State Florida
- 87 Strongly Landlord-Friendly · R+3
- County
- — inherits STATE
- City
- — inherits STATE
ZIP-level market 33312
- Rents YoY
- 1.3%
- Active inventory
- 412
- Price-to-rent
- 7.4×
Monthly cashflow live
- Estimated rent
- $3,033 high interval (Pro) →
- Mortgage (P&I)
- −$1,415
- Tax from tax record
- −$89 /mo · $1,074/yr
- Insurance
- −$112
- HOA
- −$80
- Vacancy / Maint / Mgmt
- −$637
- Net cashflow
- $699
Break-even live
UW: 25.0% down · 7.5% · 30yr · 1.5% tax · 5.0% vac · 8.0% maint · 8.0% mgmt
Financing live
Cash to close
- Down payment
- $67,475
- Closing costs
- $8,097
- Reserves months
- —
- Total cash needed
- —
Loan-product check · same deal, 3 products live
Conventional
25% down · 7.5% · 30yr
- Down + closing
- —
- Monthly P&I
- —
- Monthly cashflow
- —
- DSCR
- —
- Eligible?
- —
Personal DTI + credit; lowest rate.
DSCR
20% down · 8.5% · 30yr
- Down + closing
- —
- Monthly P&I
- —
- Monthly cashflow
- —
- DSCR
- —
- Eligible?
- —
No personal income docs; deal must DSCR.
Hard money
10% down · 12.0% · 12mo
- Down + closing
- —
- Monthly P&I
- —
- Monthly cashflow
- —
- DSCR
- —
- Eligible?
- —
Short-term bridge; refi at stabilization.
Rent comps 40 comps
| Address | Beds | Baths | Sqft | Rent | $/sqft | DOM | Units | Dist |
|---|---|---|---|---|---|---|---|---|
| 2680 SW 54th St Fort Lauderdale, FL | 3.0 | 2.0 | 1592 | $2,000 | $1.26 | 24d | 1 | 0.11mi |
| 5180 SW 27th Ter Fort Lauderdale, FL | 3.0 | 2.0 | 1495 | $3,000 | $2.01 | 20d | 1 | 0.14mi |
| 5221 SW 25th Ave Fort Lauderdale, FL | 3.0 | 2.0 | 1084 | $2,700 | $2.49 | 5d | 1 | 0.19mi |
| 5420 SW 25th Ave Fort Lauderdale, FL | 3.0 | 2.0 | 1135 | $2,975 | $2.62 | 24d | 1 | 0.21mi |
| 5120 SW 26th Ave Unit 1-2 Fort Lauderdale, FL | 2.0 | 1.0 | 1612 | $2,100 | $1.30 | 3d | 1 | 0.22mi |
| 5120 SW 26th Ave Unit 1-2 Fort Lauderdale, FL | 2.0 | 1.0 | 1612 | $2,100 | $1.30 | 2d | 1 | 0.22mi |
| 5434 SW 25th Ave Fort Lauderdale, FL | 3.0 | 2.0 | 1318 | $3,750 | $2.85 | 24d | 1 | 0.23mi |
| 5597 Park Rd Fort Lauderdale, FL | 3.0 | 2.0 | 1038 | $3,000 | $2.89 | 24d | 1 | 0.26mi |
| 2461 SW 50th St Fort Lauderdale, FL | 2.0 | 2.0 | 1008 | $2,300 | $2.28 | 24d | 1 | 0.27mi |
| 2630 SW 49th Ct Fort Lauderdale, FL | 3.0 | 3.0 | 1404 | $3,195 | $2.28 | 24d | 1 | 0.30mi |
| 5643 Park Rd Fort Lauderdale, FL | 3.0 | 2.0 | 1284 | $3,200 | $2.49 | 24d | 1 | 0.32mi |
| 4936 Whispering Way Unit 4936 Fort Lauderdale, FL | 3.0 | 2.5 | 1508 | $4,250 | $2.82 | 24d | 1 | 0.34mi |
| 4936 Whispering Way Fort Lauderdale, FL | 3.0 | 2.5 | 1508 | $4,150 | $2.75 | 7d | 1 | 0.34mi |
| 4920 SW 27th Ave Fort Lauderdale, FL | 3.0 | 2.0 | 1140 | $3,500 | $3.07 | 24d | 1 | 0.35mi |
| 4920 SW 27th Ave Unit 4920 Fort Lauderdale, FL | 3.0 | 2.0 | 1140 | $3,500 | $3.07 | 3d | 1 | 0.35mi |
| 5605 SW 24th Ave Fort Lauderdale, FL | 3.0 | 2.0 | 1333 | $3,500 | $2.63 | 24d | 1 | 0.37mi |
| 4965 Leeward Ln Fort Lauderdale, FL | 3.0 | 2.5 | 1379 | $2,750 | $1.99 | 24d | 1 | 0.38mi |
| 2325 Mariner Ct #2809 Fort Lauderdale, FL | 3.0 | 2.5 | 1391 | $2,575 | $1.85 | 24d | 1 | 0.39mi |
| 4961 Leeward Ln #3102 Fort Lauderdale, FL | 3.0 | 3.0 | 1382 | $2,850 | $2.06 | 10d | 1 | 0.39mi |
| 4964 Leeward Ln Fort Lauderdale, FL | 3.0 | 2.5 | 1400 | $3,000 | $2.14 | 24d | 1 | 0.41mi |
| 2308 Anchor Ct #2703 Fort Lauderdale, FL | 2.0 | 2.5 | 1100 | $2,200 | $2.00 | 24d | 1 | 0.41mi |
| 5840 Lakeshore Dr Fort Lauderdale, FL | 1.0–3.0 | 1.0–2.0 | 1056 | $3,787 | $3.59 | 1d | 31 | 0.42mi |
| 2307 Anchor Ct #4006 Fort Lauderdale, FL | 3.0 | 3.0 | 1382 | $2,700 | $1.95 | 3d | 1 | 0.42mi |
| 2307 Anchor Ct #4006 Fort Lauderdale, FL | 3.0 | 3.0 | 1382 | $2,700 | $1.95 | 24d | 1 | 0.42mi |
| 3050 Park Pl #5838 Fort Lauderdale, FL | 3.0 | 2.5 | 1854 | $3,950 | $2.13 | 24d | 1 | 0.45mi |
| 5741 SW 24th Ave Unit A Fort Lauderdale, FL | 3.0 | 2.0 | 1056 | $3,400 | $3.22 | 7d | 1 | 0.46mi |
| 5741 SW 24th Ave Unit A Fort Lauderdale, FL | 3.0 | 2.0 | 1056 | $3,400 | $3.22 | 2d | 1 | 0.46mi |
| 3028 Lakeshore Dr Fort Lauderdale, FL | 3.0 | 2.0 | 1472 | $2,350 | $1.60 | 24d | 1 | 0.47mi |
| 2701 SW 58th Mnr Unit B Fort Lauderdale, FL | 2.0 | 2.0 | 1292 | $2,750 | $2.13 | 20d | 1 | 0.47mi |
| 4951 Tradewinds Ter #707 Fort Lauderdale, FL | 3.0 | 2.5 | 1616 | $2,600 | $1.61 | 24d | 1 | 0.50mi |
| 4924 SW 30th Ter Fort Lauderdale, FL | 3.0 | 2.5 | 1820 | $2,950 | $1.62 | 15d | 1 | 0.50mi |
| 3100 SW 50th St Fort Lauderdale, FL | 2.0 | 1.5 | 1110 | $2,600 | $2.34 | 2d | 1 | 0.51mi |
| 5201 SW 31st Ave #183 Fort Lauderdale, FL | 3.0 | 2.0 | 1412 | $2,500 | $1.77 | 24d | 1 | 0.51mi |
| 4950 Tradewinds Ter #505 Fort Lauderdale, FL | 3.0 | 3.0 | 1382 | $2,700 | $1.95 | 10d | 1 | 0.52mi |
| 4950 Tradewinds Ter #505 Fort Lauderdale, FL | 3.0 | 3.0 | 1382 | $2,700 | $1.95 | 14d | 1 | 0.52mi |
| 3070 Red Mangrove Ln S Unit 202-2 Fort Lauderdale, FL | 3.0 | 3.0 | 1410 | $2,550 | $1.81 | 16d | 1 | 0.52mi |
| 4907 Spinnaker Dr #4807 Fort Lauderdale, FL | 3.0 | 2.5 | 1391 | $2,650 | $1.91 | 7d | 1 | 0.53mi |
| 2460 SW 58th Mnr Fort Lauderdale, FL | 3.0 | 2.0 | 1300 | $3,400 | $2.62 | 24d | 1 | 0.53mi |
| 2460 SW 58th Mnr Unit 1-2 Fort Lauderdale, FL | 3.0 | 2.0 | 1300 | $3,300 | $2.54 | 24d | 1 | 0.53mi |
| 5201 SW 31st Ave #195 Fort Lauderdale, FL | 2.0 | 2.0 | 1348 | $2,649 | $1.97 | 11d | 1 | 0.54mi |
HOA detail
- Monthly dues
- $80 · $960/yr
Listing history 14 events
-
2026-06-18days on market $269,900 Active 39 DOM
-
2026-06-17days on market $269,900 Active 38 DOM
-
2026-06-16days on market $269,900 Active 37 DOM
-
2026-06-15days on market $269,900 Active 36 DOM
-
2026-06-13days on market $269,900 Active 34 DOM
-
2026-06-09days on market $269,900 Active 30 DOM
-
2026-06-08status $269,900 Active 29 DOM
-
2026-04-27$269,900 Active
-
2004-04-29soldstatus $94,300
-
2002-08-29soldstatus $49,990 157-char remark
Show marketing remark (157 chars)
''PROPERTY SOLD ''''AS-IS'''' LIENS OR CODE VIOLATIONS MAY OR MAY NOT EXIST ON THIS'' PROPERTY AND ARE THE RESPONSIBILITY OF THE BROKER/PURCHASER TO RESOLVE.
-
2002-05-22historical 157-char remark
Show marketing remark (157 chars)
''PROPERTY SOLD ''''AS-IS'''' LIENS OR CODE VIOLATIONS MAY OR MAY NOT EXIST ON THIS'' PROPERTY AND ARE THE RESPONSIBILITY OF THE BROKER/PURCHASER TO RESOLVE.
-
2001-07-12$47,000 157-char remark
Show marketing remark (157 chars)
''PROPERTY SOLD ''''AS-IS'''' LIENS OR CODE VIOLATIONS MAY OR MAY NOT EXIST ON THIS'' PROPERTY AND ARE THE RESPONSIBILITY OF THE BROKER/PURCHASER TO RESOLVE.
-
1996-12-13soldstatus $65,000
-
1993-03-05soldstatus $50,000
ⓘ Source: listings_history table (triggers on properties + properties_extension) + one-shot
backfill from property_details.listing_events for pre-trigger history.
Tax reassessment forecast FL · Resets to sale price
- Current annual tax
- $1,074 · $89/mo
- Projected year-2 tax
- $2,240 · $187/mo
- Expected delta
- +$1,166/yr (+$97/mo · 108.6%)
ⓘ Screening estimate from a state-policy table — verify with the county assessor before closing.
Climate risk First Street
- Flood 1/10 Low FEMA zone X (shaded) · 0% chance over 30 yrs
- Wildfire 1/10 Low
- Heat 10/10 Extreme 6 d/yr ≥105°F today · 21 d/yr by 30 yrs out
- Wind 10/10 Extreme 99% chance of damaging wind over 30 yrs
- Air quality 2/10 Low 2 unhealthy d/yr today · 2 by 30 yrs out
Nearby sold comps map
Loading sold comps map…
Walkable amenities ~0.75 mi
Loading nearby amenities…
Taxation est. · year 1
- Rental income
- $36,393
- − Mortgage interest
- −$15,119
- − Property taxes
- −$1,074
- − Insurance
- −$1,350
- − Repairs & maintenance
- −$2,911
- − Management
- −$2,911
- − HOA
- −$960
- − Depreciation
- −$7,852
- Taxable income
- $4,217
- Est. tax owed @ 24.0%
- −$1,012
- After-tax cash flow
- $7,371/yr
For passive investors: Depreciation is non-cash, so a rental often shows a tax loss while cash-flowing — sheltering income. Rental losses are passive: they offset passive income freely, and up to $25,000/yr can offset ordinary (W-2) income if you actively participate and your MAGI is under $100k (phasing out to $0 by $150k); unused losses carry forward. On sale, claimed depreciation is recaptured at up to 25%, and gains may owe capital-gains tax (a 1031 exchange can defer both). Figures are a year-1 estimate at your 24.0% rate — not tax advice; consult a CPA.
Schools (NCES district)
- District
- Broward
- NCES district ID
- 1200180
- Math proficiency
- 42% ▼ -18.00%
- Reading proficiency
- 53% ▼ -5.00%
- Median HH income
- $52,139
- Composite
- 40.88/100
- National rank
- #3621
- State rank
- #46 of 73 in FL
Livability — Dania Beach
- Score
- 77/100
- State rank
- #180
- US rank
- #2806
Category grades
Schools grade is shown separately in the Schools card above.
Census & demographics
- Census place
- Dania Beach, FL
- County
- Broward County · 1,963,430 people
- City population
- 17,094
- Metro
- Miami-Fort Lauderdale-Pompano Beach, FL
- Population (ZIP)
- 52,798
- Household income
- $75,952
- Rent vs Own
- Severe rent burden
- 1903.0
Population outlook (Broward County) Hauer SSP2
- Today (2025)
- 2,207,033 people
- By 2030
- 2,360,704 · +7.0%
- By 2040
- 2,661,208 · +20.6%
- By 2050
- 2,946,698 · +33.5%
- By 2075
- 3,602,273 · +63.2%
- By 2100
- 3,970,984 · +79.9%
Race, ethnicity, and origin ACS 2023
- Neighborhood character
- Highly diverse neighborhood (Simpson 0.70)
- Race & ethnicity
- White 34% Hispanic / Latino 32% Black 29% Two or more races 20% Asian 2%
- Hispanic origin (detail)
- Mexican 2% Puerto Rican 5% Cuban 6% Salvadoran 1%
- Common ancestry
- Hispanic 6% Romanian 3% Italian 1%
- Foreign-born
- 33% · Canada, Jamaica, Dominican Republic
- Languages at home
- 59% English-only · Spanish 29% French/Haitian/Cajun 7% Other Indo-European 2%
Political lean MEDSL · Broward
- 2024 margin
- D (+17.0) · D 58.0% · R 41.0%
- 2008→2024 swing
- -17.8pp toward R · 2008: 34.7pp · 2024: 17.0pp
- All cycles
- 2024: D+17.0 2020: D+29.8 2016: D+35.0 2012: D+34.9 2008: D+34.7
Not yet ingested
- Civics
- —
Market trends
- HPI YoY
- ▼ -323.99%
- Current HPI
- 382.6298
- Rent YoY
- ▲ 1.30%
- Metro
- Miami-Fort Lauderdale-Pompano Beach, FL
- State GDP YoY
- ▲ 3.28%
- F500 in state
- 36
Industry mix (Fortune 500 HQ in FL)
| Industry | F500 HQs | Revenue |
|---|---|---|
| Industrial Technology | 2 | $29B |
|
||
| Insurance | 2 | $17B |
|
||
| Retail | 1 | $60B |
|
||
| Technology Distribution | 1 | $58B |
|
||
| Homebuilding | 1 | $35B |
|
||
| Technology Manufacturing | 1 | $35B |
|
||
Price history
+439.8% since first listed7 events — show timeline
- 2026-04-27 Listed $269,900 Beaches MLS
- 2004-04-29 Sold (Public Records) $94,300 Public Records
- 2002-08-29 Sold (MLS) $49,990 Beaches MLS
- 2002-05-22 Listing Removed — Beaches MLS
- 2001-07-12 Listed $47,000 Beaches MLS
- 1996-12-13 Sold (Public Records) $65,000 Public Records
- 1993-03-05 Sold (Public Records) $50,000 Public Records
Property tax history
+2.6%/yrLatest (2025): $1,074 · +6.4% YoY. Source: county tax records.
Cash-flow waterfall
monthlySold comps — $/sqft
last 12 mo · ≤1 miLoading sold comps…