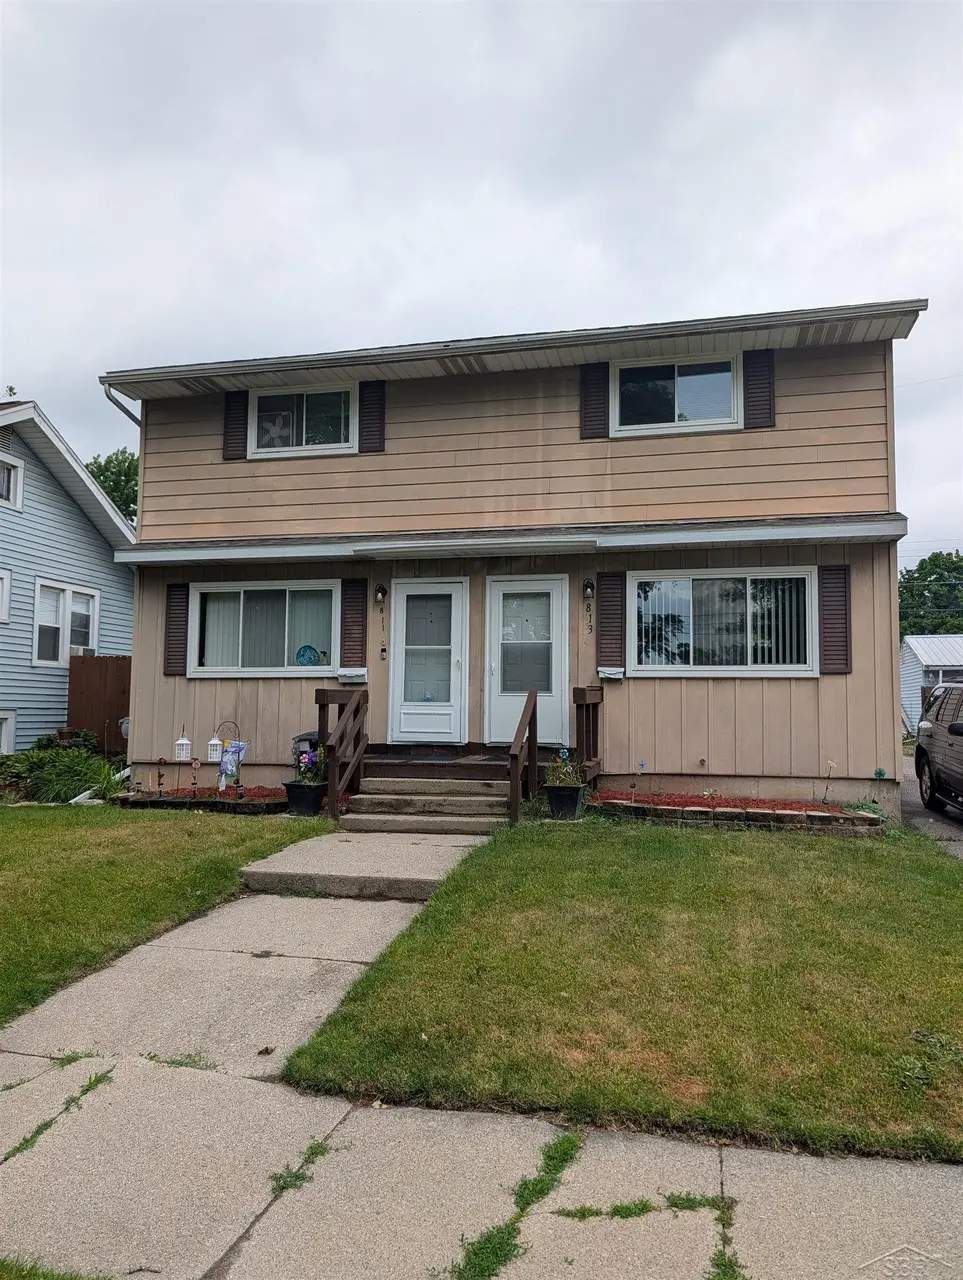
811 N Fayette St · Saginaw, MI
Flood risk 1/10 · Minimal
- FEMA flood zone
- X (unshaded)
- Chance of flooding over 30 yrs
- 0.0%
- Est. flood insurance / yr
- $473 – $860
Fire risk 1/10 · Minimal
- Est. fire insurance / yr
- $784 – $1,456
Heat risk 2/10 · Minimal
- Hot days now (above 100°F)
- 7 days/yr
- Hot days in 30 yrs
- 14 days/yr
Wind risk 1/10 · Minimal
- Chance of severe wind over 30 yrs
- —
Air-quality risk 2/10 · Minimal
- Unhealthy air days now
- 1 days/yr
- Unhealthy air days in 30 yrs
- 2 days/yr
Risk factors via First Street. Map © Google.
Why this score? — see what drove the F grade
The composite is a weighted blend of 9 inputs, each scored 0–100. Each bar is that input's sub-score; the figure is the points it added to the 100-point composite (weight × sub-score).
- Cash flow +14.1/30.0
- DSCR +4.3/10.0
- Rent growth +3.5/5.0
- 1% rule +3.3/10.0
- Livability +3.2/5.0
- Condition / age +2.5/5.0
- Schools +2.0/10.0
- ARV discount +0.0/15.0
- Appreciation +0.0/10.0
$149,900
🖨 Deal sheet (PDF) 📄 Offer letter ✓ Due diligence
Listing remarks
Excellent investment opportunity with this well-maintained two-unit property conveniently located near local hospitals. Each unit offers private washer and dryer hookups and full basements for additional storage. Tenants are responsible for snow removal and lawn care, helping keep operating costs low, while the owner pays water. The vacant unit has been refreshed with new flooring and fresh paint, making it move-in ready for a new tenant or owner-occupant. Outdoor features include patios for both units, a fenced backyard on one side, and an alley providing additional access to the property. Ample rear parking adds convenience for residents and guests alike. A great opportunity for investors
Key facts
- Two-unit property
- Desirable location
- Fenced backyard
Tags
Property features AI
Finance
- Other: Subdivision: SAGINAW DIVISION NORTH; Cross streets: Miller / Throop; Building features include alley access
- Financial info: Two rental units with current actual rents of $900 and $900
Exterior
- Parking: Assigned parking
- Utilities: Public water; Public sewer
- Home design: Multi-family residential income property; Two stories
- Construction: Above-grade finished area approximately 1,822 (finished area); Zoned residential; Lot dimensions approximately 50 x 120
- Exterior features: Patio; Porch; Fenced yard; Paved road access; Curbs
Interior
- Bathrooms: 1 full bathroom; 1 half bathroom
- Heating & cooling: Forced air heating (natural gas); Separate meters; No central cooling
- Interior features: Gas water heater; Full basement
Neighborhood map
What this means for you Summary
Snapshot
- This is a 4-bed/3.0-bath single-family listed at $150k.
Deal economics
- At list price, monthly cash flow is $22 ($261/yr) — positive.
- The deal already cash-flows at list — no discount required.
- To meet the 1% rule (rent ≥ 1% of price), the offer needs to be $124k (17.4% below list).
- Recommended offer: $124k (17.4% below list) — sets the bar for 1% rule.
- Cap rate 6.5% vs local median 8.3% in Saginaw — below-typical yield; the buyer is paying a premium for something (appreciation thesis, condition, location) that the cap rate doesn't capture.
Location & tenants
- Location reads 63/100 on livability (#521 in MI) — a middle-class / working-renter tenant base. Strengths: cost of living A+, housing A+, health & safety A+; Watch: schools F, crime F, amenities F.
- Saginaw School District (urban): math 20% / reading 29% proficiency, ranked #444 of 540 in MI (top 82%) — low school quality limits family demand, transient renter base, plan for 1-2y turnover; 76% free/reduced lunch — lower-income household profile, screen leases tightly.
- Market conditions: Rents rising (+4.0%/yr); 250 active listings in the ZIP; 154 units permitted in Saginaw County in 2024 (0 in 5+ unit buildings).
- This rent runs 32% of the median local income ($47k/yr) — at the standard rent-burdened threshold; future hikes will face affordability resistance.
Forward outlook
- Local home prices are declining (-3.0%/yr); year-one equity from $1k of loan paydown is wiped out by about $4k of value loss. Plan a longer hold.
- Saginaw County population projected at -25% by 2050 — secular population decline; favor cash flow + early exit over multi-decade hold.
Negotiation context
- Only 10 days on market — expect competitive offers; lowballing is unlikely to land.
- 3 sale attempts since 20y ago with the ask held roughly flat each time — persistent listings suggest the price (not the market) is what's stuck; bring a comps-based counter.
- Current owner paid $58k; list at $150k implies a 161% gain — meaningful room to come down on a strong offer.
Questions for the listing agent
- Built in 1976 — when were the roof, HVAC, electrical panel, plumbing, and water heater last replaced?
- Is there a deadline driving the sale (1031 exchange, divorce, estate, relocation)? That informs how much negotiation room exists.
- Schools are F-rated, which usually means shorter tenancies and higher turnover. Who's the typical renter profile here, and what's been the actual vacancy rate?
- Crime grade is F in this area — have there been break-ins, vandalism, or insurance claims at this property in the last 3 years? What carrier currently insures it and at what premium?
- The area grade is low — what's the realistic commute time and amenity access for the typical tenant pool here? Any planned neighborhood developments (good or bad) we should know about?
- What's the average days-on-market for RENTAL listings here right now (not sales)? A rising rental-DOM trend means longer vacancies and softer asking-rent achievability than the comps imply.
- What's the recent tenant-quality profile in this submarket — average credit score on applications, eviction rate, late-payment / NSF rate, and stable-employment percentage? A property-management company in the area should have these aggregated.
- How much new for-sale + rental construction is in the pipeline within 1–3 miles? Heavy new supply typically softens prices + rents 12–24 months out; constrained supply supports both.
Investment metrics
- 1% rule
- 0.83% ✗
- Cap rate
- 6.47%
- Cash-on-cash
- 0.62%
- DSCR
- 1.03
- GRM
- 10.1
CMA / ARV
- ARV (on-the-fly)
- $116,736
- Comps found
- 12
Show comp detail 12 sales within ~0.75 mi
| Address | Dist | Beds/Ba | Sqft | Sold | Price | $/sf | Match |
|---|---|---|---|---|---|---|---|
| 516 N Granger St | 0.24mi | 4/2.0 | 1,862 (+2%) | 7mo | $150,000 | $81 | 75 |
| 807 N Bond St | 0.29mi | 4/2.0 | 1,792 (-2%) | 10mo | $63,000 | $35 | 72 |
| 521 N Granger St | 0.26mi | 4/1.0 | 1,736 (-5%) | 9mo | $112,900 | $65 | 65 |
| 412 N Oakley St | 0.42mi | 4/1.0 | 1,905 (+4%) | 7mo | $36,000 | $19 | 60 |
| 513 N Oakley St | 0.40mi | 4/1.5 | 1,644 (-10%) | 8mo | $65,000 | $40 | 52 |
| 1614 Barnard St | 0.64mi | 4/2.0 | 1,677 (-8%) | 4mo | $160,000 | $95 | 49 |
| 203 N Webster St | 0.43mi | 3/2.0 (-1) | 1,607 (-12%) | 4mo | $115,000 | $72 | 48 |
| 723 N Granger St | 0.18mi | 3/1.0 (-1) | 1,568 (-14%) | 14mo | $45,000 | $29 | 43 |
| 1715 Monroe St | 0.67mi | 3/2.0 (-1) | 1,716 (-6%) | 14mo | $110,000 | $64 | 38 |
| 804 Congress Ave | 0.74mi | 4/1.0 | 2,034 (+12%) | 1mo | $138,000 | $68 | 38 |
| 1118 Cass St | 0.71mi | 3/1.5 (-1) | 1,617 (-11%) | 7mo | $46,500 | $29 | 31 |
| 1802 N Mason St | 0.70mi | 3/1.5 (-1) | 1,988 (+9%) | 13mo | $47,700 | $24 | 30 |
Match score weights: distance 35% · size 25% · config 20% · recency 20%. Top-matched comps best support the ARV.
Projected returns pro-forma
-3.0% appreciation · 3.98% rent growth · sell at horizon
- IRR
- -14.3%
- Equity multiple
- 0.48×
- Total profit
- $-21,701
- Equity at exit
- $22,351
- IRR
- -4.2%
- Equity multiple
- 0.71×
- Total profit
- $-12,074
- Equity at exit
- $12,961
Cash invested: $41,972 (down + closing). Projections, not guarantees.
Landlord ↔ Tenant lean methodology
- Overall (STATE)
- 62 Landlord-Friendly
- State Michigan
- 62 Landlord-Friendly · EVEN
- County
- — inherits STATE
- City
- — inherits STATE
ZIP-level market 48602
- Home prices YoY
- -19.7%
- Rents YoY
- 4.0%
- Active inventory
- 250
- Price-to-rent
- 10.1×
Monthly cashflow live
- Estimated rent
- $1,238 medium interval (Pro) →
- Mortgage (P&I)
- −$786
- Tax from tax record
- −$108 /mo · $1,292/yr
- Insurance
- −$62
- HOA
- −$0
- Vacancy / Maint / Mgmt
- −$260
- Net cashflow
- $22
Break-even live
Sensitivity live
| Price | -10% $107 | -5% $64 | +0% $22 | +5% $-21 | +10% $-63 |
|---|---|---|---|---|---|
| Rent | -10% $-76 | -5% $-27 | +0% $22 | +5% $71 | +10% $120 |
| Rate | -1.0pp $97 | -0.5pp $60 | base $22 | +0.5pp $-17 | +1.0pp $-57 |
UW: 25.0% down · 7.5% · 30yr · 1.5% tax · 5.0% vac · 8.0% maint · 8.0% mgmt
Financing live
Cash to close
- Down payment
- $37,475
- Closing costs
- $4,497
- Reserves months
- —
- Total cash needed
- —
Loan-product check · same deal, 3 products live
Conventional
25% down · 7.5% · 30yr
- Down + closing
- —
- Monthly P&I
- —
- Monthly cashflow
- —
- DSCR
- —
- Eligible?
- —
Personal DTI + credit; lowest rate.
DSCR
20% down · 8.5% · 30yr
- Down + closing
- —
- Monthly P&I
- —
- Monthly cashflow
- —
- DSCR
- —
- Eligible?
- —
No personal income docs; deal must DSCR.
Hard money
10% down · 12.0% · 12mo
- Down + closing
- —
- Monthly P&I
- —
- Monthly cashflow
- —
- DSCR
- —
- Eligible?
- —
Short-term bridge; refi at stabilization.
Listing history 8 events
-
2026-06-19days on market $149,900 Active 10 DOM
-
2026-06-18days on market $149,900 Active 9 DOM
-
2026-06-17days on market $149,900 Active 8 DOM
-
2026-06-16days on market $149,900 Active 7 DOM
-
2026-06-15days on market $149,900 Active 6 DOM
-
2026-06-14days on market $149,900 Active 4 DOM
-
2026-06-12remarks 699-char remark
-
2026-06-12$149,900 Active 3 DOM
ⓘ Source: listings_history table (triggers on properties + properties_extension) + one-shot
backfill from property_details.listing_events for pre-trigger history.
Tax reassessment forecast MI · Partial reset (capped growth)
- Current annual tax
- $1,292 · $108/mo
- Projected year-2 tax
- $1,800 · $150/mo
- Expected delta
- +$508/yr (+$42/mo · 39.3%)
ⓘ Screening estimate from a state-policy table — verify with the county assessor before closing.
Climate risk First Street
- Flood 1/10 Low FEMA zone X (unshaded) · 0% chance over 30 yrs
- Wildfire 1/10 Low
- Heat 2/10 Low 7 d/yr ≥100°F today · 14 d/yr by 30 yrs out
- Wind 1/10 Low
- Air quality 2/10 Low 1 unhealthy d/yr today · 2 by 30 yrs out
Nearby sold comps map
Loading sold comps map…
Walkable amenities ~0.75 mi
Loading nearby amenities…
Taxation est. · year 1
- Rental income
- $14,856
- − Mortgage interest
- −$8,397
- − Property taxes
- −$1,292
- − Insurance
- −$750
- − Repairs & maintenance
- −$1,188
- − Management
- −$1,188
- − Depreciation
- −$4,361
- Taxable loss
- −$2,320
- Est. tax savings @ 24.0%
- +$557
- After-tax cash flow
- $818/yr
For passive investors: Depreciation is non-cash, so a rental often shows a tax loss while cash-flowing — sheltering income. Rental losses are passive: they offset passive income freely, and up to $25,000/yr can offset ordinary (W-2) income if you actively participate and your MAGI is under $100k (phasing out to $0 by $150k); unused losses carry forward. On sale, claimed depreciation is recaptured at up to 25%, and gains may owe capital-gains tax (a 1031 exchange can defer both). Figures are a year-1 estimate at your 24.0% rate — not tax advice; consult a CPA.
Schools (NCES district)
- District
- Saginaw School District
- NCES district ID
- 2630390
- Math proficiency
- 20% ▼ -5.00%
- Reading proficiency
- 29% ▼ -3.00%
- Median HH income
- $28,940
- Composite
- 19.6/100
- National rank
- #8755
- State rank
- #444 of 540 in MI
Livability — Saginaw
- Score
- 63/100
- State rank
- #521
- US rank
- #15424
Category grades
Schools grade is shown separately in the Schools card above.
Census & demographics
- Census place
- Saginaw, MI
- County
- Saginaw County · 54,884 people
- City population
- 54,884
- Metro
- Saginaw, MI
- Population (ZIP)
- 27,127
- Household income
- $46,984
- Rent vs Own
- Severe rent burden
- 1416.0
Population outlook (Saginaw County) Hauer SSP2
- Today (2025)
- 180,568 people
- By 2030
- 172,302 · -4.6%
- By 2040
- 153,919 · -14.8%
- By 2050
- 135,519 · -24.9%
- By 2075
- 97,199 · -46.2%
- By 2100
- 65,037 · -64.0%
Race, ethnicity, and origin ACS 2023
- Neighborhood character
- Diverse neighborhood (Simpson 0.64)
- Race & ethnicity
- White 50% Black 27% Hispanic / Latino 17% Two or more races 12%
- Hispanic origin (detail)
- Mexican 14% Puerto Rican 1%
- Common ancestry
- Romanian 4% Lithuanian 3% Italian 2%
- Foreign-born
- 1% · Canada
- Languages at home
- 96% English-only · Spanish 3%
Political lean MEDSL · Saginaw
- 2024 margin
- Toss-up / Even · D 47.7% · R 51.0% · Other 1.4%
- 2008→2024 swing
- -20.6pp toward R · 2008: 17.3pp · 2024: -3.3pp
- All cycles
- 2024: R+3.3 2020: D+0.3 2016: R+1.1 2012: D+11.9 2008: D+17.3
Not yet ingested
- Civics
- —
Market trends
- HPI YoY
- ▼ -39.15%
- Current HPI
- 159.8807
- Rent YoY
- ▲ 3.98%
- Metro
- Saginaw, MI
- State GDP YoY
- ▲ 1.37%
- F500 in state
- 28
Industry mix (Fortune 500 HQ in MI)
| Industry | F500 HQs | Revenue |
|---|---|---|
| Automotive Parts | 3 | $48B |
|
||
| Automotive | 2 | $372B |
|
||
| Chemicals | 1 | $45B |
|
||
| Automotive Retail | 1 | $29B |
|
||
| Healthcare / Medical Devices | 1 | $23B |
|
||
| Automotive Technology | 1 | $20B |
|
||
Price history
+139.8% since first listed7 events — show timeline
- 2026-06-09 Listed $149,900 REALCOMP
- 2006-06-27 Sold (Public Records) $57,500 Public Records
- 2006-06-14 Sold (MLS) $57,500 MiRealSource-MiMLS
- 2006-05-10 Listing Removed — MiRealSource-MiMLS
- 2006-05-10 Listing Removed — MiRealSource-MiMLS
- 2006-05-09 Listed $59,900 MiRealSource-MiMLS
- 2006-01-03 Listed $62,500 MiRealSource-MiMLS
Property tax history
+0.5%/yrLatest (2025): $1,292 · -16.3% YoY. Source: county tax records.
Cash-flow waterfall
monthlySold comps — $/sqft
last 12 mo · ≤1 miLoading sold comps…