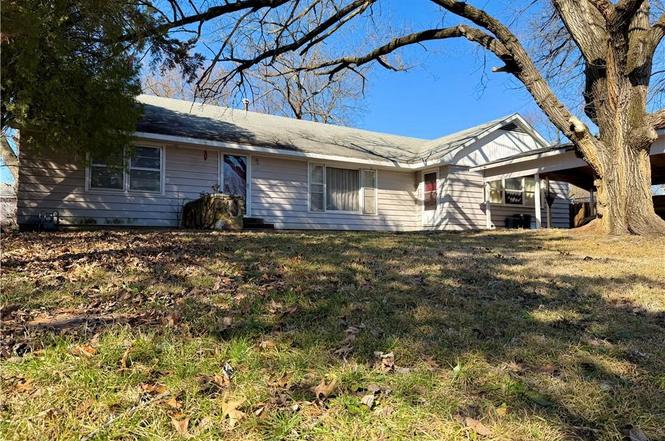
609 Ridge St · Yates Center, KS
Flood risk 1/10 · Minimal
- FEMA flood zone
- —
- Chance of flooding over 30 yrs
- 0.0%
- Est. flood insurance / yr
- —
Fire risk 3/10 · Minor
- Est. fire insurance / yr
- $1,154 – $2,142
Heat risk 4/10 · Minor
- Hot days now (above 107°F)
- 7 days/yr
- Hot days in 30 yrs
- 18 days/yr
Wind risk 2/10 · Minimal
- Chance of severe wind over 30 yrs
- 1.0%
Air-quality risk 2/10 · Minimal
- Unhealthy air days now
- 1 days/yr
- Unhealthy air days in 30 yrs
- 2 days/yr
Risk factors via First Street. Map © Google.
Why this score? — see what drove the B grade
The composite is a weighted blend of 9 inputs, each scored 0–100. Each bar is that input's sub-score; the figure is the points it added to the 100-point composite (weight × sub-score).
- Cash flow +24.8/30.0
- ARV discount +15.0/15.0
- Appreciation +9.8/10.0
- DSCR +8.1/10.0
- 1% rule +6.4/10.0
- Livability +3.0/5.0
- Schools +2.8/10.0
- Rent growth +2.5/5.0
- Condition / age +2.5/5.0
$99,999
🖨 Deal sheet (PDF) 📄 Offer letter ✓ Due diligence
Key facts
- Ranch style home
- Storm shelter
- 0.29 acre lot
Tags
Neighborhood map
What this means for you Summary
Snapshot
- This is a 3-bed/1.5-bath single-family listed at $100k.
Deal economics
- At list price, monthly cash flow is $213 ($3k/yr) — positive.
- The deal already cash-flows at list — no discount required.
- Meets the 1% rule at list price ($1k rent vs $100k).
- Recommended offer: $94k (6.0% below list) — sets the bar for market timing.
Location & tenants
- Location reads 60/100 on livability (#451 in KS) — a middle-class / working-renter tenant base. Strengths: cost of living A+, crime A-; Watch: health & safety C-, schools F, amenities F.
- Woodson (rural): math 30% / reading 38% proficiency, ranked #83 of 169 in KS (top 49%) — families likely to look elsewhere, expect single-tenant / working-renter base with shorter leases.
- Market conditions: 3 active listings in the ZIP; 13 units permitted in Woodson County in 2024 (0 in 5+ unit buildings).
Forward outlook
- In year one you build about $10k of equity ($691 loan paydown + $10k appreciation (9.5% local appreciation)).
- Woodson County population projected at -13% by 2050 — secular population decline; favor cash flow + early exit over multi-decade hold.
- At projected returns (9.5% appreciation + 3.0% rent growth), your $28k cash investment doubles in ~3 years — after that, you're playing with house money.
- By year 4, paydown + projected appreciation supports a ~$36k cash-out refi (75% LTV) — recoverable capital for the next deal without selling this one.
Negotiation context
- It's been on market 63 days — a 6% lower offer ($94k) is reasonable based on typical stale-listing flexibility.
Risks & watch-outs
- Watch-outs: built in 1956 — expect roof / HVAC / electrical / plumbing capex.
Questions for the listing agent
- It's been on market 63 days. Have you received any prior offers? Is the seller open to a 6% concession, seller financing, or rate buy-down credit?
- Built in 1956 — when were the roof, HVAC, electrical panel, plumbing, and water heater last replaced?
- Why hasn't it sold? Are there any deal-killer items the seller is aware of (foundation, flood, title, zoning, code violations)?
- Is there a deadline driving the sale (1031 exchange, divorce, estate, relocation)? That informs how much negotiation room exists.
- Schools are F-rated, which usually means shorter tenancies and higher turnover. Who's the typical renter profile here, and what's been the actual vacancy rate?
- What's the average days-on-market for RENTAL listings here right now (not sales)? A rising rental-DOM trend means longer vacancies and softer asking-rent achievability than the comps imply.
- What's the recent tenant-quality profile in this submarket — average credit score on applications, eviction rate, late-payment / NSF rate, and stable-employment percentage? A property-management company in the area should have these aggregated.
- How much new for-sale + rental construction is in the pipeline within 1–3 miles? Heavy new supply typically softens prices + rents 12–24 months out; constrained supply supports both.
Investment metrics
- 1% rule
- 1.14% ✓
- Cap rate
- 8.85%
- Cash-on-cash
- 9.12%
- DSCR
- 1.41
- GRM
- 7.3
CMA / ARV
- ARV (on-the-fly)
- $168,477
- Comps found
- 3
Show comp detail 3 sales within ~0.75 mi
| Address | Dist | Beds/Ba | Sqft | Sold | Price | $/sf | Match |
|---|---|---|---|---|---|---|---|
| 702 S Grove St | 0.06mi | 3/2.0 | 1,792 (-5%) | 13mo | $155,000 | $86 | 76 |
| 203 E Butler St | 0.49mi | 3/2.0 | 1,792 (-5%) | 1mo | $159,000 | $89 | 65 |
| 401 S Ridge St | 0.16mi | 3/2.0 | 2,104 (+11%) | 13mo | $248,000 | $118 | 61 |
Match score weights: distance 35% · size 25% · config 20% · recency 20%. Top-matched comps best support the ARV.
Projected returns pro-forma
9.54% appreciation · 3.0% rent growth · sell at horizon
- IRR
- 30.1%
- Equity multiple
- 3.32×
- Total profit
- $64,891
- Equity at exit
- $86,738
- IRR
- 26.2%
- Equity multiple
- 7.42×
- Total profit
- $179,701
- Equity at exit
- $183,600
Cash invested: $28,000 (down + closing). Projections, not guarantees.
Landlord ↔ Tenant lean methodology
- Overall (STATE)
- 83 Strongly Landlord-Friendly
- State Kansas
- 83 Strongly Landlord-Friendly · R+10
- County
- — inherits STATE
- City
- — inherits STATE
ZIP-level market 66783
- Home prices YoY
- 5.2%
- Active inventory
- 3
- Price-to-rent
- 7.3×
Monthly cashflow live
- Estimated rent
- $1,144 medium interval (Pro) →
- Mortgage (P&I)
- −$524
- Tax est. 1.5%
- −$125 /mo · $1,500/yr
- Insurance
- −$42
- HOA
- −$0
- Vacancy / Maint / Mgmt
- −$240
- Net cashflow
- $213
Break-even live
Sensitivity live
| Price | -10% $282 | -5% $247 | +0% $213 | +5% $178 | +10% $144 |
|---|---|---|---|---|---|
| Rent | -10% $123 | -5% $168 | +0% $213 | +5% $258 | +10% $303 |
| Rate | -1.0pp $263 | -0.5pp $238 | base $213 | +0.5pp $187 | +1.0pp $161 |
UW: 25.0% down · 7.5% · 30yr · 1.5% tax · 5.0% vac · 8.0% maint · 8.0% mgmt
Financing live
Cash to close
- Down payment
- $25,000
- Closing costs
- $3,000
- Reserves months
- —
- Total cash needed
- —
Loan-product check · same deal, 3 products live
Conventional
25% down · 7.5% · 30yr
- Down + closing
- —
- Monthly P&I
- —
- Monthly cashflow
- —
- DSCR
- —
- Eligible?
- —
Personal DTI + credit; lowest rate.
DSCR
20% down · 8.5% · 30yr
- Down + closing
- —
- Monthly P&I
- —
- Monthly cashflow
- —
- DSCR
- —
- Eligible?
- —
No personal income docs; deal must DSCR.
Hard money
10% down · 12.0% · 12mo
- Down + closing
- —
- Monthly P&I
- —
- Monthly cashflow
- —
- DSCR
- —
- Eligible?
- —
Short-term bridge; refi at stabilization.
Listing history 3 events
-
2026-04-22status Pending
-
2026-04-18price $99,999
-
2026-02-17$107,000 Active
ⓘ Source: listings_history table (triggers on properties + properties_extension) + one-shot
backfill from property_details.listing_events for pre-trigger history.
Climate risk First Street
- Flood 1/10 Low 0% chance over 30 yrs
- Wildfire 3/10 Moderate
- Heat 4/10 Moderate 7 d/yr ≥107°F today · 18 d/yr by 30 yrs out
- Wind 2/10 Low 100% chance of damaging wind over 30 yrs
- Air quality 2/10 Low 1 unhealthy d/yr today · 2 by 30 yrs out
Nearby sold comps map
Loading sold comps map…
Walkable amenities ~0.75 mi
Loading nearby amenities…
Taxation est. · year 1
- Rental income
- $13,731
- − Mortgage interest
- −$5,601
- − Property taxes
- −$1,500
- − Insurance
- −$500
- − Repairs & maintenance
- −$1,099
- − Management
- −$1,099
- − Depreciation
- −$2,909
- Taxable income
- $1,024
- Est. tax owed @ 24.0%
- −$246
- After-tax cash flow
- $2,309/yr
For passive investors: Depreciation is non-cash, so a rental often shows a tax loss while cash-flowing — sheltering income. Rental losses are passive: they offset passive income freely, and up to $25,000/yr can offset ordinary (W-2) income if you actively participate and your MAGI is under $100k (phasing out to $0 by $150k); unused losses carry forward. On sale, claimed depreciation is recaptured at up to 25%, and gains may owe capital-gains tax (a 1031 exchange can defer both). Figures are a year-1 estimate at your 24.0% rate — not tax advice; consult a CPA.
Schools (NCES district)
- District
- Woodson
- NCES district ID
- 2013110
- Math proficiency
- 30% ▲ 1.00%
- Reading proficiency
- 38% ▲ 10.00%
- Median HH income
- $36,430
- Composite
- 28.19/100
- National rank
- #6808
- State rank
- #83 of 169 in KS
Livability — Yates Center
- Score
- 60/100
- State rank
- #451
- US rank
- #19508
Category grades
Schools grade is shown separately in the Schools card above.
Census & demographics
- Census place
- Yates Center, KS
- City population
- 2,117
- Population (ZIP)
- 2,117
Population outlook (Woodson County) Hauer SSP2
- Today (2025)
- 2,847 people
- By 2030
- 2,764 · -2.9%
- By 2040
- 2,567 · -9.8%
- By 2050
- 2,465 · -13.4%
- By 2075
- 2,605 · -8.5%
- By 2100
- 2,612 · -8.3%
Race, ethnicity, and origin ACS 2023
- Neighborhood character
- Predominantly White (93%)
- Race & ethnicity
- White 93% Two or more races 5% Native American 1%
- Common ancestry
- Slovak 3% Romanian 2% Lithuanian 1%
- Foreign-born
- 0%
Political lean MEDSL · Woodson
- 2024 margin
- Solid R (+61.3) · D 18.7% · R 80.0% · Other 1.3%
- 2008→2024 swing
- -27.3pp toward R · 2008: -34.0pp · 2024: -61.3pp
- All cycles
- 2024: R+61.3 2020: R+60.6 2016: R+55.9 2012: R+45.5 2008: R+34.0
Not yet ingested
- Civics
- —
Market trends
- HPI YoY
- ▲ 9.54%
- Current HPI
- 194.0393
- Rent YoY
- —
- Metro
- —
- State GDP YoY
- —
- F500 in state
- 0
Price history
-6.5% since first listed3 events — show timeline
- 2026-04-22 Pending — Heartland MLS as Distributed by MLS Grid
- 2026-04-18 Price Changed $99,999 Heartland MLS as Distributed by MLS Grid
- 2026-02-17 Listed $107,000 Heartland MLS as Distributed by MLS Grid
Cash-flow waterfall
monthlySold comps — $/sqft
last 12 mo · ≤1 miLoading sold comps…