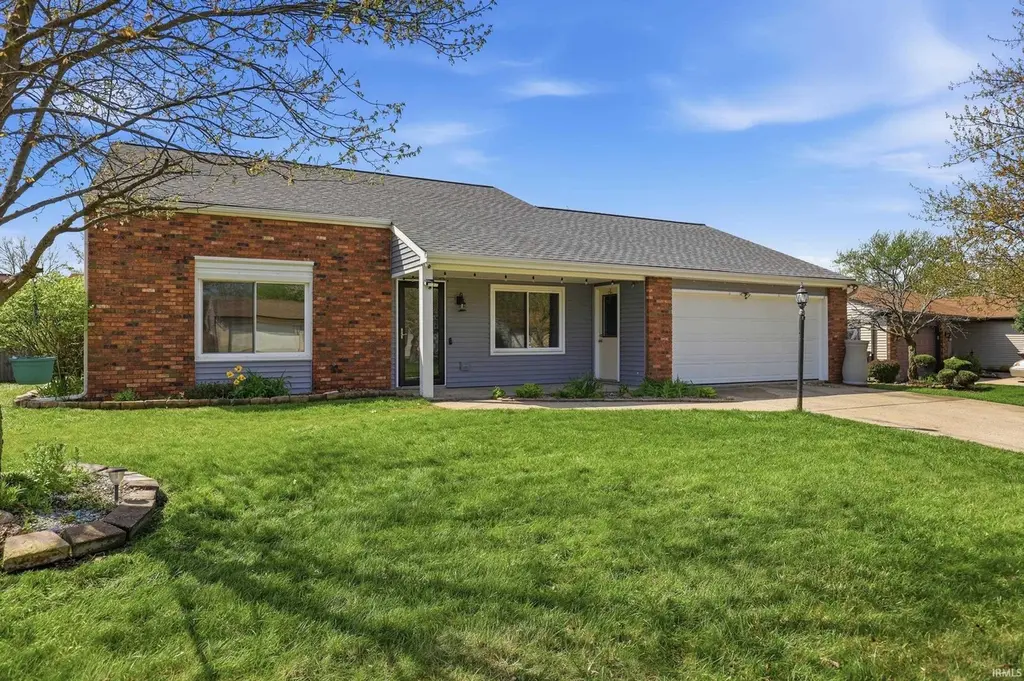
1823 Lima Valley Dr · Fort Wayne, IN
Flood risk 1/10 · Minimal
- FEMA flood zone
- X (unshaded)
- Chance of flooding over 30 yrs
- 0.0%
- Est. flood insurance / yr
- $507 – $1,088
Fire risk 1/10 · Minimal
- Est. fire insurance / yr
- $717 – $1,331
Heat risk 3/10 · Minor
- Hot days now (above 101°F)
- 7 days/yr
- Hot days in 30 yrs
- 17 days/yr
Wind risk 2/10 · Minimal
- Chance of severe wind over 30 yrs
- —
Air-quality risk 2/10 · Minimal
- Unhealthy air days now
- 2 days/yr
- Unhealthy air days in 30 yrs
- 2 days/yr
Risk factors via First Street. Map © Google.
Why this score? — see what drove the D- grade
The composite is a weighted blend of 9 inputs, each scored 0–100. Each bar is that input's sub-score; the figure is the points it added to the 100-point composite (weight × sub-score).
- Cash flow +11.1/30.0
- ARV discount +6.0/15.0
- Rent growth +4.4/5.0
- Livability +4.2/5.0
- 1% rule +3.7/10.0
- DSCR +3.2/10.0
- Condition / age +2.5/5.0
- Schools +2.2/10.0
- Appreciation +0.0/10.0
$240,000
🖨 Deal sheet 📄 Offer letter ✓ Due diligence
Listing remarks MLS
Welcome Home! this 3-bedroom, 2 full bath Home located in a desirable Northwest Fort Wayne neighborhood! Close to I69 , shopping , Banking and trails . This home features numerous recent updates, including new windows, roof, siding, gutters, soffits, and fresh paint giving you peace of mind and modern curb appeal. Inside, you'll find a comfortable layout perfect for everyday Living! you will appreciate the living room , family room and one bedroom on the main level and two on the upper level perfect for spreading out. All appliances stay, making this home truly move-in ready. Step outside to enjoy a fully fenced backyard, ideal for pets, play, or entertaining, plus a convenient storage shed for all your outdoor needs. Don’t miss this fantastic opportunity!
Key facts
- Recent updates
- New siding
- New gutters
Tags
Neighborhood map
What this means for you Summary
Snapshot
- This is a 3-bed/2.0-bath single-family listed at $240k.
Deal economics
- At list price, monthly cash flow is $-97 ($-1k/yr) — negative.
- To cash-flow at today's rent, offer at most $223k (7.1% below list).
- To meet the 1% rule (rent ≥ 1% of price), the offer needs to be $209k (13.1% below list).
- Recommended offer: $209k (13.1% below list) — sets the bar for 1% rule.
- Cap rate 5.8% vs local median 4.8% in Fort Wayne — meaningfully above typical; check what's discounted (condition, days-on-market, listing class) to confirm the premium yield is real.
Location & tenants
- Location reads 84/100 on livability (#6 in IN, #676 nationally) — a professional / high-income tenant draw. Strengths: amenities A+, commute A+, cost of living A+; Watch: crime C-, schools D+, employment D+.
- Fort Wayne Community Schools (urban): math 22% / reading 29% proficiency, ranked #263 of 301 in IN (top 87%) — low school quality limits family demand, transient renter base, plan for 1-2y turnover; 60% free/reduced lunch — lower-income household profile, screen leases tightly.
- Market conditions: Rents rising fast (+7.6%/yr); 327 active listings in the ZIP; 5 comparable units currently listed for rent nearby; rentals at typical pace (median 14d on market — plan ~3-4 weeks tenant-placement turnaround); solid renter incomes; 1,861 units permitted in Allen County in 2024 (576 in 5+ unit buildings).
- This rent runs 31% of the median local income ($81k/yr) — at the standard rent-burdened threshold; future hikes will face affordability resistance.
Forward outlook
- Local home prices are declining (-3.0%/yr); year-one equity from $2k of loan paydown is wiped out by about $7k of value loss. Plan a longer hold.
- Allen County population projected at +10% by 2050 — modest demand growth; plan on rents tracking national, not racing it.
Negotiation context
- It's been on market 27 days — a 2% lower offer ($236k) is reasonable based on typical stale-listing flexibility.
Questions for the listing agent
- What do current leases actually rent for vs. the listed asking? Can we see a recent rent roll and the last 12 months of T-12 income?
- Is there a deadline driving the sale (1031 exchange, divorce, estate, relocation)? That informs how much negotiation room exists.
- Schools are D-rated, which usually means shorter tenancies and higher turnover. Who's the typical renter profile here, and what's been the actual vacancy rate?
- The area grade is low — what's the realistic commute time and amenity access for the typical tenant pool here? Any planned neighborhood developments (good or bad) we should know about?
- What's the average days-on-market for RENTAL listings here right now (not sales)? A rising rental-DOM trend means longer vacancies and softer asking-rent achievability than the comps imply.
- What's the recent tenant-quality profile in this submarket — average credit score on applications, eviction rate, late-payment / NSF rate, and stable-employment percentage? A property-management company in the area should have these aggregated.
- How much new for-sale + rental construction is in the pipeline within 1–3 miles? Heavy new supply typically softens prices + rents 12–24 months out; constrained supply supports both.
Investment metrics
- 1% rule
- 0.87% ✗
- Cap rate
- 5.81%
- Cash-on-cash
- -1.73%
- DSCR
- 0.92
- GRM
- 9.6
CMA / ARV
- ARV (median comp)
- $232,200
- List price
- $240,000
- Delta
- 3.36%
- Verdict
- FAIR
- Comps
- 20 within 1.0 mi
Show comp detail 12 sales within ~0.75 mi
| Address | Dist | Beds/Ba | Sqft | Sold | Price | $/sf | Match |
|---|---|---|---|---|---|---|---|
| 1226 Foxmoor Run | 0.44mi | 3/2.0 | 1,459 (+0%) | 1mo | $264,900 | $182 | 78 |
| 2202 Lima Valley Dr | 0.21mi | 3/2.0 | 1,372 (-6%) | 6mo | $239,900 | $175 | 76 |
| 2221 Klug Dr | 0.33mi | 3/2.0 | 1,408 (-3%) | 7mo | $195,000 | $138 | 73 |
| 2119 Klug Dr | 0.29mi | 3/2.0 | 1,528 (+5%) | 6mo | $221,900 | $145 | 73 |
| 1234 Foxmoor Run | 0.40mi | 3/2.0 | 1,419 (-2%) | 6mo | $254,900 | $180 | 72 |
| 2230 Foxboro Drive Dr | 0.27mi | 3/2.0 | 1,586 (+9%) | 4mo | $248,000 | $156 | 69 |
| 2013 Foxboro Dr | 0.11mi | 3/2.5 | 1,667 (+15%) | 2mo | $247,500 | $148 | 67 |
| 2112 W Wallen Rd | 0.47mi | 3/1.0 | 1,540 (+6%) | 2mo | $148,900 | $97 | 62 |
| 2224 Wayside Dr | 0.40mi | 3/1.5 | 1,296 (-11%) | 2mo | $230,000 | $177 | 60 |
| 1428 Ashley Ave | 0.40mi | 3/1.0 | 1,309 (-10%) | 6mo | $168,164 | $128 | 56 |
| 1205 Mayfield Rd | 0.49mi | 3/1.0 | 1,302 (-10%) | 1mo | $204,900 | $157 | 55 |
| 1132 Fox Orchard Run | 0.60mi | 3/2.0 | 1,329 (-9%) | 6mo | $250,000 | $188 | 52 |
Match score weights: distance 35% · size 25% · config 20% · recency 20%. Top-matched comps best support the ARV.
Projected returns pro-forma
-3.0% appreciation · 7.64% rent growth · sell at horizon
- IRR
- -13.8%
- Equity multiple
- 0.48×
- Total profit
- $-34,792
- Equity at exit
- $35,785
- IRR
- 1.4%
- Equity multiple
- 1.12×
- Total profit
- $8,130
- Equity at exit
- $20,751
Cash invested: $67,200 (down + closing). Projections, not guarantees.
Landlord ↔ Tenant lean methodology
- Overall (STATE)
- 90 Strongly Landlord-Friendly
- State Indiana
- 90 Strongly Landlord-Friendly · R+11
- County
- — inherits STATE
- City
- — inherits STATE
ZIP-level market 46818
- Rents YoY
- 7.6%
- Active inventory
- 327
- Price-to-rent
- 9.6×
Monthly cashflow live
- Estimated rent
- $2,086 high interval (Pro) →
- Mortgage (P&I)
- −$1,259
- Tax from tax record
- −$386 /mo · $4,634/yr
- Insurance
- −$100
- HOA
- −$0
- Vacancy / Maint / Mgmt
- −$438
- Net cashflow
- $-97
Break-even live
UW: 25.0% down · 7.5% · 30yr · 1.5% tax · 5.0% vac · 8.0% maint · 8.0% mgmt
Financing live
Cash to close
- Down payment
- $60,000
- Closing costs
- $7,200
- Reserves months
- —
- Total cash needed
- —
Loan-product check · same deal, 3 products live
Conventional
25% down · 7.5% · 30yr
- Down + closing
- —
- Monthly P&I
- —
- Monthly cashflow
- —
- DSCR
- —
- Eligible?
- —
Personal DTI + credit; lowest rate.
DSCR
20% down · 8.5% · 30yr
- Down + closing
- —
- Monthly P&I
- —
- Monthly cashflow
- —
- DSCR
- —
- Eligible?
- —
No personal income docs; deal must DSCR.
Hard money
10% down · 12.0% · 12mo
- Down + closing
- —
- Monthly P&I
- —
- Monthly cashflow
- —
- DSCR
- —
- Eligible?
- —
Short-term bridge; refi at stabilization.
Rent comps 5 comps
| Address | Beds | Baths | Sqft | Rent | $/sqft | DOM | Units | Dist |
|---|---|---|---|---|---|---|---|---|
| 2316 Lima Ln Fort Wayne, IN | 3.0 | 1.5 | 1160 | $2,150 | $1.85 | 14d | 1 | 0.38mi |
| 823 Woodland Springs Pl Fort Wayne, IN | 3.0 | 2.0 | 1371 | $1,875 | $1.37 | 44d | 1 | 0.83mi |
| 3782 Thunderhawk Pass Fort Wayne, IN | 3.0 | 2.0 | 1464 | $2,095 | $1.43 | 14d | 5 | 1.23mi |
| 2320 W Washington Center Rd Fort Wayne, IN | 3.0 | 2.0 | 1088 | $1,324 | $1.22 | 14d | 1 | 1.35mi |
| 10230 Avalon Way Fort Wayne, IN | 1.0–3.0 | 1.0–2.0 | 956 | $1,625 | $1.70 | 14d | 23 | 1.43mi |
Listing history 2 events
-
2026-05-16status Pending 774-char remark
Show marketing remark (774 chars)
Welcome Home! this 3-bedroom, 2 full bath Home located in a desirable Northwest Fort Wayne neighborhood! Close to I69 , shopping , Banking and trails . This home features numerous recent updates, including new windows, roof, siding, gutters, soffits, and fresh paint giving you peace of mind and modern curb appeal. Inside, you'll find a comfortable layout perfect for everyday Living! you will appreciate the living room , family room and one bedroom on the main level and two on the upper level perfect for spreading out. All appliances stay, making this home truly move-in ready. Step outside to enjoy a fully fenced backyard, ideal for pets, play, or entertaining, plus a convenient storage shed for all your outdoor needs. Don’t miss this fantastic opportunity!
-
2026-04-19$240,000 Active 774-char remark
Show marketing remark (774 chars)
Welcome Home! this 3-bedroom, 2 full bath Home located in a desirable Northwest Fort Wayne neighborhood! Close to I69 , shopping , Banking and trails . This home features numerous recent updates, including new windows, roof, siding, gutters, soffits, and fresh paint giving you peace of mind and modern curb appeal. Inside, you'll find a comfortable layout perfect for everyday Living! you will appreciate the living room , family room and one bedroom on the main level and two on the upper level perfect for spreading out. All appliances stay, making this home truly move-in ready. Step outside to enjoy a fully fenced backyard, ideal for pets, play, or entertaining, plus a convenient storage shed for all your outdoor needs. Don’t miss this fantastic opportunity!
ⓘ Source: listings_history table (triggers on properties + properties_extension) + one-shot
backfill from property_details.listing_events for pre-trigger history.
Tax reassessment forecast IN · Partial reset (capped growth)
- Current annual tax
- $4,634 · $386/mo
- Projected year-2 tax
- $4,634 · $386/mo
- Expected delta
- $0/yr ($0/mo · 0.0%)
ⓘ Screening estimate from a state-policy table — verify with the county assessor before closing.
Climate risk First Street
- Flood 1/10 Low FEMA zone X (unshaded) · 0% chance over 30 yrs
- Wildfire 1/10 Low
- Heat 3/10 Moderate 7 d/yr ≥101°F today · 17 d/yr by 30 yrs out
- Wind 2/10 Low
- Air quality 2/10 Low 2 unhealthy d/yr today · 2 by 30 yrs out
Nearby sold comps map
Loading sold comps map…
Walkable amenities ~0.75 mi
Loading nearby amenities…
Taxation est. · year 1
- Rental income
- $25,029
- − Mortgage interest
- −$13,444
- − Property taxes
- −$4,634
- − Insurance
- −$1,200
- − Repairs & maintenance
- −$2,002
- − Management
- −$2,002
- − Depreciation
- −$6,982
- Taxable loss
- −$5,235
- Est. tax savings @ 24.0%
- +$1,256
- After-tax cash flow
- $92/yr
For passive investors: Depreciation is non-cash, so a rental often shows a tax loss while cash-flowing — sheltering income. Rental losses are passive: they offset passive income freely, and up to $25,000/yr can offset ordinary (W-2) income if you actively participate and your MAGI is under $100k (phasing out to $0 by $150k); unused losses carry forward. On sale, claimed depreciation is recaptured at up to 25%, and gains may owe capital-gains tax (a 1031 exchange can defer both). Figures are a year-1 estimate at your 24.0% rate — not tax advice; consult a CPA.
Schools (NCES district)
- District
- Fort Wayne Community Schools
- NCES district ID
- 1803630
- Math proficiency
- 22% ▼ -11.00%
- Reading proficiency
- 29% ▼ -7.00%
- Median HH income
- $41,951
- Composite
- 21.68/100
- National rank
- #8275
- State rank
- #263 of 301 in IN
Livability — Fort Wayne
- Score
- 84/100
- State rank
- #6
- US rank
- #676
Category grades
Schools grade is shown separately in the Schools card above.
Census & demographics
- Census place
- Fort Wayne, IN
- County
- Allen County · 326,813 people
- Metro
- Fort Wayne, IN
- Population (ZIP)
- 21,954
- Household income
- $81,066
- Rent vs Own
- Severe rent burden
- 101.0
Population outlook (Allen County) Hauer SSP2
- Today (2025)
- 394,020 people
- By 2030
- 405,128 · +2.8%
- By 2040
- 423,476 · +7.5%
- By 2050
- 435,137 · +10.4%
- By 2075
- 450,293 · +14.3%
- By 2100
- 424,101 · +7.6%
Race, ethnicity, and origin ACS 2023
- Neighborhood character
- Predominantly White (79%)
- Race & ethnicity
- White 79% Two or more races 8% Hispanic / Latino 7% Black 4% Asian 3%
- Hispanic origin (detail)
- Mexican 6%
- Common ancestry
- Italian 4% Slovak 3% Romanian 2%
- Foreign-born
- 8% · Canada, Vietnam, Philippines
- Languages at home
- 90% English-only · Spanish 4% Other Asian/Pacific 1% Vietnamese 1%
Political lean MEDSL · Allen
- 2024 margin
- R (+12.5) · D 42.9% · R 55.4% · Other 1.7%
- 2008→2024 swing
- -8.1pp toward R · 2008: -4.3pp · 2024: -12.5pp
- All cycles
- 2024: R+12.5 2020: R+11.2 2016: R+19.6 2012: R+16.8 2008: R+4.3
Not yet ingested
- Civics
- —
Market trends
- HPI YoY
- ▼ -217.71%
- Current HPI
- 228.1539
- Rent YoY
- ▲ 7.64%
- Metro
- Fort Wayne, IN
- State GDP YoY
- ▲ 2.90%
- F500 in state
- 18
Industry mix (Fortune 500 HQ in IN)
| Industry | F500 HQs | Revenue |
|---|---|---|
| Industrial Machinery | 2 | $37B |
|
||
| Healthcare | 1 | $177B |
|
||
| Pharmaceuticals | 1 | $45B |
|
||
| Metals / Steel | 1 | $18B |
|
||
| Agriculture | 1 | $17B |
|
||
| Packaging | 1 | $12B |
|
||
Price history
2 events — show timeline
- 2026-05-16 Pending — IRMLS
- 2026-04-19 Listed $240,000 IRMLS
Property tax history
+14.6%/yrLatest (2024): $4,634 · +16.2% YoY. Source: county tax records.
Cash-flow waterfall
monthlySold comps — $/sqft
last 12 mo · ≤1 miLoading sold comps…