 Multi-family
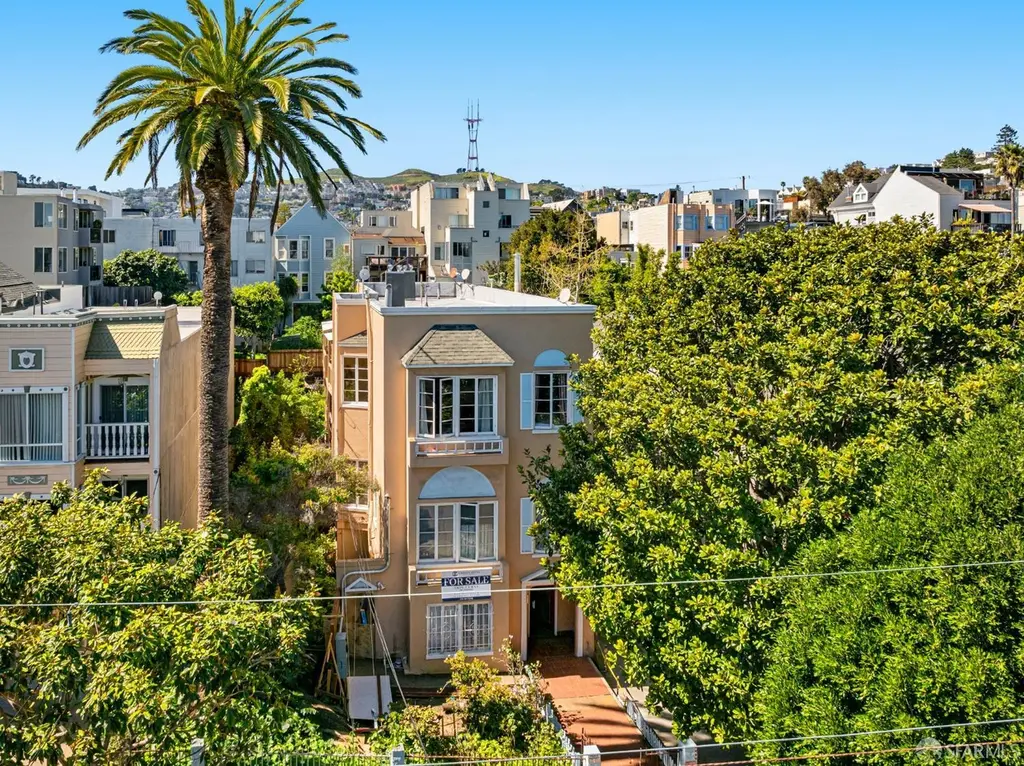
252 Chattanooga St · San Francisco, CA
Flood risk 1/10 · Minimal
- FEMA flood zone
- X (unshaded)
- Chance of flooding over 30 yrs
- 0.0%
- Est. flood insurance / yr
- $507 – $1,088
Fire risk 1/10 · Minimal
- Est. fire insurance / yr
- $659 – $1,223
Heat risk 2/10 · Minimal
- Hot days now (above 78°F)
- 8 days/yr
- Hot days in 30 yrs
- 18 days/yr
Wind risk 1/10 · Minimal
- Chance of severe wind over 30 yrs
- —
Air-quality risk 8/10 · Major
- Unhealthy air days now
- 15 days/yr
- Unhealthy air days in 30 yrs
- 15 days/yr
Risk factors via First Street. Map © Google.
Why this score? — see what drove the A- grade
The composite is a weighted blend of 9 inputs, each scored 0–100. Each bar is that input's sub-score; the figure is the points it added to the 100-point composite (weight × sub-score).
- Cash flow +27.9/30.0
- ARV discount +10.5/15.0
- DSCR +9.9/10.0
- Appreciation +9.8/10.0
- 1% rule +7.6/10.0
- Rent growth +5.0/5.0
- Schools +5.0/10.0
- Livability +3.8/5.0
- Condition / age +2.5/5.0
$2,250,000
🖨 Deal sheet (PDF) 📄 Offer letter ✓ Due diligence
Multi-family units
County records classify this as Multi-Family (5+ Unit). Listing-text estimate: 1 unit. estimate disagrees with records
5+ unit building — per-unit beds/baths from public records are typically unavailable; the breakdown below (if shown) is an estimate from the listing text.
Listing remarks
Urban Capital is pleased to present 252 Chattanooga Street, a well-maintained six-unit apartment building located in the heart of San Francisco's Noe Valley. Built in 1900, the property spans approximately 4,623 square feet on an extra-wide 7,945 square foot lot. The unit mix consists of four spacious one-bedroom, one-bath units averaging approximately 600 square feet and two two-bedroom, one-bath units of approximately 800 square feet. The property features one-to-one parking with six dedicated spaces, including a detached garage and additional carport or surface parking in the rear. There are also eight private storage lockers and coin-operated laundry in the basement. There is currently
Key facts
- Extra wide lot
- 7,945 sq ft lot
- 6 garage spots
Tags
Neighborhood map
What this means for you Summary
Snapshot
- This is a 8-bed/6.0-bath multifamily listed at $2.25M.
Deal economics
- At list price, monthly cash flow is $7k ($83k/yr) — positive.
- The deal already cash-flows at list — no discount required.
- Meets the 1% rule at list price ($28k rent vs $2.25M).
- Recommended offer: $2.22M (1.5% below list) — sets the bar for market timing.
- Cap rate 10.0% vs local median 2.1% in San Francisco — top-decile yield for the area; either an underpriced asset or a hidden risk that comps aren't pricing in. Stress-test before assuming the spread holds.
Location & tenants
- Location reads 76/100 on livability (#90 in CA, #3,143 nationally) — a middle-class / working-renter tenant base. Strengths: amenities A+, commute A+, employment A+; Watch: crime F, cost of living F.
- San Francisco Unified (urban): math 50% / reading 56% proficiency, ranked #322 of 1,400 in CA (top 23%) — acceptable for families but not a draw, mixed tenant base, ~2y average lease.
- Zoned schools: Lilienthal (Claire) Elementary (669 students, 19% FRL); Giannini (A.P.) Middle (1,192 students, 34% FRL); Lowell High (2,632 students, 37% FRL) — zoned schools average 30% FRL vs 49% district-wide (19 pts lower); this property's tenant base skews higher-income than the district average.
- Market conditions: Rents rising fast (+14.4%/yr); 121 active listings in the ZIP; high-income renter base; 750 units permitted in San Francisco County in 2024 (688 in 5+ unit buildings).
- At $28,428/mo this rent would consume 167% of the median local household income ($204k/yr) (locally 1336% of renters already pay >50% of income on rent) — very limited rent-growth headroom before tenants either downsize or default.
Forward outlook
- In year one you build about $229k of equity ($16k loan paydown + $214k appreciation (9.5% local appreciation)).
- San Francisco County population projected at +39% by 2050 — long-run rental-demand tailwind backs the buy-and-hold thesis.
- At projected returns (9.5% appreciation + 8.0% rent growth), your $630k cash investment doubles in ~2 years — after that, you're playing with house money.
- By year 2, paydown + projected appreciation supports a ~$368k cash-out refi (75% LTV) — recoverable capital for the next deal without selling this one.
Negotiation context
- It's been on market 16 days — a 2% lower offer ($2.22M) is reasonable based on typical stale-listing flexibility.
Risks & watch-outs
- Watch-outs: built in 1900 — expect roof / HVAC / electrical / plumbing capex.
Questions for the listing agent
- Built in 1900 — when were the roof, HVAC, electrical panel, plumbing, and water heater last replaced?
- Is there a deadline driving the sale (1031 exchange, divorce, estate, relocation)? That informs how much negotiation room exists.
- Schools are B-rated — typically a magnet for longer-tenancy family renters. What's the average tenant stay here, and is there a school-zone premium baked into asking?
- Crime grade is F in this area — have there been break-ins, vandalism, or insurance claims at this property in the last 3 years? What carrier currently insures it and at what premium?
- What's the average days-on-market for RENTAL listings here right now (not sales)? A rising rental-DOM trend means longer vacancies and softer asking-rent achievability than the comps imply.
- What's the recent tenant-quality profile in this submarket — average credit score on applications, eviction rate, late-payment / NSF rate, and stable-employment percentage? A property-management company in the area should have these aggregated.
- How much new apartment / multifamily construction is in the pipeline within 1–3 miles? Heavy new supply (>2% of stock underway) typically softens rents 12–24 months out; light construction supports rent growth.
Investment metrics
- 1% rule
- 1.26% ✓
- Cap rate
- 9.98%
- Cash-on-cash
- 13.16%
- DSCR
- 1.59
- GRM
- 6.6
CMA / ARV
- ARV (on-the-fly)
- $2,408,640
- Comps found
- 12
Show comp detail 12 sales within ~0.75 mi
| Address | Dist | Beds/Ba | Sqft | Sold | Price | $/sf | Match |
|---|---|---|---|---|---|---|---|
| 252 Chattanooga St | 0.00mi | 8/— | 4,632 (0%) | 1mo | $2,410,000 | $520 | 99 |
| 1123-1127 Guerrero St | 0.23mi | 7/6.0 (-1) | 4,728 (+2%) | 14mo | $2,200,000 | $465 | 70 |
| 132 Duncan St | 0.45mi | 8/— | 4,070 (-12%) | 3mo | $1,963,000 | $482 | 57 |
| 3283 25th St | 0.60mi | 7/5.0 (-1) | 4,273 (-8%) | 0mo | $2,400,000 | $562 | 50 |
| 685 Noe St | 0.49mi | 8/5.0 | 4,385 (-5%) | 18mo | $3,880,000 | $885 | 49 |
| 3932-3934 26th St | 0.27mi | 7/— (-1) | 4,155 (-10%) | 20mo | $4,999,000 | $1,203 | 49 |
| 3579 19th St | 0.54mi | 8/4.0 | 5,216 (+13%) | 2mo | $2,605,000 | $499 | 44 |
| 729 Douglass St | 0.63mi | 7/7.0 (-1) | 5,122 (+11%) | 3mo | $5,500,000 | $1,074 | 41 |
| 3144-3148 22nd St | 0.55mi | 9/3.0 (+1) | 5,052 (+9%) | 2mo | $1,810,000 | $358 | 41 |
| 595-597 Diamond St | 0.52mi | 7/4.0 (-1) | 4,387 (-5%) | 22mo | $4,500,000 | $1,026 | 36 |
| 407 29th St | 0.64mi | 8/8.0 | 5,244 (+13%) | 16mo | $2,300,000 | $439 | 26 |
| 445 Diamond St | 0.57mi | 9/2.0 (+1) | 5,018 (+8%) | 20mo | $2,420,000 | $482 | 23 |
Match score weights: distance 35% · size 25% · config 20% · recency 20%. Top-matched comps best support the ARV.
Projected returns pro-forma
9.51% appreciation · 8.0% rent growth · sell at horizon
- IRR
- 35.5%
- Equity multiple
- 3.76×
- Total profit
- $1,740,546
- Equity at exit
- $1,946,597
- IRR
- 32.7%
- Equity multiple
- 9.15×
- Total profit
- $5,134,455
- Equity at exit
- $4,115,218
Cash invested: $630,000 (down + closing). Projections, not guarantees.
Landlord ↔ Tenant lean methodology
- Overall (CITY)
- 0 Strongly Tenant-Friendly
- State California
- 18 Strongly Tenant-Friendly · D+13
- County
- — inherits STATE
- City San Francisco
- 0 Strongly Tenant-Friendly · D+57
ZIP-level market 94114
- Home prices YoY
- 4.4%
- Rents YoY
- 14.4%
- Active inventory
- 121
- Price-to-rent
- 40.4×
Monthly cashflow live
- Estimated rent
- $28,428 high interval (Pro) →
- Mortgage (P&I)
- −$11,799
- Tax est. 1.5%
- −$2,812 /mo · $33,750/yr
- Insurance
- −$938
- HOA
- −$0
- Vacancy / Maint / Mgmt
- −$5,970
- Net cashflow
- $6,909
Break-even live
Sensitivity live
| Price | -10% $8,464 | -5% $7,686 | +0% $6,909 | +5% $6,131 | +10% $5,354 |
|---|---|---|---|---|---|
| Rent | -10% $4,663 | -5% $5,786 | +0% $6,909 | +5% $8,032 | +10% $9,155 |
| Rate | -1.0pp $8,042 | -0.5pp $7,481 | base $6,909 | +0.5pp $6,326 | +1.0pp $5,733 |
6-unit breakdown (identical units grouped — click to expand)
| Units | Beds | Baths | Est. rent |
|---|---|---|---|
| 4× units | 1 | 1 | $18,568 |
| #1 | 1 | 1 | $4,642 |
| #2 | 1 | 1 | $4,642 |
| #3 | 1 | 1 | $4,642 |
| #4 | 1 | 1 | $4,642 |
| 2× units | 2 | 1 | $9,862 |
| #5 | 2 | 1 | $4,931 |
| #6 | 2 | 1 | $4,931 |
| Total (6 units) | $28,428 | ||
UW: 25.0% down · 7.5% · 30yr · 1.5% tax · 5.0% vac · 8.0% maint · 8.0% mgmt
Financing live
Cash to close
- Down payment
- $562,500
- Closing costs
- $67,500
- Reserves months
- —
- Total cash needed
- —
Loan-product check · same deal, 3 products live
Conventional
25% down · 7.5% · 30yr
- Down + closing
- —
- Monthly P&I
- —
- Monthly cashflow
- —
- DSCR
- —
- Eligible?
- —
Personal DTI + credit; lowest rate.
DSCR
20% down · 8.5% · 30yr
- Down + closing
- —
- Monthly P&I
- —
- Monthly cashflow
- —
- DSCR
- —
- Eligible?
- —
No personal income docs; deal must DSCR.
Hard money
10% down · 12.0% · 12mo
- Down + closing
- —
- Monthly P&I
- —
- Monthly cashflow
- —
- DSCR
- —
- Eligible?
- —
Short-term bridge; refi at stabilization.
Listing history 2 events
-
2026-04-06status Pending
-
2026-03-20$2,250,000 Active
ⓘ Source: listings_history table (triggers on properties + properties_extension) + one-shot
backfill from property_details.listing_events for pre-trigger history.
Climate risk First Street
- Flood 1/10 Low FEMA zone X (unshaded) · 0% chance over 30 yrs
- Wildfire 1/10 Low
- Heat 2/10 Low 8 d/yr ≥78°F today · 18 d/yr by 30 yrs out
- Wind 1/10 Low
- Air quality 8/10 Severe 15 unhealthy d/yr today · 15 by 30 yrs out
Nearby sold comps map
Loading sold comps map…
Walkable amenities ~0.75 mi
Loading nearby amenities…
Taxation est. · year 1
- Rental income
- $341,136
- − Mortgage interest
- −$126,035
- − Property taxes
- −$33,750
- − Insurance
- −$11,250
- − Repairs & maintenance
- −$27,291
- − Management
- −$27,291
- − Depreciation
- −$65,455
- Taxable income
- $50,065
- Est. tax owed @ 24.0%
- −$12,016
- After-tax cash flow
- $70,891/yr
For passive investors: Depreciation is non-cash, so a rental often shows a tax loss while cash-flowing — sheltering income. Rental losses are passive: they offset passive income freely, and up to $25,000/yr can offset ordinary (W-2) income if you actively participate and your MAGI is under $100k (phasing out to $0 by $150k); unused losses carry forward. On sale, claimed depreciation is recaptured at up to 25%, and gains may owe capital-gains tax (a 1031 exchange can defer both). Figures are a year-1 estimate at your 24.0% rate — not tax advice; consult a CPA.
Schools (NCES district)
- District
- San Francisco Unified
- NCES district ID
- 0634410
- Math proficiency
- 50% ▬ 0.00%
- Reading proficiency
- 56% ▲ 1.00%
- Median HH income
- $81,249
- Composite
- 50.14/100
- National rank
- #4088
- State rank
- #322 of 1400 in CA
Livability — San Francisco
- Score
- 76/100
- State rank
- #90
- US rank
- #3143
Category grades
Schools grade is shown separately in the Schools card above.
Census & demographics
- Census place
- San Francisco, CA
- County
- San Francisco County · 827,552 people
- City population
- 827,552
- Metro
- San Francisco-Oakland-Berkeley, CA
- Population (ZIP)
- 33,020
- Household income
- $204,134
- Rent vs Own
- Severe rent burden
- 1336.0
Population outlook (San Francisco County) Hauer SSP2
- Today (2025)
- 1,030,936 people
- By 2030
- 1,110,409 · +7.7%
- By 2040
- 1,270,010 · +23.2%
- By 2050
- 1,435,001 · +39.2%
- By 2075
- 1,779,074 · +72.6%
- By 2100
- 1,966,767 · +90.8%
Race, ethnicity, and origin ACS 2023
- Neighborhood character
- Predominantly White (65%)
- Race & ethnicity
- White 65% Asian 14% Two or more races 12% Hispanic / Latino 10% Black 2%
- Hispanic origin (detail)
- Mexican 5%
- Common ancestry
- Lithuanian 4% Italian 4% Romanian 3%
- Foreign-born
- 20% · Canada, China, Vietnam
- Languages at home
- 77% English-only · Spanish 6% Chinese 4% Other Indo-European 4%
Political lean MEDSL · San Francisco
- 2024 margin
- Solid D (+64.8) · D 80.3% · R 15.5% · Other 4.1%
- 2008→2024 swing
- -5.7pp toward R · 2008: 70.5pp · 2024: 64.8pp
- All cycles
- 2024: D+64.8 2020: D+72.5 2016: D+76.1 2012: D+70.2 2008: D+70.5
Not yet ingested
- Civics
- —
Market trends
- HPI YoY
- ▲ 9.51%
- Current HPI
- 223.6988
- Rent YoY
- ▲ 14.40%
- Metro
- San Francisco-Oakland-Berkeley, CA
- State GDP YoY
- ▲ 3.21%
- F500 in state
- 116
Industry mix (Fortune 500 HQ in CA)
| Industry | F500 HQs | Revenue |
|---|---|---|
| Technology | 27 | $1,492B |
|
||
| Financial Services | 3 | $174B |
|
||
| Retail | 3 | $44B |
|
||
| Insurance | 3 | $26B |
|
||
| Media / Entertainment | 2 | $115B |
|
||
| Pharmaceuticals / Biotech | 2 | $62B |
|
||
Price history
2 events — show timeline
- 2026-04-06 Pending — San Francisco MLS
- 2026-03-20 Listed $2,250,000 San Francisco MLS
Property tax history
+2.7%/yrLatest (2025): $3,414 · +3.2% YoY. Source: county tax records.
Cash-flow waterfall
monthlySold comps — $/sqft
last 12 mo · ≤1 miLoading sold comps…