1737 Bever Ave SE · Cedar Rapids, IA
Flood risk 1/10 · Minimal
- FEMA flood zone
- X (unshaded)
- Chance of flooding over 30 yrs
- 0.0%
- Est. flood insurance / yr
- $473 – $860
Fire risk 3/10 · Minor
- Est. fire insurance / yr
- $902 – $1,676
Heat risk 3/10 · Minor
- Hot days now (above 104°F)
- 7 days/yr
- Hot days in 30 yrs
- 15 days/yr
Wind risk 2/10 · Minimal
- Chance of severe wind over 30 yrs
- —
Air-quality risk 2/10 · Minimal
- Unhealthy air days now
- 1 days/yr
- Unhealthy air days in 30 yrs
- 2 days/yr
Risk factors via First Street. Map © Google.
Why this score? — see what drove the C- grade
The composite is a weighted blend of 9 inputs, each scored 0–100. Each bar is that input's sub-score; the figure is the points it added to the 100-point composite (weight × sub-score).
- Cash flow +18.9/30.0
- DSCR +6.0/10.0
- ARV discount +5.0/15.0
- Rent growth +5.0/5.0
- Schools +4.7/10.0
- 1% rule +4.4/10.0
- Livability +3.9/5.0
- Condition / age +2.5/5.0
- Appreciation +0.0/10.0
$134,900
🖨 Deal sheet 📄 Offer letter ✓ Due diligence
Listing remarks MLS
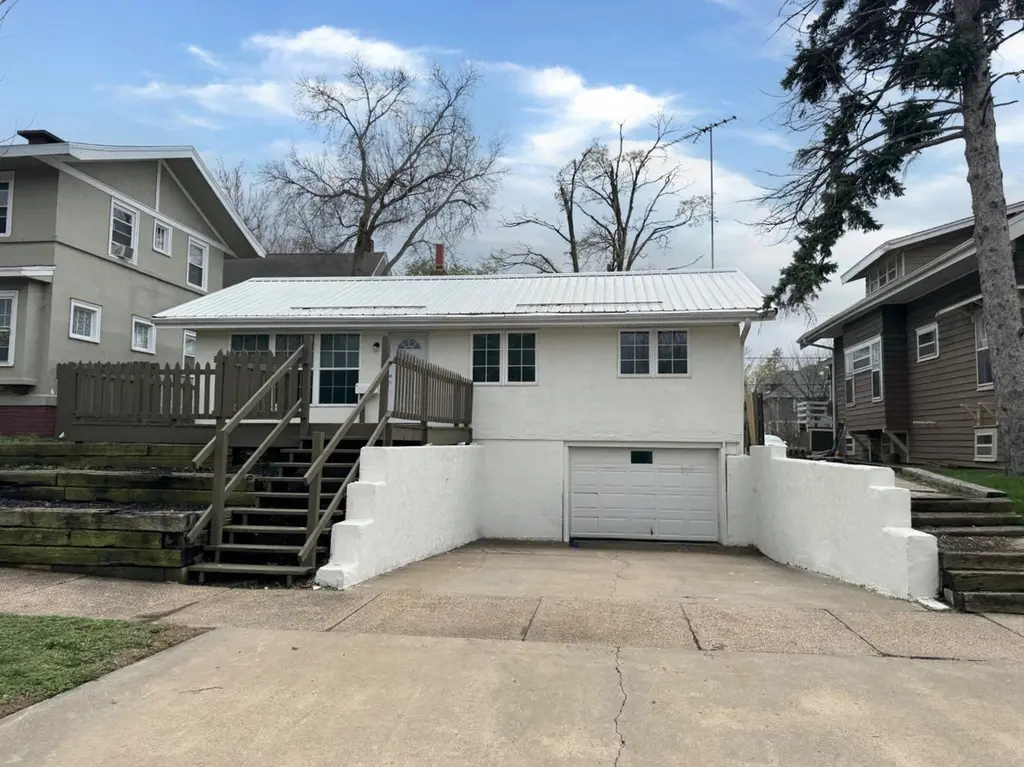
912 SQ FT ranch with a tuck-under 1-car garage. This property was built in 1950 and has 2 bedrooms, 1 bath and a full unfinished basement. There is a wood deck on the front of the house. Buyer's agent submits offers online. Investors have 30 day wait to submit any offer. All information believed accurate but not guaranteed.
Key facts
- Wood deck
- Unfinished basement
- 3,964 sq ft lot
Tags
Property features AI
Exterior
- Parking: Attached garage (1 car)
- Utilities: Public water; Public sewer
- Home design: Single-family residence (Residential); Approximately 912 above-grade finished square footage
- Construction: Frame construction
- Exterior features: Deck; Fenced yard; Lot about 0.091 acres
Interior
- Kitchen: Range
- Bedrooms: 5 total rooms (bedroom count not specified)
- Bathrooms: 1 full bathroom
- Interior features: Range (kitchen appliance); Basement
Neighborhood map
What this means for you Summary
Snapshot
- This is a 2-bed/1.0-bath single-family listed at $135k.
Deal economics
- At list price, monthly cash flow is $139 ($2k/yr) — positive.
- The deal already cash-flows at list — no discount required.
- To meet the 1% rule (rent ≥ 1% of price), the offer needs to be $127k (5.9% below list).
- Recommended offer: $127k (5.9% below list) — sets the bar for 1% rule.
- Cap rate 7.5% vs local median 3.5% in Cedar Rapids — top-decile yield for the area; either an underpriced asset or a hidden risk that comps aren't pricing in. Stress-test before assuming the spread holds.
Location & tenants
- Location reads 78/100 on livability (#134 in IA, #2,474 nationally) — a middle-class / working-renter tenant base. Strengths: cost of living A+, housing A+, health & safety A+; Watch: crime C-, commute F.
- Cedar Rapids Community School District (urban): math 50% / reading 59% proficiency, ranked #265 of 289 in IA (top 92%) — acceptable for families but not a draw, mixed tenant base, ~2y average lease.
- Zoned schools: Johnson Steam Academy School (math 32% / reading 37%, grade F, #595 of 616 statewide, top 97%, 346 students, 74% FRL); Mckinley Steam Academy (math 45% / reading 55%, grade C, #216 of 246 statewide, top 88%, 448 students, 52% FRL); George Washington High School (math 44% / reading 62%, grade C-, #296 of 336 statewide, top 88%, 1,291 students, 49% FRL) — zoned schools average 59% FRL vs 43% district-wide (15 pts higher); higher-poverty schools than district average — tighter screening recommended.
- Market conditions: Rents rising fast (+14.7%/yr); 236 active listings in the ZIP; 3 comparable units currently listed for rent nearby; rentals lingering (median 44d on market — plan ~5-8 weeks vacancy on turnover, expect pricing pressure); 67% of comp listings sitting > 30 days — soft ceiling on asking rent; 1,023 units permitted in Linn County in 2024 (456 in 5+ unit buildings).
Forward outlook
- Local home prices are declining (-3.0%/yr); year-one equity from $933 of loan paydown is wiped out by about $4k of value loss. Plan a longer hold.
- Linn County population projected at +16% by 2050 — long-run rental-demand tailwind backs the buy-and-hold thesis.
- At projected returns (-3.0% appreciation + 8.0% rent growth), your $38k cash investment doubles in ~10 years — after that, you're playing with house money.
Negotiation context
- Only 12 days on market — expect competitive offers; lowballing is unlikely to land.
- 3 sale attempts since 2y ago with the ask held roughly flat each time — persistent listings suggest the price (not the market) is what's stuck; bring a comps-based counter.
Risks & watch-outs
- Watch-outs: built in 1950 — expect roof / HVAC / electrical / plumbing capex.
Questions for the listing agent
- Built in 1950 — when were the roof, HVAC, electrical panel, plumbing, and water heater last replaced?
- Is there a deadline driving the sale (1031 exchange, divorce, estate, relocation)? That informs how much negotiation room exists.
- Schools are B-rated — typically a magnet for longer-tenancy family renters. What's the average tenant stay here, and is there a school-zone premium baked into asking?
- What's the average days-on-market for RENTAL listings here right now (not sales)? A rising rental-DOM trend means longer vacancies and softer asking-rent achievability than the comps imply.
- What's the recent tenant-quality profile in this submarket — average credit score on applications, eviction rate, late-payment / NSF rate, and stable-employment percentage? A property-management company in the area should have these aggregated.
- How much new for-sale + rental construction is in the pipeline within 1–3 miles? Heavy new supply typically softens prices + rents 12–24 months out; constrained supply supports both.
Investment metrics
- 1% rule
- 0.94% ✗
- Cap rate
- 7.53%
- Cash-on-cash
- 4.43%
- DSCR
- 1.20
- GRM
- 8.9
CMA / ARV
- ARV (on-the-fly)
- $127,680
- Comps found
- 12
Show comp detail 12 sales within ~0.75 mi
| Address | Dist | Beds/Ba | Sqft | Sold | Price | $/sf | Match |
|---|---|---|---|---|---|---|---|
| 1516 6th Ave SE | 0.30mi | 2/1.5 | 972 (+7%) | 0mo | $136,000 | $140 | 73 |
| 618 18th St St SE | 0.25mi | 2/1.0 | 972 (+7%) | 9mo | $59,000 | $61 | 70 |
| 813 18th St SE | 0.35mi | 2/1.0 | 816 (-10%) | 0mo | $148,550 | $182 | 66 |
| 1041 19th St St SE | 0.67mi | 2/1.0 | 912 (0%) | 7mo | $75,000 | $82 | 63 |
| 826 Wellington St SE | 0.40mi | 2/1.0 | 992 (+9%) | 8mo | $118,000 | $119 | 60 |
| 357 21st St St SE | 0.37mi | 2/1.0 | 837 (-8%) | 12mo | $143,000 | $171 | 59 |
| 912 10th St SE | 0.63mi | 3/1.0 (+1) | 915 (+0%) | 8mo | $142,500 | $156 | 58 |
| 520 15th St St SE | 0.31mi | 2/1.0 | 1,047 (+15%) | 5mo | $42,000 | $40 | 57 |
| 1516 8th Ave SE | 0.40mi | 2/1.0 | 1,047 (+15%) | 2mo | $137,500 | $131 | 55 |
| 1506 8th Ave SE | 0.41mi | 2/1.5 | 1,047 (+15%) | 0mo | $113,400 | $108 | 54 |
| 1801 Blake Blvd SE | 0.29mi | 3/1.0 (+1) | 780 (-14%) | 7mo | $119,900 | $154 | 52 |
| 1935 8th Ave Ave SE | 0.43mi | 3/1.0 (+1) | 1,008 (+10%) | 12mo | $166,500 | $165 | 47 |
Match score weights: distance 35% · size 25% · config 20% · recency 20%. Top-matched comps best support the ARV.
Projected returns pro-forma
-3.0% appreciation · 8.0% rent growth · sell at horizon
- IRR
- -4.3%
- Equity multiple
- 0.83×
- Total profit
- $-6,296
- Equity at exit
- $20,114
- IRR
- 10.2%
- Equity multiple
- 1.96×
- Total profit
- $36,379
- Equity at exit
- $11,664
Cash invested: $37,772 (down + closing). Projections, not guarantees.
Landlord ↔ Tenant lean methodology
- Overall (STATE)
- 83 Strongly Landlord-Friendly
- State Iowa
- 83 Strongly Landlord-Friendly · R+6
- County
- — inherits STATE
- City
- — inherits STATE
ZIP-level market 52403
- Rents YoY
- 14.7%
- Active inventory
- 236
- Price-to-rent
- 8.9×
Monthly cashflow live
- Estimated rent
- $1,269 medium interval (Pro) →
- Mortgage (P&I)
- −$707
- Tax from tax record
- −$99 /mo · $1,192/yr
- Insurance
- −$56
- HOA
- −$0
- Vacancy / Maint / Mgmt
- −$266
- Net cashflow
- $139
Break-even live
UW: 25.0% down · 7.5% · 30yr · 1.5% tax · 5.0% vac · 8.0% maint · 8.0% mgmt
Financing live
Cash to close
- Down payment
- $33,725
- Closing costs
- $4,047
- Reserves months
- —
- Total cash needed
- —
Loan-product check · same deal, 3 products live
Conventional
25% down · 7.5% · 30yr
- Down + closing
- —
- Monthly P&I
- —
- Monthly cashflow
- —
- DSCR
- —
- Eligible?
- —
Personal DTI + credit; lowest rate.
DSCR
20% down · 8.5% · 30yr
- Down + closing
- —
- Monthly P&I
- —
- Monthly cashflow
- —
- DSCR
- —
- Eligible?
- —
No personal income docs; deal must DSCR.
Hard money
10% down · 12.0% · 12mo
- Down + closing
- —
- Monthly P&I
- —
- Monthly cashflow
- —
- DSCR
- —
- Eligible?
- —
Short-term bridge; refi at stabilization.
Rent comps 3 comps
| Address | Beds | Baths | Sqft | Rent | $/sqft | DOM | Units | Dist |
|---|---|---|---|---|---|---|---|---|
| 1017 19th St SE Cedar Rapids, IA | 3.0 | 1.0 | 946 | $1,100 | $1.16 | 44d | 1 | 0.60mi |
| 906 10th St SE Cedar Rapids, IA | 1.0–2.0 | 1.0–2.0 | 890 | $1,300 | $1.46 | 13d | 6 | 0.62mi |
| 511 23rd St NE Cedar Rapids, IA | 2.0 | 1.0 | 888 | $1,500 | $1.69 | 44d | 1 | 1.13mi |
Listing history 12 events
-
2026-06-19days on market $134,900 Active 12 DOM
-
2026-06-18days on market $134,900 Active 11 DOM
-
2026-06-17days on market $134,900 Active 10 DOM
-
2026-06-16days on market $134,900 Active 9 DOM
-
2026-06-15days on market $134,900 Active 8 DOM
-
2026-06-14days on market $134,900 Active 6 DOM
-
2026-06-13days on market $134,900 Active 5 DOM
-
2026-06-10days on market $134,900 Active 3 DOM
-
2026-06-09days on market $134,900 Active 2 DOM
-
2026-06-09remarks 376-char remark
-
2026-06-08remarks 325-char remark
-
2026-06-08$134,900 Active 1 DOM
ⓘ Source: listings_history table (triggers on properties + properties_extension) + one-shot
backfill from property_details.listing_events for pre-trigger history.
Tax reassessment forecast IA · Partial reset (capped growth)
- Current annual tax
- $1,192 · $99/mo
- Projected year-2 tax
- $1,655 · $138/mo
- Expected delta
- +$463/yr (+$39/mo · 38.8%)
ⓘ Screening estimate from a state-policy table — verify with the county assessor before closing.
Climate risk First Street
- Flood 1/10 Low FEMA zone X (unshaded) · 0% chance over 30 yrs
- Wildfire 3/10 Moderate
- Heat 3/10 Moderate 7 d/yr ≥104°F today · 15 d/yr by 30 yrs out
- Wind 2/10 Low
- Air quality 2/10 Low 1 unhealthy d/yr today · 2 by 30 yrs out
Nearby sold comps map
Loading sold comps map…
Walkable amenities ~0.75 mi
Loading nearby amenities…
Taxation est. · year 1
- Rental income
- $15,227
- − Mortgage interest
- −$7,556
- − Property taxes
- −$1,192
- − Insurance
- −$674
- − Repairs & maintenance
- −$1,218
- − Management
- −$1,218
- − Depreciation
- −$3,924
- Taxable loss
- −$557
- Est. tax savings @ 24.0%
- +$134
- After-tax cash flow
- $1,807/yr
For passive investors: Depreciation is non-cash, so a rental often shows a tax loss while cash-flowing — sheltering income. Rental losses are passive: they offset passive income freely, and up to $25,000/yr can offset ordinary (W-2) income if you actively participate and your MAGI is under $100k (phasing out to $0 by $150k); unused losses carry forward. On sale, claimed depreciation is recaptured at up to 25%, and gains may owe capital-gains tax (a 1031 exchange can defer both). Figures are a year-1 estimate at your 24.0% rate — not tax advice; consult a CPA.
Schools (NCES district)
- District
- Cedar Rapids Community School District
- NCES district ID
- 1906540
- Math proficiency
- 50% ▼ -12.00%
- Reading proficiency
- 59% ▼ -6.00%
- Median HH income
- $53,568
- Composite
- 46.82/100
- National rank
- #2378
- State rank
- #265 of 289 in IA
Livability — Cedar Rapids
- Score
- 78/100
- State rank
- #134
- US rank
- #2474
Category grades
Schools grade is shown separately in the Schools card above.
Census & demographics
- Census place
- Cedar Rapids, IA
- County
- Linn County · 179,860 people
- City population
- 137,154
- Metro
- Cedar Rapids, IA
- Population (ZIP)
- 22,551
- Household income
- $74,703
- Rent vs Own
- Severe rent burden
- 452.0
Population outlook (Linn County) Hauer SSP2
- Today (2025)
- 239,589 people
- By 2030
- 248,587 · +3.8%
- By 2040
- 264,817 · +10.5%
- By 2050
- 278,685 · +16.3%
- By 2075
- 311,754 · +30.1%
- By 2100
- 336,773 · +40.6%
Race, ethnicity, and origin ACS 2023
- Neighborhood character
- Predominantly White (85%)
- Race & ethnicity
- White 85% Black 7% Two or more races 5% Hispanic / Latino 3%
- Common ancestry
- Italian 3% Slovak 3% Portuguese 3%
- Foreign-born
- 3% · Canada
- Languages at home
- 95% English-only · Spanish 3% Other Indo-European 1%
Political lean MEDSL · Linn
- 2024 margin
- Lean D (+9.9) · D 54.2% · R 44.3% · Other 1.4%
- 2008→2024 swing
- -11.6pp toward R · 2008: 21.5pp · 2024: 9.9pp
- All cycles
- 2024: D+9.9 2020: D+13.7 2016: D+9.0 2012: D+17.6 2008: D+21.5
Not yet ingested
- Civics
- —
Market trends
- HPI YoY
- ▼ -170.15%
- Current HPI
- 196.1114
- Rent YoY
- ▲ 14.67%
- Metro
- Cedar Rapids, IA
- State GDP YoY
- ▲ 2.48%
- F500 in state
- 4
Industry mix (Fortune 500 HQ in IA)
| Industry | F500 HQs | Revenue |
|---|---|---|
| Financial Services | 1 | $16B |
|
||
| Retail / Convenience | 1 | $15B |
|
||
Price history
+12.4% since first listed12 events — show timeline
- 2026-06-05 Listed $134,900 NEIRBR as distributed by MLS GRID
- 2026-06-05 Listed $134,900 CRAAR, CDRMLS
- 2024-08-05 Contingent — ICAARMLS
- 2024-08-01 Price Changed $95,000 CRAAR, CDRMLS
- 2024-08-01 Price Changed $95,000 ICAARMLS
- 2024-07-10 Price Changed $100,000 CRAAR, CDRMLS
- 2024-07-10 Price Changed $100,000 ICAARMLS
- 2024-06-09 Price Changed $105,000 CRAAR, CDRMLS
- 2024-06-09 Price Changed $105,000 ICAARMLS
- 2024-05-13 Price Changed $110,000 CRAAR, CDRMLS
- 2024-05-12 Price Changed $110,000 ICAARMLS
- 2024-05-01 Listed $120,000 ICAARMLS
Property tax history
+0.0%/yrLatest (2025): $1,192 · -6.7% YoY. Source: county tax records.
Cash-flow waterfall
monthlySold comps — $/sqft
last 12 mo · ≤1 miLoading sold comps…