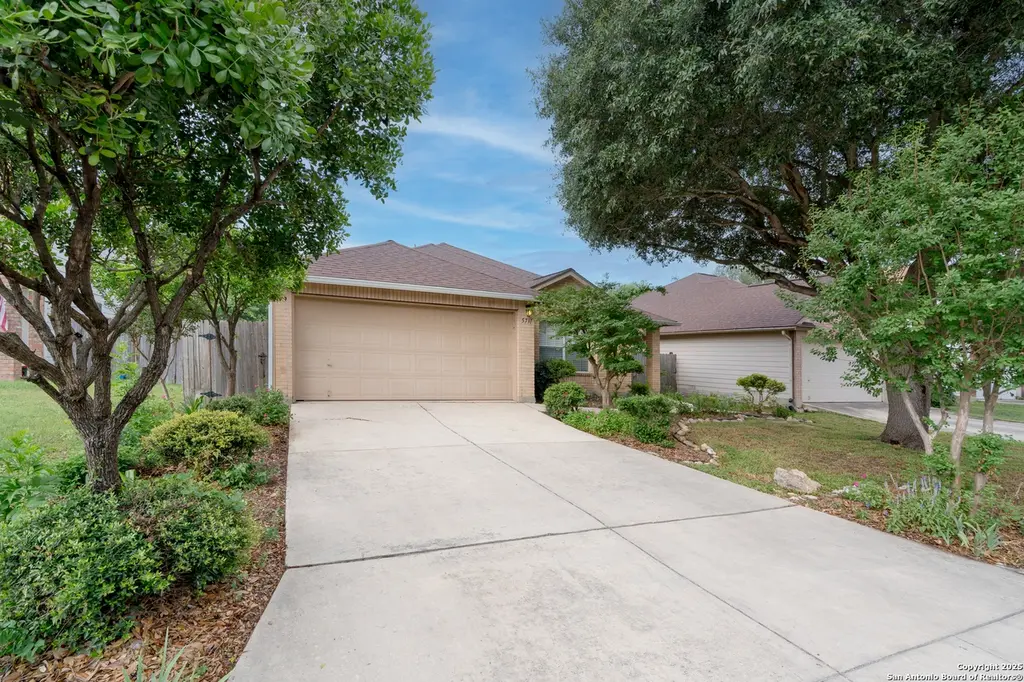
5731 Bypass · Converse, TX
Flood risk 1/10 · Minimal
- FEMA flood zone
- X (unshaded)
- Chance of flooding over 30 yrs
- 0.0%
- Est. flood insurance / yr
- $507 – $1,088
Fire risk 5/10 · Moderate
- Est. fire insurance / yr
- $1,222 – $2,270
Heat risk 8/10 · Major
- Hot days now (above 108°F)
- 7 days/yr
- Hot days in 30 yrs
- 21 days/yr
Wind risk 8/10 · Major
- Chance of severe wind over 30 yrs
- 80.0%
Air-quality risk 1/10 · Minimal
- Unhealthy air days now
- 0 days/yr
- Unhealthy air days in 30 yrs
- 0 days/yr
Risk factors via First Street. Map © Google.
Why this score? — see what drove the D grade
The composite is a weighted blend of 9 inputs, each scored 0–100. Each bar is that input's sub-score; the figure is the points it added to the 100-point composite (weight × sub-score).
- ARV discount +14.0/15.0
- Cash flow +9.7/30.0
- 1% rule +3.4/10.0
- Livability +3.3/5.0
- DSCR +2.8/10.0
- Rent growth +2.7/5.0
- Condition / age +2.5/5.0
- Schools +2.4/10.0
- Appreciation +0.0/10.0
$208,000
🖨 Deal sheet (PDF) 📄 Offer letter ✓ Due diligence
Listing remarks MLS
Come & Enjoy Private Greenbelt Access with this Move in Ready 3-bedroom, 2-bath Exceptionally Maintained Property. Turnkey One Story + All Brick home nestled in the sought-after Brentfield neighborhood of San Antonio. Tucked beneath the shade of mature trees, this property offers a serene retreat with a rare blend of privacy and character. Step inside to a warm, Functional Open Layout with Fresh Paint Throughout + NO CARPET ideal for anyone seeking comfort and space. Outside, enjoy a Private fully fenced ba
Key facts
- Private fully fenced
- 6,490 sq ft lot
- 2 garage spots
Tags
Neighborhood map
What this means for you Summary
Snapshot
- This is a 3-bed/2.0-bath single-family listed at $208k.
Deal economics
- At list price, monthly cash flow is $-135 ($-2k/yr) — negative.
- To cash-flow at today's rent, offer at most $184k (11.5% below list).
- To meet the 1% rule (rent ≥ 1% of price), the offer needs to be $174k (16.2% below list).
- Recommended offer: $174k (16.2% below list) — sets the bar for 1% rule.
- Cap rate 5.5% vs local median 4.3% in Converse — meaningfully above typical; check what's discounted (condition, days-on-market, listing class) to confirm the premium yield is real.
Location & tenants
- Location reads 66/100 on livability (#649 in TX) — a middle-class / working-renter tenant base. Strengths: cost of living A+, housing A+, employment B; Watch: crime C-, amenities F, commute F.
- Judson ISD (suburban): math 21% / reading 33% proficiency, ranked #660 of 826 in TX (top 80%) — low school quality limits family demand, transient renter base, plan for 1-2y turnover.
- Zoned schools: Woodlake El (math 17% / reading 22%, grade F, #3,583 of 4,322 statewide, top 86%, 655 students, 78% FRL); Henry Metzger Middle (math 12% / reading 20%, grade F, #1,543 of 1,662 statewide, top 94%, 953 students, 90% FRL); Karen Wagner H S (math 12% / reading 29%, grade F, #1,389 of 1,632 statewide, top 86%, 2,366 students, 80% FRL) — zoned schools average 83% FRL vs 57% district-wide (26 pts higher); higher-poverty schools than district average — tighter screening recommended.
- Market conditions: Rents flat; 193 active listings in the ZIP; 40 comparable units currently listed for rent nearby; rentals at typical pace (median 26d on market — plan ~3-4 weeks tenant-placement turnaround); 8,308 units permitted in Bexar County in 2024 (2,506 in 5+ unit buildings).
Forward outlook
- Local home prices are declining (-3.0%/yr); year-one equity from $1k of loan paydown is wiped out by about $6k of value loss. Plan a longer hold.
- Bexar County population projected at +50% by 2050 — long-run rental-demand tailwind backs the buy-and-hold thesis.
Negotiation context
- It's been on market 96 days — a 9% lower offer ($189k) is reasonable based on typical stale-listing flexibility.
- 4 sale attempts since 2y ago; this cycle's ask has dropped $16k (7%) from the opening price — seller is motivated, your offer sets the floor, not the list.
Risks & watch-outs
- Climate carrying-cost: severe wind risk, 80% chance of damaging wind over 30y; moderate wildfire risk; extreme-heat days projected 7→21/yr by 2055 (HVAC capex compounding) — expect insurance premiums to compound above CPI over the hold.
Questions for the listing agent
- What do current leases actually rent for vs. the listed asking? Can we see a recent rent roll and the last 12 months of T-12 income?
- It's been on market 96 days. Have you received any prior offers? Is the seller open to a 16% concession, seller financing, or rate buy-down credit?
- What does the HOA fee cover, when was the last increase, and are there any pending special assessments or reserve-fund shortfalls?
- Why hasn't it sold? Are there any deal-killer items the seller is aware of (foundation, flood, title, zoning, code violations)?
- Is there a deadline driving the sale (1031 exchange, divorce, estate, relocation)? That informs how much negotiation room exists.
- The area grade is low — what's the realistic commute time and amenity access for the typical tenant pool here? Any planned neighborhood developments (good or bad) we should know about?
- What's the average days-on-market for RENTAL listings here right now (not sales)? A rising rental-DOM trend means longer vacancies and softer asking-rent achievability than the comps imply.
- What's the recent tenant-quality profile in this submarket — average credit score on applications, eviction rate, late-payment / NSF rate, and stable-employment percentage? A property-management company in the area should have these aggregated.
- How much new for-sale + rental construction is in the pipeline within 1–3 miles? Heavy new supply typically softens prices + rents 12–24 months out; constrained supply supports both.
Investment metrics
- 1% rule
- 0.84% ✗
- Cap rate
- 5.51%
- Cash-on-cash
- -2.78%
- DSCR
- 0.88
- GRM
- 9.9
CMA / ARV
- ARV (median comp)
- $243,287
- List price
- $208,000
- Delta
- -14.50%
- Verdict
- UNDERPRICED
- Comps
- 20 within 1.0 mi
Show comp detail 12 sales within ~0.75 mi
| Address | Dist | Beds/Ba | Sqft | Sold | Price | $/sf | Match |
|---|---|---|---|---|---|---|---|
| 7918 Rocky | 0.25mi | 3/2.0 | 1,504 (-1%) | 2mo | $225,000 | $150 | 85 |
| 7812 Rio Rdgs | 0.35mi | 3/4.0 | 1,524 (+0%) | 1mo | $347,600 | $228 | 74 |
| 6670 Snow Meadow Dr | 0.69mi | 3/2.0 | 1,513 (-0%) | 2mo | $169,900 | $112 | 66 |
| 6630 Snow Mdw | 0.75mi | 3/2.0 | 1,525 (+0%) | 0mo | $215,000 | $141 | 64 |
| 5943 Woodlake Acres | 0.34mi | 3/2.5 | 1,693 (+12%) | 1mo | $325,475 | $192 | 62 |
| 7819 Horse Holw | 0.70mi | 3/2.5 | 1,547 (+2%) | 2mo | $175,000 | $113 | 60 |
| 4838 Via Sonoma Trl | 0.61mi | 3/2.5 | 1,611 (+6%) | 1mo | $260,000 | $161 | 59 |
| 7931 Pecan Hts | 0.42mi | 3/2.5 | 1,698 (+12%) | 1mo | $204,799 | $121 | 58 |
| 6555 Beech Trl | 0.67mi | 3/2.0 | 1,408 (-7%) | 2mo | $195,000 | $138 | 55 |
| 8174 Ocean Meadow Dr | 0.57mi | 3/2.5 | 1,698 (+12%) | 1mo | $198,975 | $117 | 51 |
| 8006 Coco Mdw | 0.68mi | 3/2.5 | 1,698 (+12%) | 1mo | $234,999 | $138 | 46 |
| 8517 Terlingua Cv | 0.69mi | 4/2.0 (+1) | 1,674 (+10%) | 1mo | $230,000 | $137 | 45 |
Match score weights: distance 35% · size 25% · config 20% · recency 20%. Top-matched comps best support the ARV.
Projected returns pro-forma
-3.0% appreciation · 0.75% rent growth · sell at horizon
- IRR
- -23.6%
- Equity multiple
- 0.21×
- Total profit
- $-46,099
- Equity at exit
- $31,013
- IRR
- -26.5%
- Equity multiple
- -0.13×
- Total profit
- $-66,069
- Equity at exit
- $17,984
Cash invested: $58,240 (down + closing). Projections, not guarantees.
Landlord ↔ Tenant lean methodology
- Overall (STATE)
- 87 Strongly Landlord-Friendly
- State Texas
- 87 Strongly Landlord-Friendly · R+5
- County
- — inherits STATE
- City
- — inherits STATE
ZIP-level market 78244
- Home prices YoY
- -4.4%
- Rents YoY
- 0.8%
- Active inventory
- 193
- Price-to-rent
- 9.9×
Monthly cashflow live
- Estimated rent
- $1,743 high interval (Pro) →
- Mortgage (P&I)
- −$1,091
- Tax from tax record
- −$316 /mo · $3,787/yr
- Insurance
- −$87
- HOA
- −$19
- Vacancy / Maint / Mgmt
- −$366
- Net cashflow
- $-135
Break-even live
Sensitivity live
| Price | -10% $-17 | -5% $-76 | +0% $-135 | +5% $-194 | +10% $-253 |
|---|---|---|---|---|---|
| Rent | -10% $-273 | -5% $-204 | +0% $-135 | +5% $-66 | +10% $3 |
| Rate | -1.0pp $-30 | -0.5pp $-82 | base $-135 | +0.5pp $-189 | +1.0pp $-244 |
UW: 25.0% down · 7.5% · 30yr · 1.5% tax · 5.0% vac · 8.0% maint · 8.0% mgmt
Financing live
Cash to close
- Down payment
- $52,000
- Closing costs
- $6,240
- Reserves months
- —
- Total cash needed
- —
Loan-product check · same deal, 3 products live
Conventional
25% down · 7.5% · 30yr
- Down + closing
- —
- Monthly P&I
- —
- Monthly cashflow
- —
- DSCR
- —
- Eligible?
- —
Personal DTI + credit; lowest rate.
DSCR
20% down · 8.5% · 30yr
- Down + closing
- —
- Monthly P&I
- —
- Monthly cashflow
- —
- DSCR
- —
- Eligible?
- —
No personal income docs; deal must DSCR.
Hard money
10% down · 12.0% · 12mo
- Down + closing
- —
- Monthly P&I
- —
- Monthly cashflow
- —
- DSCR
- —
- Eligible?
- —
Short-term bridge; refi at stabilization.
Rent comps 40 comps
| Address | Beds | Baths | Sqft | Rent | $/sqft | DOM | Units | Dist |
|---|---|---|---|---|---|---|---|---|
| 5715 Soothing Water San Antonio, TX | 4.0 | 2.5 | 2066 | $1,850 | $0.90 | 25d | 1 | 0.12mi |
| 7839 Bypass Shls San Antonio, TX | 3.0 | 2.0 | 2187 | $1,600 | $0.73 | 25d | 1 | 0.13mi |
| 5514 Soothing Water San Antonio, TX | 3.0 | 2.5 | 1700 | $1,750 | $1.03 | 5d | 1 | 0.21mi |
| 5735 Cool River Way San Antonio, TX | 3.0–5.0 | 2.0–3.5 | 2059 | $1,951 | $0.95 | 0d | 5 | 0.34mi |
| 6106 Secret Shrs San Antonio, TX | 3.0 | 2.5 | 1698 | $1,500 | $0.88 | 25d | 1 | 0.39mi |
| 5744 Brook Pr San Antonio, TX | 3.0 | 2.0 | 1151 | $1,705 | $1.48 | 0d | 1 | 0.44mi |
| 5736 Brook Pr San Antonio, TX | 3.0 | 2.5 | 1497 | $1,500 | $1.00 | 25d | 1 | 0.44mi |
| 7807 Pecan Hts San Antonio, TX | 3.0 | 2.0 | 1520 | $1,600 | $1.05 | 16d | 1 | 0.51mi |
| 8030 Falcon Mdw Converse, TX | 3.0 | 2.0 | 2144 | $1,829 | $0.85 | 4d | 1 | 0.54mi |
| 8007 Chestnut Bluff Dr Converse, TX | 4.0 | 2.5 | 2145 | $1,825 | $0.85 | 16d | 1 | 0.57mi |
| 8127 Ocean Meadow Dr Converse, TX | 3.0 | 2.0 | 1520 | $1,700 | $1.12 | 45d | 1 | 0.57mi |
| 8555 Barefoot Ln Converse, TX | 3.0 | 2.5 | 1780 | $2,050 | $1.15 | 25d | 1 | 0.58mi |
| 5475 Bluebell Mdw Converse, TX | 3.0 | 2.5 | 1605 | $1,695 | $1.06 | 45d | 1 | 0.60mi |
| 7923 Horse Holw San Antonio, TX | 3.0 | 2.0 | 1916 | $1,599 | $0.83 | 4d | 1 | 0.60mi |
| 8511 Amistad Cv Converse, TX | 3.0 | 2.0 | 1440 | $1,479 | $1.03 | 6d | 1 | 0.60mi |
| 8511 Cassia Cv Converse, TX | 3.0 | 2.0 | 1910 | $1,700 | $0.89 | 45d | 1 | 0.63mi |
| 8151 Cheryl Meadow Dr Converse, TX | 3.0 | 2.5 | 1698 | $1,730 | $1.02 | 6d | 1 | 0.63mi |
| 5814 Lilac Lndg Converse, TX | 3.0 | 2.0 | 1532 | $1,775 | $1.16 | 6d | 1 | 0.64mi |
| 8011 Chestnut Barr Dr Converse, TX | 3.0 | 2.0 | 1520 | $1,665 | $1.10 | 45d | 1 | 0.66mi |
| 5622 Rowan Rdg Converse, TX | 3.0 | 2.0 | 1412 | $1,625 | $1.15 | 25d | 1 | 0.68mi |
| 5622 Rowan Rdg Converse, TX | 3.0 | 2.0 | 1412 | $1,625 | $1.15 | 16d | 1 | 0.68mi |
| 6461 Firestone Pkwy San Antonio, TX | 3.0 | 2.0 | 1778 | $1,695 | $0.95 | 45d | 1 | 0.69mi |
| 7622 Mustang Mdw San Antonio, TX | 3.0 | 2.5 | 1574 | $1,500 | $0.95 | 6d | 1 | 0.72mi |
| 5118 Everett Loop Converse, TX | 4.0 | 2.0 | 1635 | $1,599 | $0.98 | 16d | 1 | 0.72mi |
| 5631 Pearl Mdw Converse, TX | 3.0 | 2.0 | 1410 | $1,500 | $1.06 | 25d | 1 | 0.72mi |
| 7811 Caballo Cyn San Antonio, TX | 3.0 | 2.5 | 1547 | $1,445 | $0.93 | 0d | 1 | 0.73mi |
| 8411 Favero Cv Converse, TX | 4.0 | 2.0 | 1668 | $1,695 | $1.02 | 45d | 1 | 0.73mi |
| 4660 Via Sonoma Trl Converse, TX | 3.0 | 2.5 | 2098 | $1,900 | $0.91 | 45d | 1 | 0.74mi |
| 5628 Pearl Mdw Converse, TX | 4.0 | 3.0 | 2241 | $1,970 | $0.88 | 0d | 1 | 0.75mi |
| 7510 Legend Rock San Antonio, TX | 3.0 | 2.0 | 2162 | $1,875 | $0.87 | 25d | 1 | 0.78mi |
| 6491 Beech Trail Dr Converse, TX | 3.0 | 2.0 | 1520 | $2,100 | $1.38 | 45d | 1 | 0.78mi |
| 6439 Beech Trail Dr Converse, TX | 3.0 | 2.0 | 1520 | $1,450 | $0.95 | 14d | 1 | 0.79mi |
| 4715 Appaloosa Run San Antonio, TX | 3.0 | 2.5 | 1774 | $1,595 | $0.90 | 18d | 1 | 0.80mi |
| 7718 Burro Bnd San Antonio, TX | 3.0 | 2.5 | 1547 | $1,650 | $1.07 | 5d | 1 | 0.80mi |
| 8210 Steep Vly Converse, TX | 3.0 | 2.5 | 1757 | $1,485 | $0.85 | 45d | 1 | 0.82mi |
| 7326 Putter San Antonio, TX | 2.0 | 2.5 | 1826 | $1,599 | $0.88 | 0d | 1 | 0.82mi |
| 7326 Putter San Antonio, TX | 2.0 | 2.5 | 1826 | $1,599 | $0.88 | 14d | 1 | 0.82mi |
| 6802 Canary Meadow Dr Converse, TX | 3.0 | 2.0 | 1734 | $1,550 | $0.89 | 25d | 1 | 0.83mi |
| 8162 Heights Vly Converse, TX | 4.0 | 2.5 | 1828 | $1,680 | $0.92 | 45d | 1 | 0.83mi |
| 8335 Bent Meadow Dr Converse, TX | 3.0 | 2.0 | 1513 | $1,595 | $1.05 | 45d | 1 | 0.84mi |
HOA detail
- Monthly dues
- $19 · $228/yr
Listing history 21 events
-
2026-06-10status $208,000 Pending 96 DOM
-
2026-06-09days on market $208,000 Active Option 96 DOM
-
2026-06-08days on market $208,000 Active Option 95 DOM
-
2026-06-07days on market $208,000 Active Option 94 DOM
-
2026-06-04days on market $208,000 Active Option 91 DOM
-
2026-06-03days on market $208,000 Active Option 90 DOM
-
2026-06-02days on market $208,000 Active Option 89 DOM
-
2026-06-01days on market $208,000 Active Option 88 DOM
-
2026-05-31days on market $208,000 Active Option 87 DOM
-
2026-05-01price $199,900 516-char remark
Show marketing remark (516 chars)
Come & Enjoy Private Greenbelt Access with this Move in Ready 3-bedroom, 2-bath Exceptionally Maintained Property. Turnkey One Story + All Brick home nestled in the sought-after Brentfield neighborhood of San Antonio. Tucked beneath the shade of mature trees, this property offers a serene retreat with a rare blend of privacy and character. Step inside to a warm, Functional Open Layout with Fresh Paint Throughout + NO CARPET ideal for anyone seeking comfort and space. Outside, enjoy a Private fully fenced ba
-
2026-03-20price $222,000 516-char remark
Show marketing remark (516 chars)
Come & Enjoy Private Greenbelt Access with this Move in Ready 3-bedroom, 2-bath Exceptionally Maintained Property. Turnkey One Story + All Brick home nestled in the sought-after Brentfield neighborhood of San Antonio. Tucked beneath the shade of mature trees, this property offers a serene retreat with a rare blend of privacy and character. Step inside to a warm, Functional Open Layout with Fresh Paint Throughout + NO CARPET ideal for anyone seeking comfort and space. Outside, enjoy a Private fully fenced ba
-
2026-03-05$224,000 New 516-char remark
Show marketing remark (516 chars)
Come & Enjoy Private Greenbelt Access with this Move in Ready 3-bedroom, 2-bath Exceptionally Maintained Property. Turnkey One Story + All Brick home nestled in the sought-after Brentfield neighborhood of San Antonio. Tucked beneath the shade of mature trees, this property offers a serene retreat with a rare blend of privacy and character. Step inside to a warm, Functional Open Layout with Fresh Paint Throughout + NO CARPET ideal for anyone seeking comfort and space. Outside, enjoy a Private fully fenced ba
-
2026-03-04historical
-
2026-03-02$224,000 New
-
2026-01-24historical
-
2025-09-06price $224,000
-
2025-07-30price $239,000
-
2025-05-22$245,000 New
-
2024-06-06historical
-
2024-03-19price $229,900
-
2024-03-01$234,900 New
ⓘ Source: listings_history table (triggers on properties + properties_extension) + one-shot
backfill from property_details.listing_events for pre-trigger history.
Tax reassessment forecast TX · Resets to sale price
- Current annual tax
- $3,787 · $316/mo
- Projected year-2 tax
- $3,806 · $317/mo
- Expected delta
- +$20/yr (+$2/mo · 0.5%)
ⓘ Screening estimate from a state-policy table — verify with the county assessor before closing.
Climate risk First Street
- Flood 1/10 Low FEMA zone X (unshaded) · 0% chance over 30 yrs
- Wildfire 5/10 Major
- Heat 8/10 Severe 7 d/yr ≥108°F today · 21 d/yr by 30 yrs out
- Wind 8/10 Severe 80% chance of damaging wind over 30 yrs
- Air quality 1/10 Low 0 unhealthy d/yr today · 0 by 30 yrs out
Nearby sold comps map
Loading sold comps map…
Walkable amenities ~0.75 mi
Loading nearby amenities…
Taxation est. · year 1
- Rental income
- $20,914
- − Mortgage interest
- −$11,651
- − Property taxes
- −$3,787
- − Insurance
- −$1,040
- − Repairs & maintenance
- −$1,673
- − Management
- −$1,673
- − HOA
- −$228
- − Depreciation
- −$6,051
- Taxable loss
- −$5,189
- Est. tax savings @ 24.0%
- +$1,245
- After-tax cash flow
- $-376/yr
For passive investors: Depreciation is non-cash, so a rental often shows a tax loss while cash-flowing — sheltering income. Rental losses are passive: they offset passive income freely, and up to $25,000/yr can offset ordinary (W-2) income if you actively participate and your MAGI is under $100k (phasing out to $0 by $150k); unused losses carry forward. On sale, claimed depreciation is recaptured at up to 25%, and gains may owe capital-gains tax (a 1031 exchange can defer both). Figures are a year-1 estimate at your 24.0% rate — not tax advice; consult a CPA.
Schools (NCES district)
- District
- Judson ISD
- NCES district ID
- 4824990
- Math proficiency
- 21% ▼ -21.00%
- Reading proficiency
- 33% ▼ -7.00%
- Median HH income
- $57,542
- Composite
- 24.39/100
- National rank
- #7689
- State rank
- #660 of 826 in TX
Livability — Converse
- Score
- 66/100
- State rank
- #649
- US rank
- #12250
Category grades
Schools grade is shown separately in the Schools card above.
Census & demographics
- County
- Bexar County · 1,990,555 people
- City population
- 63,067
- Metro
- San Antonio-New Braunfels, TX
- Population (ZIP)
- 38,092
- Household income
- $71,128
- Rent vs Own
- Severe rent burden
- 677.0
Population outlook (Bexar County) Hauer SSP2
- Today (2025)
- 2,336,851 people
- By 2030
- 2,560,728 · +9.6%
- By 2040
- 3,020,569 · +29.3%
- By 2050
- 3,493,522 · +49.5%
- By 2075
- 4,668,459 · +99.8%
- By 2100
- 5,533,242 · +136.8%
Race, ethnicity, and origin ACS 2023
- Neighborhood character
- Diverse neighborhood (Simpson 0.68)
- Race & ethnicity
- Hispanic / Latino 46% Black 27% Two or more races 24% White 20% Asian 2%
- Hispanic origin (detail)
- Mexican 38% Puerto Rican 2% Cuban 2%
- Common ancestry
- Slovak 2% Lithuanian 1% Italian 1%
- Foreign-born
- 14% · Canada, Vietnam
- Languages at home
- 68% English-only · Spanish 28% Vietnamese 1% Tagalog/Filipino 1%
Political lean MEDSL · Bexar
- 2024 margin
- Lean D (+9.8) · D 54.3% · R 44.6% · Other 1.1%
- 2008→2024 swing
- +4.2pp toward D · 2008: 5.6pp · 2024: 9.8pp
- All cycles
- 2024: D+9.8 2020: D+18.2 2016: D+13.5 2012: D+4.6 2008: D+5.6
Not yet ingested
- Civics
- —
Market trends
- HPI YoY
- ▼ -11.42%
- Current HPI
- 249.3834
- Rent YoY
- ▲ 0.75%
- Metro
- San Antonio-New Braunfels, TX
- State GDP YoY
- ▲ 3.95%
- F500 in state
- 110
Industry mix (Fortune 500 HQ in TX)
| Industry | F500 HQs | Revenue |
|---|---|---|
| Energy | 16 | $1,198B |
|
||
| Technology | 5 | $198B |
|
||
| Engineering / Construction | 4 | $72B |
|
||
| Energy Services | 3 | $60B |
|
||
| Utilities | 3 | $41B |
|
||
| Healthcare | 2 | $330B |
|
||
Price history
-14.9% since first listed12 events — show timeline
- 2026-05-01 Price Changed $199,900 LERA
- 2026-03-20 Price Changed $222,000 LERA
- 2026-03-05 Listed $224,000 LERA
- 2026-03-04 Listing Removed — LERA
- 2026-03-02 Listed $224,000 LERA
- 2026-01-24 Listing Removed — LERA
- 2025-09-06 Price Changed $224,000 LERA
- 2025-07-30 Price Changed $239,000 LERA
- 2025-05-22 Listed $245,000 LERA
- 2024-06-06 Listing Removed — LERA
- 2024-03-19 Price Changed $229,900 LERA
- 2024-03-01 Listed $234,900 LERA
Property tax history
+12.0%/yrLatest (2025): $3,787 · +3.3% YoY. Source: county tax records.
Cash-flow waterfall
monthlySold comps — $/sqft
last 12 mo · ≤1 miLoading sold comps…