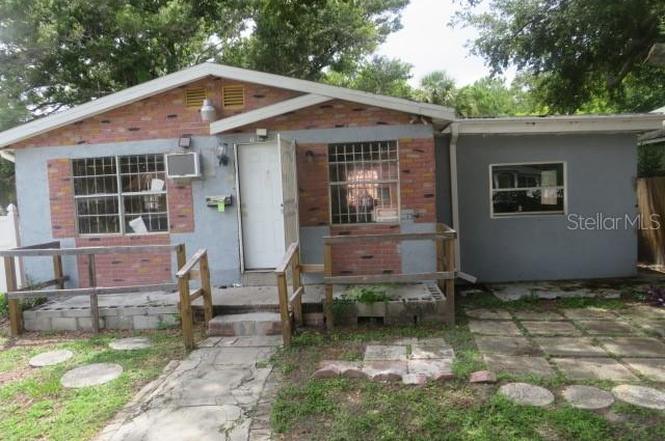
1785 42nd St S · St. Petersburg, FL
Flood risk 1/10 · Minimal
- FEMA flood zone
- X (unshaded)
- Chance of flooding over 30 yrs
- 0.0%
- Est. flood insurance / yr
- $507 – $1,088
Fire risk 1/10 · Minimal
- Est. fire insurance / yr
- $947 – $1,759
Heat risk 10/10 · Severe
- Hot days now (above 106°F)
- 7 days/yr
- Hot days in 30 yrs
- 26 days/yr
Wind risk 10/10 · Severe
- Chance of severe wind over 30 yrs
- 99.0%
Air-quality risk 4/10 · Minor
- Unhealthy air days now
- 4 days/yr
- Unhealthy air days in 30 yrs
- 4 days/yr
Risk factors via First Street. Map © Google.
Why this score? — see what drove the B- grade
The composite is a weighted blend of 9 inputs, each scored 0–100. Each bar is that input's sub-score; the figure is the points it added to the 100-point composite (weight × sub-score).
- Cash flow +30.0/30.0
- 1% rule +10.0/10.0
- DSCR +10.0/10.0
- ARV discount +7.5/15.0
- Schools +4.3/10.0
- Livability +2.5/5.0
- Condition / age +2.5/5.0
- Rent growth +2.1/5.0
- Appreciation +0.0/10.0
$120,000
🖨 Deal sheet (PDF) 📄 Offer letter ✓ Due diligence
Listing remarks
Bring your best offer! EM is nonrefundable and no inspection contingency is allowed. Cash offers will be given preference. All offers due by Thursday 3/26 at 5 pm.
Key facts
- Plenty of storage
- Eat in kitchen
- Family room
Tags
Property features AI
Finance
- Other: Unfurnished; No lease restrictions
- Financial info:
- HOA & community: No association; No association approval required
Exterior
- Parking:
- Security:
- Utilities: Public water; Public sewer; Electricity connected; Water connected; Sewer connected
- Home design: Single family residence; Residential property; One story; Northeast facing
- Construction: Brick and frame construction; Shingle roof; Slab foundation; Built on a 0.13-acre lot (approx. 50 x 128)
- Exterior features: Sidewalk
Interior
- Kitchen: No appliances included
- Bedrooms: 2 bedrooms
- Flooring: Linoleum flooring
- Bathrooms: 2 full bathrooms
- Heating & cooling: Central heating; Central air conditioning
- Interior features: Other interior features
- Laundry & utility: Other laundry features
Neighborhood map
What this means for you Summary
Snapshot
- This is a 2-bed/2.0-bath single-family listed at $120k.
Deal economics
- At list price, monthly cash flow is $768 ($9k/yr) — positive.
- The deal already cash-flows at list — no discount required.
- Meets the 1% rule at list price ($2k rent vs $120k).
- Recommended offer: $106k (12.0% below list) — sets the bar for market timing.
- Cap rate 14.0% vs local median 2.6% in St. Petersburg — top-decile yield for the area; either an underpriced asset or a hidden risk that comps aren't pricing in. Stress-test before assuming the spread holds.
Location & tenants
- Location reads: area grade B — affects rentability + tenant quality, not the cash-flow math above.
- Pinellas (suburban): math 51% / reading 51% proficiency, ranked #31 of 73 in FL (top 42%) — acceptable for families but not a draw, mixed tenant base, ~2y average lease.
- Market conditions: Rents soft (-1.5%/yr); 266 active listings in the ZIP; 40 comparable units currently listed for rent nearby; rentals leasing fast (median 12d on market — plan ~1-2 weeks tenant-placement turnaround); 2,676 units permitted in Pinellas County in 2024 (1,422 in 5+ unit buildings).
- This rent runs 42% of the median local income ($67k/yr) — at the standard rent-burdened threshold; future hikes will face affordability resistance.
Forward outlook
- Local home prices are declining (-3.0%/yr); year-one equity from $830 of loan paydown is wiped out by about $4k of value loss. Plan a longer hold.
- Pinellas County population projected at +14% by 2050 — modest demand growth; plan on rents tracking national, not racing it.
- At projected returns (-3.0% appreciation + 0.0% rent growth), your $34k cash investment doubles in ~6 years — after that, you're playing with house money.
Negotiation context
- It's been on market 212 days — a 12% lower offer ($106k) is reasonable based on typical stale-listing flexibility.
- 7 sale attempts since 2y ago; this cycle's ask has dropped $50k (29%) from the opening price — seller is motivated, your offer sets the floor, not the list.
Risks & watch-outs
- Watch-outs: property tax is 3.9% of price.
- Climate carrying-cost: severe wind risk, 99% chance of damaging wind over 30y; extreme-heat days projected 7→26/yr by 2055 (HVAC capex compounding) — expect insurance premiums to compound above CPI over the hold.
Questions for the listing agent
- It's been on market 212 days. Have you received any prior offers? Is the seller open to a 12% concession, seller financing, or rate buy-down credit?
- Built in 1970 — when were the roof, HVAC, electrical panel, plumbing, and water heater last replaced?
- Property tax is high relative to price — has the assessment been appealed recently, and will the sale trigger a re-assessment?
- Why hasn't it sold? Are there any deal-killer items the seller is aware of (foundation, flood, title, zoning, code violations)?
- Is there a deadline driving the sale (1031 exchange, divorce, estate, relocation)? That informs how much negotiation room exists.
- What's the average days-on-market for RENTAL listings here right now (not sales)? A rising rental-DOM trend means longer vacancies and softer asking-rent achievability than the comps imply.
- What's the recent tenant-quality profile in this submarket — average credit score on applications, eviction rate, late-payment / NSF rate, and stable-employment percentage? A property-management company in the area should have these aggregated.
- How much new for-sale + rental construction is in the pipeline within 1–3 miles? Heavy new supply typically softens prices + rents 12–24 months out; constrained supply supports both.
Investment metrics
- 1% rule
- 1.94% ✓
- Cap rate
- 13.97%
- Cash-on-cash
- 27.43%
- DSCR
- 2.22
- GRM
- 4.3
CMA / ARV
- ARV (on-the-fly)
- $431,262
- Comps found
- 12
Show comp detail 12 sales within ~0.75 mi
| Address | Dist | Beds/Ba | Sqft | Sold | Price | $/sf | Match |
|---|---|---|---|---|---|---|---|
| 4649 Queensboro Ave S | 0.39mi | 3/2.0 (+1) | 1,479 (-0%) | 8mo | $459,900 | $311 | 70 |
| 2301 46th St S | 0.48mi | 3/2.0 (+1) | 1,530 (+3%) | 8mo | $415,000 | $271 | 61 |
| 4534 24th Ave S | 0.47mi | 3/2.0 (+1) | 1,506 (+2%) | 12mo | $515,000 | $342 | 60 |
| 1625 39th St S | 0.28mi | 3/2.0 (+1) | 1,635 (+10%) | 10mo | $470,000 | $287 | 56 |
| 1825 44th St S | 0.20mi | 3/2.0 (+1) | 1,321 (-11%) | 15mo | $268,160 | $203 | 55 |
| 2648 46th St S | 0.69mi | 3/2.0 (+1) | 1,374 (-7%) | 1mo | $485,000 | $353 | 50 |
| 2602 47th St S | 0.68mi | 3/2.0 (+1) | 1,600 (+8%) | 4mo | $720,000 | $450 | 47 |
| 4742 9th Ave S | 0.74mi | 3/1.5 (+1) | 1,512 (+2%) | 14mo | $270,000 | $179 | 43 |
| 4658 25th Ave S | 0.63mi | 3/2.0 (+1) | 1,287 (-13%) | 0mo | $375,000 | $291 | 43 |
| 3632 15th Ave S | 0.49mi | 3/2.0 (+1) | 1,302 (-12%) | 11mo | $325,000 | $250 | 43 |
| 2624 Quincy St S | 0.58mi | 2/2.5 | 1,296 (-13%) | 15mo | $250,000 | $193 | 38 |
| 2609 Upton St S | 0.73mi | 3/2.0 (+1) | 1,666 (+12%) | 9mo | $507,500 | $305 | 33 |
Match score weights: distance 35% · size 25% · config 20% · recency 20%. Top-matched comps best support the ARV.
Projected returns pro-forma
-3.0% appreciation · 0.0% rent growth · sell at horizon
- IRR
- 17.6%
- Equity multiple
- 1.68×
- Total profit
- $22,847
- Equity at exit
- $17,892
- IRR
- 23.5%
- Equity multiple
- 2.71×
- Total profit
- $57,303
- Equity at exit
- $10,375
Cash invested: $33,600 (down + closing). Projections, not guarantees.
Landlord ↔ Tenant lean methodology
- Overall (STATE)
- 87 Strongly Landlord-Friendly
- State Florida
- 87 Strongly Landlord-Friendly · R+3
- County
- — inherits STATE
- City
- — inherits STATE
ZIP-level market 33711
- Rents YoY
- -1.5%
- Active inventory
- 266
- Price-to-rent
- 4.3×
Monthly cashflow live
- Estimated rent
- $2,325 high interval (Pro) →
- Mortgage (P&I)
- −$629
- Tax from tax record
- −$389 /mo · $4,668/yr
- Insurance
- −$50
- HOA
- −$0
- Vacancy / Maint / Mgmt
- −$488
- Net cashflow
- $768
Break-even live
Sensitivity live
| Price | -10% $836 | -5% $802 | +0% $768 | +5% $734 | +10% $700 |
|---|---|---|---|---|---|
| Rent | -10% $584 | -5% $676 | +0% $768 | +5% $860 | +10% $952 |
| Rate | -1.0pp $829 | -0.5pp $799 | base $768 | +0.5pp $737 | +1.0pp $705 |
UW: 25.0% down · 7.5% · 30yr · 1.5% tax · 5.0% vac · 8.0% maint · 8.0% mgmt
Financing live
Cash to close
- Down payment
- $30,000
- Closing costs
- $3,600
- Reserves months
- —
- Total cash needed
- —
Loan-product check · same deal, 3 products live
Conventional
25% down · 7.5% · 30yr
- Down + closing
- —
- Monthly P&I
- —
- Monthly cashflow
- —
- DSCR
- —
- Eligible?
- —
Personal DTI + credit; lowest rate.
DSCR
20% down · 8.5% · 30yr
- Down + closing
- —
- Monthly P&I
- —
- Monthly cashflow
- —
- DSCR
- —
- Eligible?
- —
No personal income docs; deal must DSCR.
Hard money
10% down · 12.0% · 12mo
- Down + closing
- —
- Monthly P&I
- —
- Monthly cashflow
- —
- DSCR
- —
- Eligible?
- —
Short-term bridge; refi at stabilization.
Rent comps 40 comps
| Address | Beds | Baths | Sqft | Rent | $/sqft | DOM | Units | Dist |
|---|---|---|---|---|---|---|---|---|
| 1628 43rd St S Saint Petersburg, FL | 3.0 | 2.0 | 1045 | $2,100 | $2.01 | 25d | 1 | 0.16mi |
| 4327 17th Ave S Saint Petersburg, FL | 2.0 | 1.0 | 880 | $2,500 | $2.84 | 25d | 1 | 0.18mi |
| 2044 44th St S Saint Petersburg, FL | 3.0 | 2.0 | 1384 | $2,600 | $1.88 | 23d | 1 | 0.25mi |
| 1642 39th St S Saint Petersburg, FL | 3.0 | 1.0 | 975 | $1,995 | $2.05 | 21d | 1 | 0.29mi |
| 1327 43rd St S Saint Petersburg, FL | 3.0 | 1.5 | 959 | $2,250 | $2.35 | 5d | 1 | 0.35mi |
| 4631 Queensboro Ave S St Petersburg, FL | 3.0 | 2.0 | 1094 | $2,600 | $2.38 | 12d | 1 | 0.39mi |
| 4631 Queensboro Ave S Unit 4631 St. Petersburg, FL | 3.0 | 2.0 | 1094 | $2,600 | $2.38 | 8d | 1 | 0.39mi |
| 4618 20th Ave S Saint Petersburg, FL | 2.0 | 1.0 | 921 | $1,800 | $1.95 | 4d | 1 | 0.40mi |
| 4029 13th Ave S St Petersburg, FL | 3.0 | 2.0 | 1152 | $2,650 | $2.30 | 25d | 1 | 0.40mi |
| 4601 22nd Ave S Saint Petersburg, FL | 1.0–2.0 | 1.0 | 872 | $1,349 | $1.55 | 3d | 3 | 0.46mi |
| 4616 22nd Ave S Saint Petersburg, FL | 2.0 | 1.0 | 1200 | $2,400 | $2.00 | 25d | 1 | 0.46mi |
| 2510 38th St S Saint Petersburg, FL | 3.0 | 1.5 | 1104 | $2,340 | $2.12 | 5d | 1 | 0.55mi |
| 2510 38th St S Saint Petersburg, FL | 3.0 | 1.5 | 1104 | $2,340 | $2.12 | 25d | 1 | 0.55mi |
| 4421 11th Ave S Saint Petersburg, FL | 3.0 | 2.0 | 945 | $2,000 | $2.12 | 5d | 1 | 0.57mi |
| 4700 10th Ave S Saint Petersburg, FL | 3.0 | 2.0 | 1300 | $2,500 | $1.92 | 21d | 1 | 0.69mi |
| 2800 Tifton St S Gulfport, FL | 3.0 | 2.0 | 1472 | $3,500 | $2.38 | 25d | 1 | 0.77mi |
| 4801 10th Ave S Unit 1 St. Petersburg, FL | 3.0 | 1.0 | 1100 | $2,200 | $2.00 | 25d | 1 | 0.77mi |
| 4933 13th Ave S Gulfport, FL | 2.0 | 1.0 | 939 | $2,200 | $2.34 | 21d | 1 | 0.78mi |
| 2800 47th St S Gulfport, FL | 2.0 | 1.0 | 890 | $2,300 | $2.58 | 5d | 1 | 0.80mi |
| 3627 29th Ave S Saint Petersburg, FL | 2.0 | 1.0 | 1040 | $2,000 | $1.92 | 8d | 1 | 0.83mi |
| 2402 52nd St S Gulfport, FL | 2.0 | 2.0 | 1028 | $3,000 | $2.92 | 5d | 1 | 0.92mi |
| 4711 Fairfield Ave S Saint Petersburg, FL | 3.0 | 2.0 | 1135 | $2,800 | $2.47 | 5d | 1 | 0.94mi |
| 4541 6th Ave S Saint Petersburg, FL | 3.0 | 1.0 | 945 | $1,100 | $1.16 | 16d | 1 | 0.94mi |
| 1701 53rd St S Gulfport, FL | 3.0 | 1.0 | 994 | $2,800 | $2.82 | 5d | 1 | 0.95mi |
| 3089 15th Ave S Saint Petersburg, FL | 3.0 | 2.0 | 1000 | $2,195 | $2.19 | 5d | 1 | 0.95mi |
| 3091 15th Ave S St. Petersburg, FL | 3.0 | 2.0 | 1000 | $2,195 | $2.19 | 25d | 1 | 0.95mi |
| 3280 37th Way S Unit B Saint Petersburg, FL | 2.0 | 2.0 | 1100 | $1,700 | $1.55 | 25d | 1 | 1.01mi |
| 800 51st St S Gulfport, FL | 3.0 | 2.0 | 1258 | $3,200 | $2.54 | 5d | 1 | 1.02mi |
| 2865 51st St S Gulfport, FL | 2.0 | 1.0 | 944 | $1,900 | $2.01 | 12d | 1 | 1.05mi |
| 2865 51st St S Unit 5 Gulfport, FL | 2.0 | 1.0 | 944 | $1,900 | $2.01 | 15d | 1 | 1.06mi |
| 404 Madison St S Saint Petersburg, FL | 3.0 | 1.0 | 1391 | $2,500 | $1.80 | 5d | 1 | 1.08mi |
| 2506 54th St S Gulfport, FL | 2.0 | 1.0 | 876 | $1,800 | $2.05 | 8d | 1 | 1.09mi |
| 2506 54th St S Gulfport, FL | 2.0 | 1.0 | 938 | $1,800 | $1.92 | 25d | 1 | 1.09mi |
| 450 47th St S Saint Petersburg, FL | 3.0 | 1.0 | 960 | $2,950 | $3.07 | 5d | 1 | 1.10mi |
| 3301 32nd Ave S Saint Petersburg, FL | 1.0–2.0 | 1.0–2.0 | 914 | $2,750 | $3.01 | 4d | 10 | 1.11mi |
| 3595 41st Ln S Unit B Saint Petersburg, FL | 2.0 | 2.0 | 1100 | $2,550 | $2.32 | 25d | 1 | 1.14mi |
| 3640 41st Ln S Unit F Saint Petersburg, FL | 2.0 | 2.0 | 1150 | $2,150 | $1.87 | 5d | 1 | 1.16mi |
| 3715 42nd Way S Unit 61F St. Petersburg, FL | 1.0 | 1.0 | 1000 | $2,100 | $2.10 | 8d | 1 | 1.17mi |
| 4018 2nd Ave S Saint Petersburg, FL | 3.0 | 1.0 | 1176 | $2,095 | $1.78 | 5d | 1 | 1.18mi |
| 3620 41st Way S Unit 73B St. Petersburg, FL | 1.0 | 1.0 | 1000 | $2,100 | $2.10 | 25d | 1 | 1.18mi |
Listing history 27 events
-
2026-06-18days on market $120,000 Active 212 DOM
-
2026-06-17days on market $120,000 Active 211 DOM
-
2026-06-16days on market $120,000 Active 210 DOM
-
2026-06-15days on market $120,000 Active 209 DOM
-
2026-06-13days on market $120,000 Active 207 DOM
-
2026-06-09days on market $120,000 Active 203 DOM
-
2026-06-08days on market $120,000 Active 202 DOM
-
2026-06-07days on market $120,000 Active 201 DOM
-
2026-05-31days on market $120,000 Active 198 DOM
-
2026-04-19price $120,000
-
2026-03-25price $1,000
-
2025-12-05status Active
-
2025-12-01status Pending
-
2025-11-18status Active
-
2025-11-12status Pending
-
2025-11-07status Active
-
2025-10-31status Pending
-
2025-10-28$170,000 Active
-
2025-08-31historical
-
2025-07-23price $170,000
-
2025-07-09price $180,000
-
2025-06-19price $190,000
-
2025-05-24$200,000 Active
-
2024-11-18historical
-
2024-10-14status Active
-
2024-10-07status Pending
-
2024-09-17$215,000 Active
ⓘ Source: listings_history table (triggers on properties + properties_extension) + one-shot
backfill from property_details.listing_events for pre-trigger history.
Tax reassessment forecast FL · Resets to sale price
- Current annual tax
- $4,668 · $389/mo
- Projected year-2 tax
- $4,668 · $389/mo
- Expected delta
- $0/yr ($0/mo · 0.0%)
ⓘ Screening estimate from a state-policy table — verify with the county assessor before closing.
Climate risk First Street
- Flood 1/10 Low FEMA zone X (unshaded) · 0% chance over 30 yrs
- Wildfire 1/10 Low
- Heat 10/10 Extreme 7 d/yr ≥106°F today · 26 d/yr by 30 yrs out
- Wind 10/10 Extreme 99% chance of damaging wind over 30 yrs
- Air quality 4/10 Moderate 4 unhealthy d/yr today · 4 by 30 yrs out
Nearby sold comps map
Loading sold comps map…
Walkable amenities ~0.75 mi
Loading nearby amenities…
Taxation est. · year 1
- Rental income
- $27,895
- − Mortgage interest
- −$6,722
- − Property taxes
- −$4,668
- − Insurance
- −$600
- − Repairs & maintenance
- −$2,232
- − Management
- −$2,232
- − Depreciation
- −$3,491
- Taxable income
- $7,951
- Est. tax owed @ 24.0%
- −$1,908
- After-tax cash flow
- $7,309/yr
For passive investors: Depreciation is non-cash, so a rental often shows a tax loss while cash-flowing — sheltering income. Rental losses are passive: they offset passive income freely, and up to $25,000/yr can offset ordinary (W-2) income if you actively participate and your MAGI is under $100k (phasing out to $0 by $150k); unused losses carry forward. On sale, claimed depreciation is recaptured at up to 25%, and gains may owe capital-gains tax (a 1031 exchange can defer both). Figures are a year-1 estimate at your 24.0% rate — not tax advice; consult a CPA.
Schools (NCES district)
- District
- Pinellas
- NCES district ID
- 1201560
- Math proficiency
- 51% ▼ -5.00%
- Reading proficiency
- 51% ▼ -3.00%
- Median HH income
- $46,270
- Composite
- 43.27/100
- National rank
- #3046
- State rank
- #31 of 73 in FL
Livability — St. Petersburg
No livability data for this city. (Only ~50 U.S. cities are tracked.)
Census & demographics
- Census place
- St. Petersburg, FL
- County
- Pinellas County · 939,478 people
- City population
- 249,151
- Metro
- Tampa-St. Petersburg-Clearwater, FL
- Population (ZIP)
- 20,013
- Household income
- $66,540
- Rent vs Own
- Severe rent burden
- 903.0
Population outlook (Pinellas County) Hauer SSP2
- Today (2025)
- 1,027,532 people
- By 2030
- 1,063,586 · +3.5%
- By 2040
- 1,125,020 · +9.5%
- By 2050
- 1,168,637 · +13.7%
- By 2075
- 1,265,188 · +23.1%
- By 2100
- 1,260,357 · +22.7%
Race, ethnicity, and origin ACS 2023
- Neighborhood character
- Diverse neighborhood (Simpson 0.59)
- Race & ethnicity
- White 45% Black 45% Hispanic / Latino 6% Two or more races 6%
- Hispanic origin (detail)
- Puerto Rican 1%
- Common ancestry
- Romanian 2% Lithuanian 2% Italian 1%
- Foreign-born
- 7% · Canada, Dominican Republic
- Languages at home
- 91% English-only · Spanish 4% French/Haitian/Cajun 3% Other Indo-European 1%
Political lean MEDSL · Pinellas
- 2024 margin
- Lean R (+5.2) · D 46.9% · R 52.1%
- 2008→2024 swing
- -13.5pp toward R · 2008: 8.3pp · 2024: -5.2pp
- All cycles
- 2024: R+5.2 2020: D+0.2 2016: R+1.1 2012: D+5.6 2008: D+8.3
Not yet ingested
- Civics
- —
Market trends
- HPI YoY
- ▼ -313.54%
- Current HPI
- 338.2712
- Rent YoY
- ▼ -1.47%
- Metro
- Tampa-St. Petersburg-Clearwater, FL
- State GDP YoY
- ▲ 3.28%
- F500 in state
- 36
Industry mix (Fortune 500 HQ in FL)
| Industry | F500 HQs | Revenue |
|---|---|---|
| Industrial Technology | 2 | $29B |
|
||
| Insurance | 2 | $17B |
|
||
| Retail | 1 | $60B |
|
||
| Technology Distribution | 1 | $58B |
|
||
| Homebuilding | 1 | $35B |
|
||
| Technology Manufacturing | 1 | $35B |
|
||
Price history
-44.2% since first listed18 events — show timeline
- 2026-04-19 Price Changed $120,000 Stellar MLS as Distributed by MLS Grid
- 2026-03-25 Price Changed $1,000 Stellar MLS as Distributed by MLS Grid
- 2025-12-05 Relisted — Stellar MLS as Distributed by MLS Grid
- 2025-12-01 Pending — Stellar MLS as Distributed by MLS Grid
- 2025-11-18 Relisted — Stellar MLS as Distributed by MLS Grid
- 2025-11-12 Pending — Stellar MLS as Distributed by MLS Grid
- 2025-11-07 Relisted — Stellar MLS as Distributed by MLS Grid
- 2025-10-31 Pending — Stellar MLS as Distributed by MLS Grid
- 2025-10-28 Listed $170,000 Stellar MLS as Distributed by MLS Grid
- 2025-08-31 Listing Removed — Stellar MLS as Distributed by MLS Grid
- 2025-07-23 Price Changed $170,000 Stellar MLS as Distributed by MLS Grid
- 2025-07-09 Price Changed $180,000 Stellar MLS as Distributed by MLS Grid
- 2025-06-19 Price Changed $190,000 Stellar MLS as Distributed by MLS Grid
- 2025-05-24 Listed $200,000 Stellar MLS as Distributed by MLS Grid
- 2024-11-18 Listing Removed — Stellar MLS as Distributed by MLS Grid
- 2024-10-14 Relisted — Stellar MLS as Distributed by MLS Grid
- 2024-10-07 Pending — Stellar MLS as Distributed by MLS Grid
- 2024-09-17 Listed $215,000 Stellar MLS as Distributed by MLS Grid
Property tax history
+14.5%/yrLatest (2025): $4,668 · +41.8% YoY. Source: county tax records.
Cash-flow waterfall
monthlySold comps — $/sqft
last 12 mo · ≤1 miLoading sold comps…