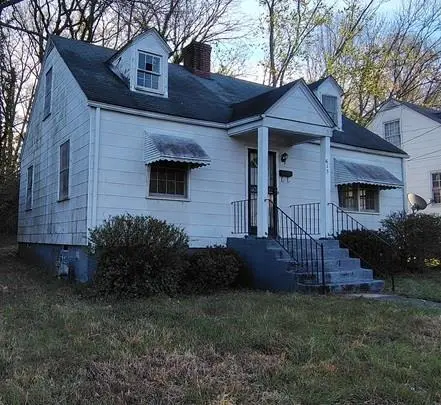
615 Southampton Ave · Danville, VA
Flood risk 1/10 · Minimal
- FEMA flood zone
- X (unshaded)
- Chance of flooding over 30 yrs
- 0.0%
- Est. flood insurance / yr
- $507 – $1,088
Fire risk 3/10 · Minor
- Est. fire insurance / yr
- $666 – $1,236
Heat risk 6/10 · Moderate
- Hot days now (above 104°F)
- 7 days/yr
- Hot days in 30 yrs
- 18 days/yr
Wind risk 4/10 · Minor
- Chance of severe wind over 30 yrs
- 9.0%
Air-quality risk 2/10 · Minimal
- Unhealthy air days now
- 0 days/yr
- Unhealthy air days in 30 yrs
- 1 days/yr
Risk factors via First Street. Map © Google.
Why this score? — see what drove the B+ grade
The composite is a weighted blend of 9 inputs, each scored 0–100. Each bar is that input's sub-score; the figure is the points it added to the 100-point composite (weight × sub-score).
- Cash flow +30.0/30.0
- ARV discount +13.5/15.0
- 1% rule +10.0/10.0
- DSCR +10.0/10.0
- Livability +3.9/5.0
- Schools +3.0/10.0
- Rent growth +2.5/5.0
- Condition / age +2.5/5.0
- Appreciation +0.0/10.0
$69,900
🖨 Deal sheet 📄 Offer letter ✓ Due diligence
Listing remarks MLS
Bring your tool belt and your team! This 1.5 story Diamond In The Ruff awaits your personal touch!! Located in extreme close proximity to the newly built Casino, 615 Southampton is ripe for the picking!! This 3bedroom 1bath is waiting for you!! Call your Favorite Realtor Today!!
Key facts
- 5,227 sq ft lot
- Built 1947
- Listed 74 days
Neighborhood map
What this means for you Summary
Snapshot
- This is a 2-bed/1.0-bath single-family listed at $70k.
Deal economics
- At list price, monthly cash flow is $578 ($7k/yr) — positive.
- The deal already cash-flows at list — no discount required.
- Meets the 1% rule at list price ($1k rent vs $70k).
- Recommended offer: $66k (6.0% below list) — sets the bar for market timing.
- Cap rate 16.2% vs local median 5.3% in Danville — top-decile yield for the area; either an underpriced asset or a hidden risk that comps aren't pricing in. Stress-test before assuming the spread holds.
Location & tenants
- Location reads 77/100 on livability (#91 in VA, #2,952 nationally) — a middle-class / working-renter tenant base. Strengths: cost of living A+, housing A+, health & safety A+; Watch: amenities D+, crime D-, commute F.
- Danville City Public School District (town): math 30% / reading 44% proficiency, ranked #128 of 131 in VA (top 98%) — families likely to look elsewhere, expect single-tenant / working-renter base with shorter leases; 71% free/reduced lunch — lower-income household profile, screen leases tightly.
- Market conditions: 245 active listings in the ZIP; 11 comparable units currently listed for rent nearby; rentals lingering (median 44d on market — plan ~5-8 weeks vacancy on turnover, expect pricing pressure); 82% of comp listings sitting > 30 days — soft ceiling on asking rent; 54 units permitted in Danville city in 2024 (40 in 5+ unit buildings).
Forward outlook
- Local home prices are declining (-3.0%/yr); year-one equity from $483 of loan paydown is wiped out by about $2k of value loss. Plan a longer hold.
- Danville County population projected to shrink 7% by 2050 — rents likely to lag national; underwrite the cash flow, not the appreciation.
- At projected returns (-3.0% appreciation + 3.0% rent growth), your $20k cash investment doubles in ~4 years — after that, you're playing with house money.
Negotiation context
- It's been on market 74 days — a 6% lower offer ($66k) is reasonable based on typical stale-listing flexibility.
Risks & watch-outs
- Watch-outs: built in 1947 — expect roof / HVAC / electrical / plumbing capex.
- Climate carrying-cost: extreme-heat days projected 7→18/yr by 2055 (HVAC capex compounding) — expect insurance premiums to compound above CPI over the hold.
Questions for the listing agent
- It's been on market 74 days. Have you received any prior offers? Is the seller open to a 6% concession, seller financing, or rate buy-down credit?
- Built in 1947 — when were the roof, HVAC, electrical panel, plumbing, and water heater last replaced?
- Why hasn't it sold? Are there any deal-killer items the seller is aware of (foundation, flood, title, zoning, code violations)?
- Is there a deadline driving the sale (1031 exchange, divorce, estate, relocation)? That informs how much negotiation room exists.
- Schools are B-rated — typically a magnet for longer-tenancy family renters. What's the average tenant stay here, and is there a school-zone premium baked into asking?
- Crime grade is D in this area — have there been break-ins, vandalism, or insurance claims at this property in the last 3 years? What carrier currently insures it and at what premium?
- What's the average days-on-market for RENTAL listings here right now (not sales)? A rising rental-DOM trend means longer vacancies and softer asking-rent achievability than the comps imply.
- What's the recent tenant-quality profile in this submarket — average credit score on applications, eviction rate, late-payment / NSF rate, and stable-employment percentage? A property-management company in the area should have these aggregated.
- How much new for-sale + rental construction is in the pipeline within 1–3 miles? Heavy new supply typically softens prices + rents 12–24 months out; constrained supply supports both.
Investment metrics
- 1% rule
- 1.81% ✓
- Cap rate
- 16.22%
- Cash-on-cash
- 35.47%
- DSCR
- 2.58
- GRM
- 4.6
CMA / ARV
- ARV (median comp)
- $80,685
- List price
- $69,900
- Delta
- -13.37%
- Verdict
- UNDERPRICED
- Comps
- 20 within 1.0 mi
Show comp detail 12 sales within ~0.75 mi
| Address | Dist | Beds/Ba | Sqft | Sold | Price | $/sf | Match |
|---|---|---|---|---|---|---|---|
| 128 Kemper Rd | 0.24mi | 3/2.0 (+1) | 1,325 (+5%) | 4mo | $190,000 | $143 | 68 |
| 225 Dudley St St | 0.10mi | 3/1.0 (+1) | 1,114 (-12%) | 8mo | $82,500 | $74 | 65 |
| 811 Kemper Rd | 0.45mi | 2/1.0 | 1,285 (+2%) | 14mo | $68,000 | $53 | 64 |
| 806 Hughes St | 0.42mi | 2/1.0 | 1,127 (-11%) | 5mo | $85,000 | $75 | 59 |
| 108 Harris Pl | 0.35mi | 3/1.0 (+1) | 1,125 (-11%) | 13mo | $117,500 | $104 | 50 |
| 1218 Paxton St | 0.66mi | 2/2.0 | 1,184 (-6%) | 8mo | $98,000 | $83 | 49 |
| 150 Westmore Dr | 0.73mi | 3/2.0 (+1) | 1,225 (-3%) | 9mo | $126,500 | $103 | 45 |
| 111 Howeland Cir | 0.43mi | 3/1.0 (+1) | 1,088 (-14%) | 12mo | $149,000 | $137 | 42 |
| 1206 Forest St | 0.68mi | 3/1.0 (+1) | 1,398 (+11%) | 6mo | $55,000 | $39 | 40 |
| 140 Mabin St | 0.73mi | 3/2.0 (+1) | 1,320 (+5%) | 13mo | $240,000 | $182 | 38 |
| 107 Canterbury Rd | 0.75mi | 2/1.0 | 1,078 (-14%) | 6mo | $135,000 | $125 | 36 |
| 73 Baltimore Ave | 0.74mi | 3/1.0 (+1) | 1,134 (-10%) | 13mo | $140,000 | $123 | 33 |
Match score weights: distance 35% · size 25% · config 20% · recency 20%. Top-matched comps best support the ARV.
Projected returns pro-forma
-3.0% appreciation · 3.0% rent growth · sell at horizon
- IRR
- 31.1%
- Equity multiple
- 2.30×
- Total profit
- $25,497
- Equity at exit
- $10,422
- IRR
- 38.2%
- Equity multiple
- 4.55×
- Total profit
- $69,565
- Equity at exit
- $6,044
Cash invested: $19,572 (down + closing). Projections, not guarantees.
Landlord ↔ Tenant lean methodology
- Overall (STATE)
- 55 Moderately Landlord-Leaning
- State Virginia
- 55 Moderately Landlord-Leaning · D+2
- County
- — inherits STATE
- City
- — inherits STATE
ZIP-level market 24541
- Home prices YoY
- -17.1%
- Active inventory
- 245
- Price-to-rent
- 4.6×
Monthly cashflow live
- Estimated rent
- $1,265 high interval (Pro) →
- Mortgage (P&I)
- −$367
- Tax from tax record
- −$25 /mo · $305/yr
- Insurance
- −$29
- HOA
- −$0
- Vacancy / Maint / Mgmt
- −$266
- Net cashflow
- $578
Break-even live
UW: 25.0% down · 7.5% · 30yr · 1.5% tax · 5.0% vac · 8.0% maint · 8.0% mgmt
Financing live
Cash to close
- Down payment
- $17,475
- Closing costs
- $2,097
- Reserves months
- —
- Total cash needed
- —
Loan-product check · same deal, 3 products live
Conventional
25% down · 7.5% · 30yr
- Down + closing
- —
- Monthly P&I
- —
- Monthly cashflow
- —
- DSCR
- —
- Eligible?
- —
Personal DTI + credit; lowest rate.
DSCR
20% down · 8.5% · 30yr
- Down + closing
- —
- Monthly P&I
- —
- Monthly cashflow
- —
- DSCR
- —
- Eligible?
- —
No personal income docs; deal must DSCR.
Hard money
10% down · 12.0% · 12mo
- Down + closing
- —
- Monthly P&I
- —
- Monthly cashflow
- —
- DSCR
- —
- Eligible?
- —
Short-term bridge; refi at stabilization.
Rent comps 11 comps
| Address | Beds | Baths | Sqft | Rent | $/sqft | DOM | Units | Dist |
|---|---|---|---|---|---|---|---|---|
| 732 Hughes St Danville, VA | 2.0 | 1.0 | 900 | $1,800 | $2.00 | 43d | 1 | 0.42mi |
| 721 Chatham Ave Unit A Danville, VA | 3.0 | 1.0 | 950 | $1,350 | $1.42 | 13d | 1 | 0.44mi |
| 345 Flint St Danville, VA | 2.0 | 1.0 | 888 | $1,200 | $1.35 | 43d | 1 | 0.46mi |
| 181 Banner St Danville, VA | 3.0 | 1.0 | 1176 | $1,389 | $1.18 | 43d | 1 | 0.62mi |
| 107 Baltimore Ave Danville, VA | 2.0 | 1.0 | 902 | $914 | $1.01 | 21d | 1 | 0.82mi |
| 240 Lady Astor Pl Unit 241-10 Danville, VA | 2.0 | 1.5 | 1246 | $1,100 | $0.88 | 43d | 1 | 0.89mi |
| 240 Lady Astor Pl Unit 241-3 Danville, VA | 2.0 | 2.0 | 1246 | $1,130 | $0.91 | 43d | 1 | 0.89mi |
| 423 Chestnut St Unit 1 Danville, VA | 2.0 | 1.0 | 1200 | $1,400 | $1.17 | 43d | 1 | 1.08mi |
| 717 Temple Ave Danville, VA | 3.0 | 1.5 | 1327 | $1,179 | $0.89 | 43d | 1 | 1.25mi |
| 712 Edwin Ct Danville, VA | 2.0 | 1.0 | 969 | $700 | $0.72 | 43d | 1 | 1.40mi |
| 66 Carlson Ave Danville, VA | 2.0 | 1.0 | 966 | $1,000 | $1.04 | 43d | 1 | 1.49mi |
Listing history 6 events
-
2026-06-02days on market $69,900 Active 74 DOM
-
2026-06-01days on market $69,900 Active 73 DOM
-
2026-05-31days on market $69,900 Active 72 DOM
-
2026-05-30days on market $69,900 Active 71 DOM
-
2026-04-24price $69,900 279-char remark
Show marketing remark (279 chars)
Bring your tool belt and your team! This 1.5 story Diamond In The Ruff awaits your personal touch!! Located in extreme close proximity to the newly built Casino, 615 Southampton is ripe for the picking!! This 3bedroom 1bath is waiting for you!! Call your Favorite Realtor Today!!
-
2026-03-20$74,900 Active 279-char remark
Show marketing remark (279 chars)
Bring your tool belt and your team! This 1.5 story Diamond In The Ruff awaits your personal touch!! Located in extreme close proximity to the newly built Casino, 615 Southampton is ripe for the picking!! This 3bedroom 1bath is waiting for you!! Call your Favorite Realtor Today!!
ⓘ Source: listings_history table (triggers on properties + properties_extension) + one-shot
backfill from property_details.listing_events for pre-trigger history.
Tax reassessment forecast VA · Resets to sale price
- Current annual tax
- $305 · $25/mo
- Projected year-2 tax
- $573 · $48/mo
- Expected delta
- +$269/yr (+$22/mo · 88.2%)
ⓘ Screening estimate from a state-policy table — verify with the county assessor before closing.
Climate risk First Street
- Flood 1/10 Low FEMA zone X (unshaded) · 0% chance over 30 yrs
- Wildfire 3/10 Moderate
- Heat 6/10 Major 7 d/yr ≥104°F today · 18 d/yr by 30 yrs out
- Wind 4/10 Moderate 9% chance of damaging wind over 30 yrs
- Air quality 2/10 Low 0 unhealthy d/yr today · 1 by 30 yrs out
Nearby sold comps map
Loading sold comps map…
Walkable amenities ~0.75 mi
Loading nearby amenities…
Taxation est. · year 1
- Rental income
- $15,183
- − Mortgage interest
- −$3,915
- − Property taxes
- −$305
- − Insurance
- −$350
- − Repairs & maintenance
- −$1,215
- − Management
- −$1,215
- − Depreciation
- −$2,033
- Taxable income
- $6,150
- Est. tax owed @ 24.0%
- −$1,476
- After-tax cash flow
- $5,465/yr
For passive investors: Depreciation is non-cash, so a rental often shows a tax loss while cash-flowing — sheltering income. Rental losses are passive: they offset passive income freely, and up to $25,000/yr can offset ordinary (W-2) income if you actively participate and your MAGI is under $100k (phasing out to $0 by $150k); unused losses carry forward. On sale, claimed depreciation is recaptured at up to 25%, and gains may owe capital-gains tax (a 1031 exchange can defer both). Figures are a year-1 estimate at your 24.0% rate — not tax advice; consult a CPA.
Schools (NCES district)
- District
- Danville City Public School District
- NCES district ID
- 5101110
- Math proficiency
- 30% ▼ -22.00%
- Reading proficiency
- 44% ▼ -8.00%
- Median HH income
- $31,952
- Composite
- 30.23/100
- National rank
- #6298
- State rank
- #128 of 131 in VA
Livability — Danville
- Score
- 77/100
- State rank
- #91
- US rank
- #2952
Category grades
Schools grade is shown separately in the Schools card above.
Census & demographics
- Census place
- Danville, VA
- County
- Danville City · 59,055 people
- City population
- 59,055
- Metro
- Danville, VA
- Population (ZIP)
- 28,042
- Household income
- $51,427
- Rent vs Own
- Severe rent burden
- 1399.0
Population outlook (Danville County) Hauer SSP2
- Today (2025)
- 40,989 people
- By 2030
- 40,432 · -1.4%
- By 2040
- 39,255 · -4.2%
- By 2050
- 38,035 · -7.2%
- By 2075
- 35,612 · -13.1%
- By 2100
- 30,365 · -25.9%
Race, ethnicity, and origin ACS 2023
- Neighborhood character
- Diverse neighborhood (Simpson 0.59)
- Race & ethnicity
- White 50% Black 39% Two or more races 7% Hispanic / Latino 5% Asian 2%
- Common ancestry
- Slovak 2% Serbian 2% Lithuanian 1%
- Foreign-born
- 4% · Canada, Dominican Republic
- Languages at home
- 95% English-only · Spanish 4% Other Indo-European 1%
Political lean MEDSL · Danville
- 2024 margin
- Strong D (+21.1) · D 60.1% · R 39.0%
- 2008→2024 swing
- +1.9pp toward D · 2008: 19.1pp · 2024: 21.1pp
- All cycles
- 2024: D+21.1 2020: D+22.1 2016: D+19.9 2012: D+22.1 2008: D+19.1
Not yet ingested
- Civics
- —
Market trends
- HPI YoY
- ▼ -49.28%
- Current HPI
- 238.5992
- Rent YoY
- —
- Metro
- Danville, VA
- State GDP YoY
- ▲ 2.40%
- F500 in state
- 50
Industry mix (Fortune 500 HQ in VA)
| Industry | F500 HQs | Revenue |
|---|---|---|
| Aerospace / Defense | 4 | $236B |
|
||
| Technology / Defense | 3 | $32B |
|
||
| Financial Services | 2 | $176B |
|
||
| Utilities | 2 | $27B |
|
||
| Insurance | 2 | $25B |
|
||
| Technology | 2 | $15B |
|
||
Price history
-6.7% since first listed2 events — show timeline
- 2026-04-24 Price Changed $69,900 DRRAR
- 2026-03-20 Listed $74,900 DRRAR
Property tax history
+0.3%/yrLatest (2025): $305 · +0.0% YoY. Source: county tax records.
Cash-flow waterfall
monthlySold comps — $/sqft
last 12 mo · ≤1 miLoading sold comps…